Graham, Ted and Margaret for all their help. I would like to wish Mick a .... 3.1 Endsley [48]'s proposed model of situation awareness . . . . . . . . . 31 ...... Bell and Lyon [16] note that even external observers can be biased from the subject's ...... mance, awarded if the percentage of the area covered is more than 80%. It is set to.
Performance metrics and human-robot interaction for teleoperated systems by
Ioannis Gatsoulis
Submitted in accordance with the requirements for the degree of Doctor of Philosophy
The University of Leeds School of Mechanical Engineering
April, 2008
The candidate confirms that the work submitted is his own and that the appropriate credit has been given where references have been made to the work of others. This copy has been supplied on the understanding that it is copyright material and that no quotation from the thesis may be published without proper acknowledgement.
Abstract This thesis investigates human factors issues in the design and development of effective human-robot interfaces for emerging applications of teleoperated, cooperative mobile robot systems in situations such as urban search and rescue. Traditional methods of designing human-robot interaction interfaces have failed to produce effective results as witnessed in the post September 11 search operations. The thesis adopts a user-centric approach based on the human factors of situation awareness, telepresence and workload to support the human operator because this is widely accepted as the best way of realising increased levels of collaboration between humans and robotic systems, working as a partnership to perform a complex task. The measurement of these human factors has not been explored within the robotic community in any significant way. The measurement of these subjective and complex issues is addressed in this thesis by looking to the flight traffic control domain where researchers have developed many methods of determining how to quantify the quality of situation awareness, the level of workload and the level of telepresence of the people in the aircrafts and on the ground. Based on these methods, the research proposes five new methods (ASAGAT, QASAGAT, CARS, PASA, SPASA) for measuring situation awareness, three methods (WSPQ, SUSPQ, SPATP) for measuring telepresence and three methods (NASA-TLX, MCHS, FSWAT) for measuring workload. A comprehensive comparison between them has shown that QASAGAT and SPASA are the most reliable and accurate for measuring situation awareness, SPATP for measuring telepresence and FSWAT for measuring workload. For the measurement of performance a new method has been developed, which is felt to be more objective for the urban search and rescue scenario than the metrics used in the RoboCup Rescue competition. Simulation studies involved extensive investigations to determine the various software tools and platforms that are available for realising robot urban search and rescue scenarios. The software of Player-Gazebo was selected as the best solution.
A graphical user interface comprising vision, laser data, map, robot locations, etc. was developed and assessed with the proposed measurement methods under the simulated robot system and search scenarios. The test subjects comprised specialist end users as well as general non-end users. An in-between groups analysis showed that the individual characteristics of each group may have some effect on the experimental variables, however, this effect is very minimal and the main influence factors are the interaction interfaces and the human factors investigated here. Moreover, the results indicated that there is no significant benefit when using professional urban search and rescue end users. Correlation analysis on the data has shown that situation awareness and telepresence have a positive effect on performance, while workload negatively affects performance. It was also found that there is a positive correlation between situation awareness and telepresence, while workload has a negative effect on both. These results validate the assumptions made. A multiple linear regression model has been developed to further understand the individual contributions of each human factor in the overall performance achieved. The limited prediction capabilities of the linear model suggested a non-linear relationship. For this reason, a non-linear model using an artificial neural network trained with the backpropagation algorithm has also been developed. The resulting neural network is able to predict the response variables more precisely and is shown to be able to generalise well to unseen cases. A physical mobile teleoperated urban search and rescue robot system has also been developed for realising future real world trials.
To the strange unknown, to pure curiosity and to raw passion; the driving forces of every beautiful journey.
To my parents, as a small token of gratitude and appreciation.
Acknowledgements Although a PhD is a journey that someone has to travel on his own, there are a number of people that play an important role on reaching your destination and I would like to thank. I would like to thank my supervisor Prof. Gurvinder Singh Virk for his invaluable support, encouragement and guidance throughout the PhD, even when there was an 11 hour difference between us. I would also like to thank my supervisor Dr. Abbas Dehghani for his great help and support over the last stages of the PhD. I would like to thank the excellent and friendly support staff in the School of Mechanical Engineering. In particular, I would like to thank Mick, Dave, Tony, Graham, Ted and Margaret for all their help. I would like to wish Mick a very happy retirement. I would like to thank all the people that participated into this study. These namely are Captain Peter Philips and the Urban Search and Rescue task force of the West Yorkshire Fire and Rescue Service at Cleckheaton; Dr. Konstantinos Milios and all the paramedics of EKAB from the Ioannina and Corfu branches; and finally all my fellow colleagues. I would like to thank the Engineering and Physics Research Council for providing me with a PhD scholarship. I would like to thank all my friends that made all the good times even better and all the bad ones much easier. Last, but not least, I would like to thank my parents Niko and Kiki for their continual love and support. I would also like to thank the rest of my family, in particular my granparents, the kindest souls I know.
Contents
1 Introduction
1
1.1
Means of human-robot interaction . . . . . . . . . . . . . . . . . . . .
2
1.2
Differences of human-robot interaction from other domains . . . . . .
3
1.3
User-centric design and assessment . . . . . . . . . . . . . . . . . . .
5
1.4
Aims of research
. . . . . . . . . . . . . . . . . . . . . . . . . . . . .
7
1.5
Objectives of research . . . . . . . . . . . . . . . . . . . . . . . . . . .
9
1.6
Relevance of the urban search and rescue domain . . . . . . . . . . .
9
1.6.1 1.7
Limitations of current systems . . . . . . . . . . . . . . . . . . 12
Summary . . . . . . . . . . . . . . . . . . . . . . . . . . . . . . . . . 14
2 Software Tools for Robotic R&D
16
2.1
Selection criteria . . . . . . . . . . . . . . . . . . . . . . . . . . . . . 17
2.2
Measurement scales . . . . . . . . . . . . . . . . . . . . . . . . . . . . 19
2.3
Urban search and rescue requirements . . . . . . . . . . . . . . . . . . 20
2.4
Comparison of the system-task simulators . . . . . . . . . . . . . . . 22
2.5
Limitations . . . . . . . . . . . . . . . . . . . . . . . . . . . . . . . . 25
2.6
Post-evaluation of Player-Gazebo . . . . . . . . . . . . . . . . . . . . 26
2.7
Summary . . . . . . . . . . . . . . . . . . . . . . . . . . . . . . . . . 26
3 Theory and Measurement 3.1
28
Situation awareness . . . . . . . . . . . . . . . . . . . . . . . . . . . . 28 3.1.1
Definitions . . . . . . . . . . . . . . . . . . . . . . . . . . . . . 29 i
3.2
3.3
3.4
3.1.2
Theories and models . . . . . . . . . . . . . . . . . . . . . . . 30
3.1.3
Measurement methods . . . . . . . . . . . . . . . . . . . . . . 36
3.1.4
Situation awareness and human-robot interaction . . . . . . . 44
3.1.5
Dimensions of situation awareness . . . . . . . . . . . . . . . . 46
3.1.6
Proposed methods for measuring situation awareness . . . . . 49
Telepresence . . . . . . . . . . . . . . . . . . . . . . . . . . . . . . . . 57 3.2.1
Definitions . . . . . . . . . . . . . . . . . . . . . . . . . . . . . 57
3.2.2
Theories and models . . . . . . . . . . . . . . . . . . . . . . . 58
3.2.3
Measurement methods . . . . . . . . . . . . . . . . . . . . . . 60
3.2.4
Telepresence and human-robot interaction . . . . . . . . . . . 65
3.2.5
Proposed methods for measuring telepresence . . . . . . . . . 66
Workload . . . . . . . . . . . . . . . . . . . . . . . . . . . . . . . . . 69 3.3.1
Definitions . . . . . . . . . . . . . . . . . . . . . . . . . . . . . 69
3.3.2
Measurement methods . . . . . . . . . . . . . . . . . . . . . . 70
3.3.3
Workload and human-robot interaction . . . . . . . . . . . . . 74
3.3.4
Proposed methods for measuring workload . . . . . . . . . . . 75
Performance . . . . . . . . . . . . . . . . . . . . . . . . . . . . . . . . 78 3.4.1
Proposed method for measuring performance . . . . . . . . . . 79
3.5
Experimental scenario . . . . . . . . . . . . . . . . . . . . . . . . . . 82
3.6
Experimental resources . . . . . . . . . . . . . . . . . . . . . . . . . . 82 3.6.1
Software and hardware . . . . . . . . . . . . . . . . . . . . . . 82
3.6.2
Virtual robot platform . . . . . . . . . . . . . . . . . . . . . . 82
3.6.3
Real robot platform . . . . . . . . . . . . . . . . . . . . . . . . 83
3.6.4
Human-robot interaction graphical user interface . . . . . . . 85
3.6.5
Experimental arenas . . . . . . . . . . . . . . . . . . . . . . . 86
3.7
Experimental procedure . . . . . . . . . . . . . . . . . . . . . . . . . 88
3.8
Experimental set . . . . . . . . . . . . . . . . . . . . . . . . . . . . . 89
3.9
Summary . . . . . . . . . . . . . . . . . . . . . . . . . . . . . . . . . 89
4 Method Selection and Hypotheses Validation 4.1
92
Method selection . . . . . . . . . . . . . . . . . . . . . . . . . . . . . 92 4.1.1
Criteria for method selection . . . . . . . . . . . . . . . . . . . 93
4.1.2
Comparison of the measurement methods . . . . . . . . . . . . 94
4.2
Hypotheses testing . . . . . . . . . . . . . . . . . . . . . . . . . . . . 97
4.3
Summary . . . . . . . . . . . . . . . . . . . . . . . . . . . . . . . . . 101
5 Relations and Modelling
103
5.1
Differences between the groups of subjects . . . . . . . . . . . . . . . 104
5.2
Linear modelling: Multiple linear regression . . . . . . . . . . . . . . 106
5.3
5.4
5.2.1
Results and discussion . . . . . . . . . . . . . . . . . . . . . . 107
5.2.2
Model assessment and limitations . . . . . . . . . . . . . . . . 112
Non-linear modelling: Neural networks . . . . . . . . . . . . . . . . . 116 5.3.1
Data preparation . . . . . . . . . . . . . . . . . . . . . . . . . 118
5.3.2
The architecture of the neural network . . . . . . . . . . . . . 119
5.3.3
Revisiting the issue of noise in the dataset . . . . . . . . . . . 122
5.3.4
Determining the length of the hidden layer . . . . . . . . . . . 123
5.3.5
Final model . . . . . . . . . . . . . . . . . . . . . . . . . . . . 129
Summary . . . . . . . . . . . . . . . . . . . . . . . . . . . . . . . . . 133
6 Conclusions
136
6.1
Summary of contributions . . . . . . . . . . . . . . . . . . . . . . . . 141
6.2
Further research work . . . . . . . . . . . . . . . . . . . . . . . . . . . 143
References
145
A ASAGAT: Analogue Situation Awareness Global Assessment Technique
171
A.1 Factors and subscales . . . . . . . . . . . . . . . . . . . . . . . . . . . 172 Appendices
B CARS: Crew Awareness Rating Scale
174
C PASA: Post Assessment of Situation Awareness
177
C.1 Dimensions . . . . . . . . . . . . . . . . . . . . . . . . . . . . . . . . 179 D SPASA: Short Post Assessment of Situation Awareness
180
D.1 Dimensions . . . . . . . . . . . . . . . . . . . . . . . . . . . . . . . . 182 E WSPQ: Witmer–Singer Presence Questionnaire
183
E.1 Dimensions of the items . . . . . . . . . . . . . . . . . . . . . . . . . 186 F MSUSPQ: Modified Slater–Usoh–Steed Presence Questionnaire
188
G SPATP: Short Post Assessment of Telepresence
191
G.1 Dimensions of the items . . . . . . . . . . . . . . . . . . . . . . . . . 194 H TLX: NASA Task Load Index
195
I
197
MCHS: Modified Cooper–Harper Scale
J FSWAT: Fast Subjective Workload Assessment Technique
198
K Neural Network Weights
199
L List of Publications
202
List of Figures 1.1
Setup of a robot teleoperation task . . . . . . . . . . . . . . . . . . .
1
1.2
Typical search and rescue operating environments . . . . . . . . . . . 10
1.3
US FEMA USAR TF organisational structure . . . . . . . . . . . . . 12
1.4
USAR robot operations in the World Trade Centre . . . . . . . . . . 13
2.1
Typical search and rescue operating environments . . . . . . . . . . . 21
2.2
Screenshots of the top two rated system-task simulators . . . . . . . . 23
2.3
Screenshots of recent developments of system-task simulators . . . . . 25
3.1
Endsley [48]’s proposed model of situation awareness . . . . . . . . . 31
3.2
Adams et al. [3]’s extended version of Neisser [134]’s perception-action cycle model on situation awareness . . . . . . . . . . . . . . . . . . . 33
3.3
Neisser [134]’s perception-action cycle model as proposed by Smith and Hannock [167] for situation awareness . . . . . . . . . . . . . . . 34
3.4
Flach [56]’s model of situation awareness as a behavioural phenomenon 35
3.5
Robot platform . . . . . . . . . . . . . . . . . . . . . . . . . . . . . . 83
3.6
Block diagram of the robot architecture . . . . . . . . . . . . . . . . . 84
3.7
The graphical user-robot interaction interface . . . . . . . . . . . . . 86
3.8
Training arena . . . . . . . . . . . . . . . . . . . . . . . . . . . . . . . 87
3.9
Experimental arena . . . . . . . . . . . . . . . . . . . . . . . . . . . . 87
4.1
Boxplots showing the outlier values . . . . . . . . . . . . . . . . . . . 98
4.2
Normal Q-Q plot on the data sets of the experimental variables . . . 99 v
5.1
Overall mean scores of performance, situation awareness, telepresence and workload for the different types of subjects . . . . . . . . . . . . 104
5.2
Boxplot showing the outlier values of performance . . . . . . . . . . . 107
5.3
Scatterplots of the actual values of performance with the fitted ones from the two models . . . . . . . . . . . . . . . . . . . . . . . . . . . 116
5.4
Diagram of the conceptual neural network model . . . . . . . . . . . 121
5.5
Example neural network training sessions . . . . . . . . . . . . . . . . 125
5.6
Diagram of the final neural network model . . . . . . . . . . . . . . . 129
5.7
Graph of the training and the validation mean square errors of the final neural network model . . . . . . . . . . . . . . . . . . . . . . . . 131
5.8
Plot of the actual data with the fitted ones from the linear and the non-linear models . . . . . . . . . . . . . . . . . . . . . . . . . . . . . 132
H.1 NASA-TLX software version in C/Glade-Gtk+ I.1
. . . . . . . . . . . . 196
Flowchart of the Modified Cooper-Harper Scale . . . . . . . . . . . . 197
J.1 FSWAT software version in C/Glade-Gtk+ . . . . . . . . . . . . . . . 198
List of Tables 1.1
Total number of disasters and people affected from them (1970-2006)
10
1.2
Damage costs from disasters (1970-2006) . . . . . . . . . . . . . . . . 11
2.1
Assessment of system-task simulator tools . . . . . . . . . . . . . . . 23
3.1
Explicit measurement methods of situation awareness . . . . . . . . . 38
3.2
Pros and cons of explicit measurement methods of situation awareness 40
3.3
Implicit measurement methods of situation awareness . . . . . . . . . 41
3.4
Pros and cons of implicit measurement methods of situation awareness 42
3.5
Subjective measurement methods of situation awareness
3.6
Pros and cons of subjective measurement methods of situation aware-
. . . . . . . 43
ness . . . . . . . . . . . . . . . . . . . . . . . . . . . . . . . . . . . . 45 3.7
Mapping of the items in SPASA with the ones in PASA and CARS . 55
4.1
Descriptive statistics for the measurement methods of the experimental variables (N = 30) . . . . . . . . . . . . . . . . . . . . . . . . . . 94
4.2
Spearman ρ, one-tail correlations with performance, N = 30 . . . . . 97
4.3
Tests of normality (df = 63) . . . . . . . . . . . . . . . . . . . . . . . 98
4.4
P earson r, one-tail correlations, N = 63 . . . . . . . . . . . . . . . . 100
5.1
Mapping of the QASAGAT items to the SPASA ones . . . . . . . . . 107
5.2
Multiple linear regression coefficients . . . . . . . . . . . . . . . . . . 109
5.3
Multiple linear regression minimal model using stepwise method with the Akaike Information Criterion . . . . . . . . . . . . . . . . . . . . 112 vii
5.4
Transformed errors of neural network with 3 hidden nodes for different values of learning rate (η) (NT: noisy trials) . . . . . . . . . . . . . . 127
5.5
Transformed errors of neural network with 5 hidden nodes for different values of learning rate (η) (NT: noisy trials) . . . . . . . . . . . . . . 127
5.6
Transformed errors of neural network with 9 hidden nodes for different values of learning rate (η) (NT: noisy trials) . . . . . . . . . . . . . . 128
5.7
Transformed errors of neural network with 13 hidden nodes for different values of learning rate (η) (NT: noisy trials) . . . . . . . . . . . 128
List of Abbreviations & Symbols ANN
Artificial Neural Network(s)
ATC/M
Air Traffic Control/Management
GUI
Graphical User Interface
HCI
Human–Computer Interaction
HRI
Human–Robot Interaction
NIST
National Institute of Standards and Technology
P
Performance, also refers to task performance
R&D
Research & Development
SA
Situation awareness
SAR
Search And Rescue
TP
Telepresence
USAR
Urban Search And Rescue
WL
(Mental, task) Workload
A
Anderson–Darling test for normality
a
, b,
c
Significant at .1, .05, .01 level
df
degrees of freedom
µ
Mean
M SE
Mean Square Error
r
Pearson’s correlation coefficient
RM SE
Root Mean Square Error ix
N
Sample size
SE
Standard Error
V ar
Variance
W
Shapiro–Wilk test for normality
η
Learning rate of backpropagation
ρ
Spearman’s correlation coefficient
σ, SD
Standard Deviation
List of Measurement Methods The following is a list of the abbreviations of the most frequently referred measurement methods in this thesis. ASAGAT
Analogue Situation Awareness Global Assessment Technique
CARS
Crew Awareness Rating Scale
FSWAT
Fast Subjective Workload Assessment Technique
MCHS
Modified Cooper–Harper Scale
MSUSPQ
Modified Slater–Usoh–Steed Presence Questionnaire
NASA-TLX
NASA Task Load Index
PASA
Post Assessment of Situation Awareness
QASAGAT
Quantitative Analogue Situation Awareness Global Assessment Technique
SAGAT
Situation Awareness Global Assessment Technique
SPASA
Short Post Assessment of Situation Awareness
SPATP
Short Post Assessment of Telepresence
SUSPQ
Slater–Usoh–Steed Presence Questionnaire
SWAT
Subjective Workload Assessment Technique
WSPQ
Witmer–Singer Presence Questionnaire
xi
Chapter 1 Introduction The most common method of robot control is teleoperation [23], particularly in critical domains such as search and rescue, bomb disposal, space exploration, military applications, etc., where the actions taken due to safety reasons should always be decided by the human operators rather than the system itself. A typical setup teleoperation, shown in Figure 1.1, consists of one or more human users controlling one or more robots from a station remote to the operating environment through some kind of interaction interface. In order for humans and robots to effectively collaborate in a particular task, it is of vital importance to have performance effective, natural and safe means of interaction between them. These interactions are the main focus of research of the human-robot interaction (HRI) field. It is a multidisciplinary field [23] with in-
Interaction Interface Local Environment
Robot Remote Operational Environment
Figure 1.1: Setup of a robot teleoperation task
1.1 Means of human-robot interaction
2
fluences and contributions from human-computer interaction, artificial intelligence, cognitive science, psychology, human factors, ergonomics, mechatronics, virtual reality, and others. Currently, there is no formal definition of HRI, as the field is very new and the term itself seems to be self-explanatory; i.e., it is the research field that includes all the issues that arise when a human has to work and interact with a robot. However such an explanation is vague and does not imply anything about what these issues are in some higher resolution. Moreover, the benefit of having a definition is that everybody can speak a common language. As mentioned, one of the fields of influence and similar to some respects to HRI is human-computer interaction (HCI). Hewett et al. [81] define HCI as “as a discipline concerned with the design, evaluation and implementation of interactive computer systems for human use, and with the study of major phenomena surrounding them”. On the same lines HRI can be defined as: a discipline concerned with the design, evaluation and implementation of interactive robotic systems for human use, support and assistance, as well as with the study of major phenomena surrounding them.
1.1
Means of human-robot interaction
Humans use verbal language and body expressions to interact and communicate with each other, and although such a way of interaction might seem convenient when interacting with humans, there is the question of whether it is the most effective one when interacting with teleoperated robots. Fong et al. [58] state that if there are many tasks to be executed or the task execution creates many questions, then dialogue creates increased complexity to the system and can be distracting, which leads to reduced levels of performance. They further point out that for an intelligent system to engage in a natural language dialogue a detailed knowledge of the possible states, parameters and appropriate values for them for a given task
1.2 Differences of human-robot interaction from other domains
3
must be known; something which is very complicated and next to impossible for complex and dynamic domains. As Allen [6, §1.4] mentions natural language understanding includes phonetic and phonological knowledge, morphological knowledge, syntactic knowledge and semantic knowledge, like natural processing, but on top of that it also involves pragmatic and world knowledge. Such level of cognition in robot systems is unreachable at the moment. Moreover, verbal communication and body expressions require anthropomorphic characteristics from the robots, which are inappropriate for a large number of systems and applications. For all these reasons, alternative means of interaction, such as command languages and graphical user interfaces, can be more beneficial in the case of teleoperated robots. Command languages can be powerful and flexible, but at the same time they can also be time consuming and they require the user to have deep knowledge about them. This is why graphical user interfaces are much more commonly used, as they are user friendly and require much less training to use them.
1.2
Differences of human-robot interaction from other domains
The design and assessment of graphical user interfaces has been one of the main focuses of research in the domain of human-computer interaction, and although some of the lessons learnt can be adopted by human-robot interaction, there are some fundamental differences between the two. These are nicely addressed in Clarke [28, 29]’s analysis of the Asimov’s stories and his famous “laws of robotics”. These “laws” ensure the safe operation of the robots when working with humans. Asimov’s robots are very much intelligent and try to always obey these laws. However, if these laws are to be somehow violated, then the robots fall into a “deadlock ”, a complete system shutdown. The issue of safety is so important that for a roboticist to develop a robot without these laws is something “unspeakable” [12].
1.2 Differences of human-robot interaction from other domains
4
Current robotic safety standards are nowhere near these laws, mainly because of our limited achievements in artificial intelligence. As such, the current safety standards for industrial robots [9; 88] are mainly governed in a high level by separating the robots from the humans, and in the case that a human enters its workspace, then the system should perform an emergency shut down or control its part output and operation. Considering though the growing use of service and domain critical robots that need to interact with humans for effective operation, new safety standards that approximate Asimov’s laws and robots are needed. To date, research on safety measurements for personal care and critical domain robots has focused on recognising humans and preventing collisions with them [72; 79; 107; 179]. In other words, human safety is ensured through avoidance. Most recent work which has evolved into operational safety standards introduces other safety measures, such as variable speed in the presence of a human, clear indicators on the action that the robot is performing, etc. [89] The important point here is that unlike computers, robots are complex, dynamic, control systems, that exhibit autonomy and cognition and operate in unstructured and changing environments [57; 154], which are capable of unintentionally harming or even killing a human being. Considering the limited capabilities in the intelligence and autonomy that current robot systems have, it is preferable in critical domains, such as search and rescue, military and security operations, space exploration, etc., to have the human user responsible for making all the decisions. This means that the human user is also responsible for the safety of the actions of the robot. As such, in order for the user to be effective, it is important that he/she possesses a good understanding of the situation, as well as what is the effect of his/her decisions and actions. It is therefore clear the important role that the human-robot interaction interfaces play, as they are the main and possibly the only means through which the human user executes his/her decisions and receives feedback on them and on the situation of the world.
1.3 User-centric design and assessment
1.3
5
User-centric design and assessment
Despite their differences human-robot interaction can benefit from the long experience of human-computer interaction, which has lead into the quite mature interface guidelines for a number of systems [10; 17; 104; 123]. The aim of these guidelines is to provide a consistent feel and look among the applications, so that they would be easy to learn for new users. However, so far the designers of human-robot interaction interfaces completely ignore them [139] and each system seems to “re-invent the wheel”. Most importantly it is ignored the common suggestion of adopting a user-centric approach to the design and assessment of the developed systems. It was discussed in Section 1.2 that in the domain of teleoperated robots, the user’s situation awareness consists a main requirement for effective decision making [101; 160]. Recent field studies in a typical application of teleoperated robots, that of urban search and rescue, have shown that current systems do not effectively support the users in this way [21; 22; 25], something that has been recognised by the research community as a priority one issue [23]. On one experimental study the effect of situation awareness on telepresence, another human factor claimed to be affecting task performance [196], was investigated in a robot de-mining task [145]. The findings from this study were a bit surprising, as they indicated that situation awareness and telepresence have a statistical insignificant negative correlation to each other on a linear regression model that was developed. Moreover, correlation analysis from this same study, found that the overall situation awareness had a small contribution to performance, while one particular dimension of situation awareness had a strong negative effect to performance. All these results, as also noted by Riley, were a bit surprising. Although she provided several reasonable explanations on why these relations may have occurred, she failed to address some important limitations on the way she had measured performance and situation awareness. Performance was measured as time-to-mine neutralisation,
1.3 User-centric design and assessment
6
this being the time from the beginning of the subject’s search for a mine until the successful neutralisation of it. The subjects performed the task in three arenas of varying level of difficulty, which according to Riley it was determined by the total number of mines existing in the arena; the larger the number of the available mines, the denser their spatial distribution was and hence the easier the task. Riley’s hypothesis was that as the level of difficulty decreases then the subject’s performance would increase, i.e. it would require less time to detect and neutralise a mine. However, this assumption is profound as it is dictated by physical laws, i.e. it will take less time to cover a smaller distance considering that the speed is constant. For this reason, Riley’s way of measuring performance is inaccurate, as it is like saying that it is easier to run 100m than 400m because of the smaller distance required to be covered, and that the hypothesis is that the runner of the 100m is expected to have a better performance over the runner of the 400m, i.e. he/she is expected to have a faster time; something that is profound and it does not constitute a measure of the difficulty of the race or of the performance of the athletes. A second limitation in Riley’s study is on her measurement of situation awareness in relation to performance. She used a list of sixteen items to investigate the level of situation awareness of the subject1 , however, only one of them is related with the searching for a mine stage, which as previously explained plays an important role in the measurement of performance. As such, the two variables are partially related to each other, something that seemed to influence the correlation results found by Riley. Unlike situation awareness, telepresence has a longer research history in the area of telerobotics [162], however, there is still no clear consensus on its effect on task performance with many theoretical and measurement issues to be resolved [80]. The theories and measurement methods behind both of these human factors are discussed in detail in Sections 3.1 and 3.2. Mental workload is another human factor that has also been of interest and be1
The SAGAT methodology was used, which is presented later in Section 3.1.3.
1.4 Aims of research
7
lieved to be affecting task performance. Although, it has been an interest of research in automation for more than thirty years [126], recent work in the area of telerobotics is investigating its effect not only with task performance but in conjunction with situation awareness [101; 156] and telepresence [40; 145]. The theories and in particular the measurement methods behind workload are also discussed in more detail in Section 3.3.
1.4
Aims of research
So far it was presented the vital importance of human factors, and in particular those of situation awareness, telepresence and workload, for the development of effective HRI interfaces. This interest is though very new, and as such very little work has been carried out so far to understand and measure them, something that will allow the investigation and answer of important issues, such as, what way these are influenced by the system under investigation, provide proofs of whether these factors really consist important issues that guide decision making and result into high levels of task performance, how these influence each other, and how all these can provide a solid basis that will lead into better interaction interfaces. In particular, situation awareness is the one out of the three with the least amount of previous research work in the area of robotics. This problem faced currently by roboticists seems to be similar to the one faced in the domain of aviation in the late 1980s, quoted in [178]: “By the late 1980s, there was a growing interest in understanding how pilots maintain awareness of the many complex and dynamic events that occur simultaneously in flight, and how this information was used to guide future actions. This increased interest was predominantly due to the vast quantities of sensor information available in the modern cockpit, coupled with the flightcrews ’new’ role as a monitor of aircraft automa-
1.4 Aims of research
8
tion. The term situation awareness was adopted. . . Using this construct as a starting point, the aviation psychology community sought to revisit the classic issues of pilot selection, pilot training and flightdeck interface design.” Adams [1] clearly supports that these lessons learnt from aviation and air traffic control, should be transferred to HRI due to the similarity between the two domains; this being the operational functions in which human operators have to control and interact with remote complex and intelligent systems operating in dynamic environments through their user interfaces. However, until now very little work has been carried out in effective HRI, and the current thesis aims to contribute to this area. More specifically the thesis will investigate and model the human factors of task performance, situation awareness, telepresence and workload, and design and develop a reliable measurement framework for effective human-robot interface design. If and how the lessons learnt from other domains such as human-computer interaction, virtual reality, aviation, etc., can benefit the study in the spectrum of robotics is a further issue that will be explored. The experimental domain chosen is the important area of urban search and rescue. The problem of validating these developed theories and methods in test scenarios and exercises is difficult, expensive and time consuming. It is of vital importance to initially investigate the existing solutions in software, so that realistic USAR scenarios can be developed for testing these theories and methods. A further advantage gained is that these tools can also be used for the training of the end users to the USAR robot systems with great availability as they can be used in frequent basis without any cost and reducing long periods of inactivity. Once sufficiently reliable solutions are available the final testing and validation in real-world environments are possible.
1.5 Objectives of research
1.5
9
Objectives of research
Considering the limited amount of work that has been carried out in this research direction, each one of the aims is original. The aims formulate the following list of objectives: Identify appropriate software tools that can be used for the realisation of the
experimental scenario, this being an urban search and rescue mission with the assistance of a teleoperated robot. Investigate whether the lessons learnt in other domains where human factors
have been studied can benefit the robotics research. Design and develop new methods for measuring the human experimental vari-
ables. Investigate the relations between the experimental variables (performance, sit-
uation awareness, telepresence and workload), and provide a prediction model of performance for them.
1.6
Relevance of the urban search and rescue domain
Urban search and rescue is currently an active and important application domain, where these issues are urgently needed. Because of this it was selected for the current research. The socioeconomic impact from natural and man-made disasters is enormous; according to the OFDA/CRED EM-DAT International Disaster Database [138] 14,122 major disasters have been recorded worldwide during the period of 1970-2006. The total number of people affected by them was nearly 5.4 billions; of which about 2.8 millions died and another 5.5 millions were injured. The total cost of the damage from the disasters was nearly $1.5 billions. Table 1.1 and Table 1.2
1.6 Relevance of the urban search and rescue domain
10
Table 1.1: Total number of natural and technological disasters and people affected from them per continent and worldwide sum for the period between 1970-2006 (Source: “EM-DAT: The OFDA/CRED International Disaster Database”) Continent Africa Americas Asia Europe Oceania Worldwide
No. disasters 2,858 2,988 6,277 1,521 478 14,122
No. dead
No. injured
No. people affected
622,471 197,070 319,757,671 306,745 2,283,979 181,298,178 1,748,292 2,820,727 4,788,866,792 113,790 153,732 31,952,316 6,022 6,658 19,506,483 2,797,320
5,462,166
5,341,381,440
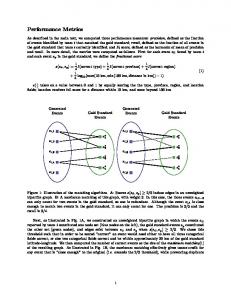
Figure 1.2: Typical search and rescue operating environments show these figures along with breakdowns for each continent. It is clear that despite all the technological advancements in the preparation against any kind of disaster, the effects are still fatal and devastating. It is therefore an important necessity to focus research efforts on search and rescue operations conducted in the aftermath of a disaster. But more than that, rescue teams often have to work in complex and dynamic areas of extremely high risk (Figure 1.2). It is estimated that USA alone loses more than 100 fire fighters every year [189], excluding a very high number of them that retire or die because of developing cancer and other diseases due to the unhealthy working conditions [190]. Latest reports are discouraging as they indicate that
1.6 Relevance of the urban search and rescue domain
11
Table 1.2: Damage costs from natural and technological disasters per continent and worldwide sum for the period between 1970-2006 (Source: “EM-DAT: The OFDA/CRED International Disaster Database”) Continent
Damage cost ($)
Africa Americas Asia Europe Oceania
29,281,103 476,377,579 687,862,747 217,949,618 28,258,349
8,541,632 135,800 267,239 123,456,900 5,490,346 25,770,041 795,000 6,794,000 0 1,171,000
1,439,729,396
15,094,217 157,327,741
Worldwide
Reconstruction cost ($)
Insurance cost ($)
the number of fatalities remains pretty much unchanged [187; 188]. Past tragedies include the rescue operations in the World Trade Centre in New York in 2001, in which 344 firefighters lost their lives [186]; the Mexico City earthquake where more than 135 untrained rescuers died, half of them while searching confined spaces that suddenly flooded, resulting in an average of 2.2 dead rescuers for every victim retrieved alive [5; 27]; the Humberto Vidal Building Explosion in 1996, where after a week’s non-stop effort the building was deemed too unstable to continue rescue operations, even if the search dogs indicated possible casualties2 . Moreover, extreme fatigue due to round-the-clock operations and high psychological pressure, makes clear the role that technologies could play in the rescue operations. The risky and dynamic operational environments guarantee that these technologies will be tested to their limits, and in conditions and scenarios similar to most of the robot teleoperation tasks. The use of a search and rescue robot seems to be multiple, with each one of the various specialised teams of a USAR task force (Figure 1.3) needing their own set of data. For example, images, maps and locations of trapped survivors would greatly help the search and the rescue teams; gas sensors and hazardous materials could be 2
http://www.fema.gov/usr/about5.shtm
1.6 Relevance of the urban search and rescue domain
Safety Officer (2)
Search Team Manager (2)
Task Force Leader Asst. Task Force Leader
Rescue Team HAZMAT Team Medical Team Manager (2) Manager (2) Manager (2)
Canine Search Rescue Squads Spec (4) 4 offic., 20 pers Tech Search Spec (2)
12
HAZMAT Spec (8)
Medical Spec (8)
Heavy Equip. RiggingSpec(2)
Log. Team Manager (2)
Planning Team Manager (2)
Logistics Spec (4)
Structural Spec (2)
Comm. (2) Spec
Tech Info Spec (2)
Support Spec
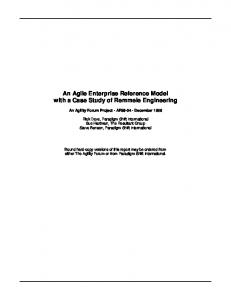
(Upto 10 drivers) (Up to 30 non deployed support
Figure 1.3: US FEMA USAR TF organisational structure (Source: “FEMA USAR Field Operations Guide [185]”). Grey shaded boxes indicate where robots could potentially be used detected and monitored by the HAZMAT team; the planning team would be able to assess the structural integrity of the searched area; the medical team would have a better picture about the condition of the trapped casualties; etc.
1.6.1
Limitations of current systems
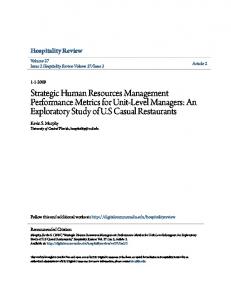
The first time that robots were used in real-world search and rescue operations, was in the disaster at the World Trade Centre (Figure 1.4a), in New York, in 2001 [19; 131]. Various robotic teams from the industry and from academia responded to the call for assistance under the coordination of the Centre for Robot Assisted Search and Rescue (CRASAR) [35]. In the first ten days, the robots assisted in finding the bodies of at least five victims [130], while during the total period of four weeks of the conducted operations, more than ten victims were discovered, which was only ≈ 2% of the total victims found [35]. The analysis of the data that was collected from these operations showed that although robots could be deployed in some USAR missions there was still a long way
1.6 Relevance of the urban search and rescue domain
(a) World Trade Centre
13
(b) Robot fleet in WTC
Figure 1.4: USAR robot operations in the World Trade Centre (Source: “CRASAR”) to go and many research issues need to be resolved before they can be effectively and reliably used. More specifically, Micire [122] showed that the electromechanical designs of the robots were inadequate suffering from several issues such as track slippage, inappropriate sizes, poor reconfigurability and ineffective communications. On the other hand Casper [25]; Casper and Murphy [26] specifically focused on the human-robot interactions, suggesting the necessity of new user friendly interfaces that require minimum training and can assist the operator to better understand each situation, and allow more perceptual sensors to be added, as the robots used had only one video camera. Further field studies [21; 22] have indicated the importance for user-friendly HRI, that support the users in maintaining good levels of situation awareness. The importance and the potential of search and rescue as a research domain is recognised worldwide. Both USA and Japan, two countries that each year suffer from a series of fatal disasters, have initiated organised research into this direction [91; 106; 172; 173]. In one of the latest field tests, the necessity of effective human-robot interaction was once more emphasised as a priority research issue [184].
1.7 Summary
1.7
14
Summary
Effective and user-friendly human-robot interaction are vital for the successful achievement of a task when humans and robot systems have to work together. This is particularly the case in safety critical domains, such as search and rescue, space exploration, military applications, etc., where teleoperation is the dominant element. In these cases the most common method of interaction is through graphical user interfaces. The lessons learnt from the domain of human-computer interaction can greatly benefit the research in human-robot interaction, particularly when the interaction interfaces are computer graphical user interfaces, common in teleoperated robot systems. It was presented in Section 1.3 that the long research history of HCI has produced guidelines for the design and development of interaction interfaces, particularly emphasising the importance of a user-centric design approach, and should be considered by system developers in the area of robotics. However, they should be used with caution. The domain of HRI has some fundamental differences from that of HCI, which were discussed in detail in Section 1.2. In brief these are mainly due to the differences between a computer and a robot, as the latter in contrast to the former is a complex, dynamic, mobile adaptive control system that exhibits autonomy and cognition, operates in unstructured and changing environments, and is capable of harming or even killing a human being. Due to this high complexity of the robot systems and the safety issues involved with them, the priorities in HRI are certainly different from the ones that govern HCI and their resulting guidelines. Most importantly, traditional design techniques seem to fail to produce effective systems. An approach that involves the end user and human factors seems to be an alternative approach, which has produced good results in other critical domains, such as air traffic control and aviation. In particular, the human factors of situation awareness, telepresence and workload have been the main focus of research for decades in these domains. However, little work has been carried out for these
1.7 Summary
15
areas in the domain of robotics, and hence this project aims to investigate human factors and their relations with performance, how they can be measured, and finally how they can be modelled, in order to provide a prediction of performance used for assessing the interaction interfaces. Urban search and rescue is chosen as the application domain as it is of importance currently.
Chapter 2 Software Tools for Robotic R&D Before going any further the important issue of identifying suitable tools for realising experimental setups are necessary. However, the increasing use of design tools to assist system developers has resulted in a vast number of available software packages. The selection of an appropriate one for a particular task has become a difficult and time consuming task. For this reason suitable simulation studies and general guidelines that attempt to set an evaluation framework for the selection of appropriate software tools according to the specific user requirements have been proposed [108]. Case studies have been produced for design issues in various fields such as aerospace engineering [43], mail transfer [61], structural engineering [111], etc., but none really exists for the robotic domain. For this reason an attempt to identify, classify and review several software tools that could be potentially used for the research and development of robotic systems was conducted with the assistance and support of the EC funded Climbing and Walking Robots (CLAWAR) Network of Excellence and the results were provided to the partners for further exploitation [136]. As such, about 150 packages were identified and classified based on their potential use into the following categories: environment modelling, e.g. Crystalspace, Modelmagic3D, OGRE, etc. image processing, e.g. ISaRT, OCVL, Scilab, etc.
2.1 Selection criteria
17
programming libraries, e.g. Aerospace Blockset, MSL, etc. physics libraries, e.g. ODE, Robotic Simulator, Swift++, etc. planners, e.g. Improv, INICEUPP, MACTA, etc. robot control libraries, e.g. CARMEN, MARIE, MCA2, Player, etc. robot dynamics and statics, e.g. RobotFlow/FlowDesigner, Solidworks, visu-
alNastran, Yobotics, etc. system-task simulators (also called robotics suites), e.g. Missionlab, Player-
Stage-Gazebo, RARS, Webots, etc. Some comparison between the various tools is necessary to select the suitable one for a given task. A set of criteria and means of measuring are proposed in the following sections. These are tested with a case study of selecting a suitable tool for an urban search and rescue scenario with a teleoperated robot, which is the focus of this research.
2.1
Selection criteria
The ISO/IEC 9126 standard [90] suggests a hierarchical arrangement with high level characteristics including reliability, usability, efficiency, maintainability and portability of the software. This set though is by no means comprehensive. For example cost is a criterion missing, but included by Banks [13] who among this also proposes input, processing, output, and support as criteria that software tools should be assessed upon. But then again, Nikoukaran et al. [137] suggest the user, the vendor, the model, the input of it, the execution, the animation, the testing, the efficiency and the output of the software as alternatives. From all these it is obvious that a comprehensive set that satisfies all is difficult to formulate. A unified list might be a better approach in which the final selection and weights of the individual
2.1 Selection criteria
18
criteria is determined by the user and the task requirements. As such the following are considered to be expressing the capabilities and power of software tools in a more useful manner: 1. Usability measures how well a design tool meets the users’ requirements. This is an important criterion which is quite difficult to measure, as it is dependent on the large variety of users’ requirements and tasks. 2. The cost of the software tool in terms of user training costs, maintenance costs and expenses for hardware requirements. 3. Expandability measures the likelihood and the time needed for the developers to improve the software, as well as if there are facilities that allow the users to expand it on their own and include their own modules. In other words it measures its “customisation” capabilities. 4. Reusability measures the capability of a software tool to be used both for design and assessment purposes, its compatibility with other software, and its amount of reusable modules. 5. Development time measures how fast new designs can be developed. High reusability, i.e. existence of predefined reusable modules can greatly assist in rapid design and development. Wizards and graphic tools are also contributors. 6. Efficiency measures the performance in terms of compilation and run time speed, as well as other execution facilitation, such as speed control, off-line run, multiple and automatic batch run, reset capability, interaction, start in a non-empty state and debugging tools. 7. Visualisation measures the level of realism the software offers in terms of visual aspects and physical interactions.
2.2 Measurement scales
19
8. Portability measures the capability of a software to be run in multiple development platforms. 9. User friendliness measures the level of easiness to use the software as well as the supportive documentation, such as user manuals, command references, illustrative examples, etc. 10. Technical support measures the level of assistance from an active community of experts through direct communication with its developers or indirectly through help forums, FAQ lists and user groups. 11. Analysis facilitation measures if the software provides any facilitation for analysing and visualising the data such as business graphs and charts, structured output of the data or exportation into a spreadsheet, analysis functions and video capture or screenshots.
2.2
Measurement scales
The next step is to determine some kind of qualitative or quantitative measurement for these. One simple way is to strictly examine if the candidate software tools cover each one of them. The one that includes the most important ones would be preferred. This qualitative approach although it might be easy to apply it does not provide any futher information on the extent that these criteria are covered by the software. For this reason some kind of rating scale is better from a diagnostic and sensitivity point of view. Davis and Williams [36] used a relative evaluation technique, in which all the software tools are compared to each other in a pairwise manner. Although this demonstrated good results, there were cases with surprising rankings. Most importantly though, this technique is impractical for large data sets, as the number P of pairs to be compared for n number of software tools is equal to k=n−1 k. Hence, k=1
2.3 Urban search and rescue requirements
20
an absolute rating technique is more suitable for large numbers. A further necessary step is the use of some weighting procedure to reflect the different levels of importance of each criterion. This can only be achieved in a subjective manner based on the user’s specific requirements.
2.3
Urban search and rescue requirements
A minimal setup for a USAR robot consists of the capability of the robot being teleoperated from a remote control station and it carrying a video camera to provide visual and possibly acoustic data back to the user through tethered or untethered communication [122]. Such a configuration though has proven to provide poor support for the situation awareness of the user [25]. The following modules could provide further assistance: Input modules: laser range finder for improved obstacle awareness beyond the
field of view, thermal camera for thermal signature of the victims, directional microphones for acoustic feedback, etc. Processing modules: internal monitoring for better health awareness of the
system, localisation and mapping for navigation awareness, recovery from communication dropouts for better reliability and robustness Output modules: grippers, drills, suction pipes for clearing passageways
The operational environment in urban search and rescue applications can be characterised as dynamic, hostile and rough (see Figure 2.1). Entry points are often narrow and difficult to reach and the terrain can be extremely uneven, making even the simplest movements difficult without getting stuck. There is always the danger of a further collapse and the light conditions are normally very poor. Even worse, due to the complete disorder of the environment the readings of individual sensors can be noisy and unreliable.
2.3 Urban search and rescue requirements
21
Figure 2.1: Typical search and rescue operating environments However, current locomotion mechanisms have not proven to be reliable and effective in such difficult terrains. As such, it is a common practice for researchers to simplify the environment. Particularly, in the case where locomotion does not consist a research issue, such as is the case here, a simplification of the environment should not have any serious implications. In this research, a software tool that allows the simulation of a robotic platform and of the sensors described above, in a teleoperated search and rescue scenario is required. It should also allow new modules to be added and the control code to be easily re-usable to real robot platforms. It is also important that this tool is cost effective, considering the limited resources, but without compromising its usability. An active community and helpful documentation is also necessary for rapid learning and use of the tool. These requirements guide the importance of the criteria described in Section 2.1. More specifically, the highest priority criteria are usability which reflects the realisation of the experimental scenario, reusability of the code into real robots, expandability to support future expansions of the system, cost due to limited resources and good technical support in the form of clear documentation and of an active community using the software and being able to provide assistance. The weights shown below reflect their level of importance. It has to be noted that although the criteria are generic enough to be reused in other simulator studies, the selection of
2.4 Comparison of the system-task simulators
22
their weights is a subjective decision driven by the requirements of the task and the researchers. Usability, which accounts for 20% of the total score Reusability, which accounts for 15% of the total score Expandability, which accounts for 15% of the total score Cost, which accounts for 20% of the total score Technical support, which accounts for 20% of the total score All the remaining criteria account for 10% of the total score
2.4
Comparison of the system-task simulators
The related category for this is the system-task simulators category which includes about 25 tools, excluding the ones that are domain or system specific. Considering that quite a few of them are either under development or not supported anymore, the list of the tools to be assessed becomes shorter. Moreover, some of them are clearly too simple for such a complex task or allow only 2D simulations (e.g. Flat 2D, RP1 Rossum, Missionlab etc.). As such, in the end, only five (Table 2.1) seem to be appropriate and were further evaluated. The members of the CLAWAR Network of Excellence were asked to provide their expert experience with any of these tools by rating the criteria discussed in Section 2.3 on a rating scale of 1–5, with the lowest value signifying a poor rating. The overall score of each software was a weighted mean from all the criteria. The scores for each simulator are shown in Table 2.1. The open source package of Player-Gazebo1 [71] (Figure 2.2a) seems to be the most appropriate. Gazebo is a full 3D simulator that allows the dynamical laws of 1
http://playerstage.sourceforge.net
2.4 Comparison of the system-task simulators
23
Table 2.1: Assessment of system-task simulator tools. (OS: Overall Score, Us: Usability, Re: Reusability, Ex: Expandability, Co: Cost, Su: Support, Rest: Rest of the criteria) Name
OS
Us Re
Ex
Co
Su
Rest
Player-Gazebo Webots Simulation Studio Easybot Dynamechs
4.2 3.6 3.6 3.1 3.1
4.7 4.5 4.1 3.8 3.3
4.7 4.7 3.1 3.8 3.3
5.0 1.7 4.0 4.0 5.0
3.9 4.1 4.1 2.0 2.6
0.9 1.1 1.0 0.7 0.7
4.7 4.6 3.8 3.4 2.5
(a) Gazebo
(b) Webots
Figure 2.2: Screenshots of the top two rated system-task simulators physics to be included in the simulation and it allows a small number of robots to be simulated simultaneously. Player is a robot interface providing a network interface to a variety of robot and sensor hardware. The server/client architecture allows the control programs to be written in any programming language. These can be used for simulating virtual robots in Gazebo as well as real ones with no or little modification. It is open source and as such it can be extended with new interfaces for any new hardware modules. As far as technical support is concerned there is helpful documentation as well as an active email list. One disadvantage is that the learning time might be longer than it is with other tools, due to lack of any graphical interfaces for the implementation of the controllers.
2.4 Comparison of the system-task simulators
24
Webots2 (Figure 2.2b) is also a powerful simulator with similar characteristics to Player-Gazebo with the only difference that it is a commercial product. Both simulated and real robots can be controlled, and the simulator allows the development of full physics 3D environments. It can also be extended by the user with new modules. It has been assessed as second best due to its high cost, in comparison with Player-Gazebo which is open-source and free of cost. The third best overall and in terms of usability was Simulation Studio3 , which is a 3D interactive simulator that allows the control of simulated and real robots with a BASIC Stamp microcontroller. It can also be extended with new modules provided by the developers. Easybot4 is also a commercial tool which depends on the cost of the used 3D modeller LightVision3D. Unlike Player-Gazebo and Webots, Easybot does not allow the control of real robots. Another drawback is the lack of a physics engine, something that has serious impacts on the realism of the teleoperation. Moreover, it is no longer supported, as the developers focus their efforts into a new product, called JRoboSim, which aims to eliminate these drawbacks. Dynamechs5 and its graphical front end RobotBuilder is also a good 3D simulator in which both the environment and a robot system can be modelled. However, like Player-Gazebo, this also suffers from a longer learning time than the ones with graphical facilitation. A further drawback is that it can only be used as a simulator without allowing control programs to be developed for real robot platforms. Most importantly though it is that Dynamechs seems inferior to all the other packages in terms of features and graphics quality. 2
http://www.cyberbotics.com/products/webots http://eyewyre.com/studio 4 http://iwaps1.informatik.htw-dresden.de 5 http://sourceforge.net/projects/dynamechs 3
2.5 Limitations
25
(a) USARsim
(b) Microsoft Robotics Studio
Figure 2.3: Screenshots of recent developments of system-task simulators
2.5
Limitations
The only limitation is that while this simulators comparison study was conducted new tools were under development and now that they have matured should also be included in a future update. In particular, in the system-task simulators two new tools are worth mentioning, USARsim6 [195] and Microsoft Robotics Studio7 . USARsim (Figure 2.3a) is based on the Unreal Tournament game engine and has started to be used in the recent RoboCup Rescue competitions. It is possible to use Player, something that means that the control programs can be reused in real robots. Microsoft Robotics Studio (Figure 2.3b) has been developed in the Microsoft research labs and has been adopted by robotics companies. It also has the capability of running the control programs in simulated systems as well as real ones. Both of them are 3D simulators and in fact the graphics seem to be superior to that of either Gazebo or Webots, something that adds into the realism of the task. A further common strength is that they are both nearly free of cost, with USARsim only requiring a cheap license to be purchased for the Unreal Tournament game engine. 6 7
http://usarsim.sourceforge.net http://msdn2.microsoft.com/en-gb/robotics/default.aspx
2.6 Post-evaluation of Player-Gazebo
2.6
26
Post-evaluation of Player-Gazebo
Player-Gazebo was used throughout this research study to simulate an urban search and rescue scenario with a teleoperated robot. It has proved to be an excellent choice fullfiling all the requirements. However, after extensive experience with it a couple of negative remarks can be made. First and foremost, Gazebo is very much resource thirsty. 3D Studio Max skins can be used on the objects to make them look realistic, however, this is only possible in high performance graphics cards. Although the subjects/users commented that Gazebo is realistic enough, its graphics compared to the most recent tools, such as USARsim and Microsoft Robotics Studio, seem like what arcade games of the 90’s are to today’s. On the other hand, it has to be noted that the development of environments and worlds in Gazebo was quite rapid and easy. And moreover, if a human user was not involved, then the visual aspects would not matter as much, considering that in all the other aspects, such as object interaction and physics simulation, Gazebo performs very well.
2.7
Summary
For the experimental setup of this research, i.e. an urban search and rescue scenario with a teleoperated robot, an appropriate software tool was needed. However, identifying a suitable software is not a trivial task, considering the large number of available packages that exist and the lack of any prior simulation studies. An extensive investigation was conducted with the support from the CLAWAR Network of Excellence, in which more than 150 software tools were identified that can be used in some way in the research and development of robotic systems. For this particular scenario only five of them seemed to have the most potential, and were further assessed based on a weighted set of selection criteria proposed for this reason. Player-Gazebo achieved the highest scores due to its high usability, reusable modules, free cost, active development and excellent technical support
2.7 Summary
27
through the well written documentation and large community of users. Post-analysis verified it as the best choice, with the only drawback being that it is quite hardware demanding. In the next chapter the various theoretical models and measurement methods for each of the human factors of task performance, situation awareness, telepresence and workload are discussed. The little work that has been carried out in robotics is also analysed. This discussion is important as it helps to realise what knowledge can be cross-transferred into the domain of robotics, what is domain specific and what are the gaps to be filled in. This leads into the discussion of the proposed and developed measurement methods used in this study. The experimental setup is also presented.
Chapter 3 Theory and Measurement This chapter presents the various theories and models that have been proposed to explain from a theoretical perspective the human factors of situation awareness, telepresence and workload. This will help in gaining a deeper understanding of them and their potential effects not only to performance but also to each other. Moreover, various methods that have been developed to measure them are reviewed and analysed to identify their strengths and weaknesses, and most importantly whether they are suitable to be applied in this study. The methods finally used and how these were developed are presented for each variable. The experimental tools, setup, procedures and subjects are presented at the end of the chapter.
3.1
Situation awareness
In a simple manner situation awareness (SA) expresses the knowledge that a person has on what is going on around him/her. However, this does not provide any insights on what knowledge is necessary to achieve situation awareness or what the underlying processes might be. A lot of theoretical researchers have tried to give more descriptive definitions. Comprehensive lists have been compiled mainly targeted in the domains of air traffic control and aviation [39; 178], as in these two situation awareness has a long research history. Some of these definitions are also
3.1 Situation awareness
29
interesting from the HRI point of view.
3.1.1
Definitions
One of the most cited definitions of situation awareness is that given by Endsley [44, 51]: Situation awareness is “the perception of elements in the environment within a volume of time and space, the comprehension of their meaning and the projection of their status in the near future.” This definition implies that situation awareness consists of three dimensions, those of perception of data, comprehension into meaningful information and projection of future possible states. It is popular firstly because it is general applicable in many domains, but it also provides a way of measurement based on these three dimensions, i.e. amount of data perceived, how well these are comprehended and how accurate the future predictions are. On the other hand, Uhlarik and Comerford [181] criticise this definition as being incomplete, because situation awareness seems to be “static and finite”, since it does not take into account any previous knowledge or experience of the subject; i.e. situation awareness is presented only as some kind of information processing model. To fill in these gaps, Dominguez [39] defines situation awareness as: Situation awareness is “the continuous extraction of environmental information, integration of this information with previous knowledge to form a coherent mental picture, and the use of that picture in directing further perception and anticipating future events.” In this respect situation awareness seems to be based on “the integration of knowledge resulting from recurrent situation assessments”, as Sarter and Woods [151] note. In other words these two definitions emphasise the close relation of situation awareness with the quantity and quality of information, and how this is
3.1 Situation awareness
30
interpreted to better understand the roles, the intentions and the actions of all the entities and elements involved in the task execution, leading to optimal decisions. This is a natural, built-in behaviour of all intelligent organisms, or as Flach [56] better puts it, situation awareness is used as “an appropriately descriptive label for a real and important behavioural phenomenon”.
Situation awareness: a product or a process? There seems to be a distinction in seeing situation awareness as an end product, or as a process, i.e., considering how the information is acquired and the resources available for processing into decision making and actions [178]. Adams et al. [3] note that “product refers to the state of awareness with respect to information and knowledge, whereas process refers to the various perceptual and cognitive activities involved in constructing, updating, and revising the state of awareness”. Assessment methods of situation awareness seem to consider it as a product, as they directly measure the amount and quality of the knowledge and the information that a subject has. Indirectly though, they also seem to measure the associated processes. For example, the user interface consists one of the processes in teleoperated robots, as although it might not exist in the brain of the user, it is a vital part of the perception and updating his/her current state of awareness. By measuring to what extent an interaction interface supports these elements, this allows a system designer to improve these interfaces, and hence the processes. For accurately designing assessment methods that are reliably measuring situation awareness both as an end product and as a process, a deeper understanding on its theories and models is necessary.
3.1.2
Theories and models
A model of situation awareness proposed by Endsley [48, 51] is directly derived from her definition on situation awareness (Section 3.1.1), and as such it is based on the
3.1 Situation awareness
31
Situation Awarenesst Environment
Perception of elements in current situation Level 1
Comprehension of current situation Level 2
Projection of future status
Decision & Performance
Level 3
Figure 3.1: Endsley [48]’s proposed model of situation awareness same three levels, namely: 1. perception of elements in the environment within a volume of time and space; 2. comprehension of their meaning; 3. projection of their status in the near future. The underlying assumptions of this model are that the information regarding the relevant elements in the environment, which are perceived through the interaction interfaces, form the basis of the user’s situation awareness. Action selection and performance are subsequent separate steps [48]. At any instance of time it is a sequence of perception, comprehension and projection without any influence from any previous instances (Figure 3.1). Because of this independence though, Uhlarik and Comerford [181] criticise this model of being “static and finite”, as previous experiences and knowledge should play an important role. For example, suppose that a user is exposed twice in exactly identical conditions, then according to Endsley’s model his/her situation awareness should always be the same. This is firstly hard to believe as the previous exposure to these conditions and the outcome of the previous actions should affect the current decision in favour of pursuing the same outcomes or alternatives. Another important point is that the separation of situation awareness from decision-making and performance allows their study and measurement in a clear and well-defined manner. However, such a separation does not imply that these variables are not related to each other, and in fact there is no clear consensus on
3.1 Situation awareness
32
this. There is a general feeling that improved situation awareness will lead to better performance; or the other way around, good performance consists an indicator of good situation awareness [42; 48; 101; 152]. But things are more complicated, as Flach [56] notes: “The danger comes when researchers slip into thinking of situation awareness as an objective cause of anything. A statement that situation awareness or loss of situation awareness is the leading cause of human error in military aviation mishaps might be criticised as circular reasoning: How does one know that situation awareness was lost? Because the human responded inappropriately? Why did the human respond inappropriately? Because situation awareness was lost. Is this keen insight or muddled thinking? ” This statement reveals two issues. The obvious one is the “chicken and egg” relation between situation awareness and performance. The least obvious one is that of the danger when situation awareness is considered to be the objective cause of anything. There might be cases that one does not cause the other. A poor performance might be a result of an unavoidable situation beyond the capabilities of the operator or of the system, even if the level of situation awareness had been high. On the other hand, a good performance might be a result of good motor skills (e.g. quick reflexes), independent of any level of situation awareness. Another popular model, that more clearly relates situation awareness to performance, was proposed by Adams et al. [3]. It considers situation awareness to be both a product and a process, and it is based upon the perceptual cycle or perceptionaction cycle model proposed by Neisser [134]. It mainly consists of three elements: 1. the object, which is a set of all available information; 2. the schema or mental model, which is the knowledge that the subject has about the world; 3. the exploration, which is a directional mechanism which leads the subject on certain information of interest from the environment.
3.1 Situation awareness
33
Actual world (potentially available information) Modifies
Samples
Samples
Directs
Loco m and a otion ction
Modifies
Per EXPL ceptual ORA TION
SCH E of pre MA envir sent onme nt
Cogn of the itive map w its po orld and ssibil ities
OBJECT Actual present environment (available information)
Directs
Figure 3.2: Adams et al. [3]’s extended version of Neisser [134]’s perception-action cycle model on situation awareness These three occur in parallel and continuously, forming the fixed points of a loop, as shown by the inner cycle in Figure 3.2. The active schemata, also called mental models, represent situation awareness as a product, directing the situation awareness processes, i.e. directing the subject in exploring, by selectively sampling information of interest from the set of all available information. As new information is received, the current schemata are modified or replaced by new ones to reflect the new conditions. Previous knowledge and experience is encapsulated in the cognitive map and its possibilities that the subject holds, this being shown by the outer loop in Figure 3.2. Together with the active schemata, they direct the subject into actions that lead into perceptual exploration and closer to fullfiling his/her high priority goals. In fact, Adams et al. [2, 3] believe that this prioritisation of goals, according to the situation and the workload, is a key dimension of situation awareness. They note that this is not a simply first-in/first-out process, but as the situations change dynamically, the prioritisation of goals is based on the current requirements, as well as on the overall management of the situation.
3.1 Situation awareness
34
Environment available information (object) Modifies Knowledge (schema)
Samples Invariant
Action (exploration)
Directs
Figure 3.3: Neisser [134]’s perception-action cycle model as proposed by Smith and Hannock [167] for situation awareness In fact, Smith and Hannock [167] share this view, and even go a step further believing that the goals and their prioritisation reside on the environment and on the situation rather than on the agent. According to them, situation awareness is “adaptive, externally directed consciousness”, driving the agent to certain behaviours that seem appropriate to the current situation. By consciousness it is meant “that part of an agents knowledge-generating behaviour that is within the scope of intentional manipulation.” It is adaptive to describe the agent’s ability to follow the goals set by the environment. In the absence of a goal, the decision-making process is guided by the agent’s introspection. As shown in Figure 3.3, situation awareness appears to be a process that given a certain knowledge (schema) of the environment (object) guides the agent to competent actions that lead into investigating further relevant information (exploration). The invariant element represents the agent’s adaptiveness to new goals set by the environment. As Smith and Hannock [167] explain, invariant is that element that “codifies the information that the environment may make available, the knowledge the agent requires to assess the information, and the action the knowledge will direct the agent to take to achieve his goals.” Flach [56] also thinks that situation awareness is an internal mechanism that guides decision-making. He considers it to be a behavioural phenomenon having a form only in the mind of the researcher, i.e. the subject is simply responding to one of
3.1 Situation awareness
35
Situation Awareness Goals, experience, etc.
Triggered Stimulus
Environment and other sources of information
Response
Figure 3.4: Flach [56]’s model of situation awareness as a behavioural phenomenon his/her stimulus, which is triggered by the information perceived and comprehended in conjunction with the current goals of the task. This is schematically shown in Figure 3.4. This model is very similar to the perception-action cycle, with the triggered stimulus playing the role of an active schema. One main criticism of the perception-action cycle models, according to Uhlarik and Comerford [181], is that it is not exactly clear how to measure situation awareness, whether it is treated as a product in the form of an active schema, or as a process in the form of a state of the cycle. This criticism seems true as these models are abstract and include a number of cognitive constructs and aspects (like mental models, memory, experience, etc.) that are not well understood or are difficult to define. However, such cognitive constructs commonly appear in all the models. For example, Endsley [48] acknowledges the existence of mental models as complex, abstract and dynamic schemata, pre-existing in the mind of the user, that guide the perception-comprehension-prediction levels in her proposed model. In fact, Flach et al. [55] state that the mapping between the different levels of abstraction with the specific situation is what is meant by good situation awareness, and suggest that “in designing systems within the goal of good situation awareness, it is the designers’ work to make the mapping across level of abstraction visible to the operators.”
3.1 Situation awareness
3.1.3
36
Measurement methods
The amount and quality of the knowledge and of the information about the environment and all its associated elements, as well as the processes, actions and means of acquiring them, are the key characteristics of all the models. As such, assessment methods of situation awareness aim to measure them. It is commonly agreed [60; 93; 152; 181; 193], even if different descriptive labels are used in some cases, that all measurement methods fall under the following categories: Explicit methods directly measure situation awareness. Depending on when
they are applied, they are futher broken down into: – Retrospective methods, which are applied in the end of the task. – Concurrent methods, which are used during the execution of the task. – Methods utilising the freeze technique. These are similar to the concurrent methods, i.e. they are used during the execution of the task, with the only difference that the task is paused when the method is applied. Implicit methods indirectly measure situation awareness through an interme-
diate variable, e.g. by measuring performance, the level of situation awareness can be inferred assuming that there is a well known relation between them. Because performance is actually the most common variable used for this purpose, these methods are also often called performance-based methods. They are further decomposed into: – Global methods, which measure the global scope of the variable (e.g. overall performance) in order to infer the quality of situation awareness. – External task methods, which alter something in the existing conditions of the situation and observe the reaction of the subject to this change.
3.1 Situation awareness
37
– Embedded task methods, which use self-ratings or the ratings of an external observer, who is usually a domain expert. Subjective methods measure situation awareness either from the subjects’ self-
ratings or ratings from an external observer, who is usually a domain expert. So depending on who is the rater, they are also further broken down into: – Direct self-ratings, in which the subjects rate their own situation awareness. – Comparative self-ratings. – Observer ratings, in which an external, usually expert, observer rates the quality of the subject’s situation awareness. Except from a very few exceptions, all assessment methods have primarily been developed and tested in the area of air traffic control and military avionics. For this reason, nearly all of them are tied into these domains. However, the strengths and weaknesses of their categories and the general techniques that they use can provide assistance in developing new ones for the domain of robotics. Explicit methods Explicit measurement methods (Table 3.1) directly measure situation awareness by assessing the elements and the features that exist in the mental model of the subject. Firstly, the subject is required to answer certain queries that reveal the quality of the mental model. The correctness of his/her answers is checked with the true states, providing a measurement of the level of his/her situation awareness. These methods are usually applied concurrently with the task (SAVANT [202], SAPS [37]), or retrospectively in the end (SAPS [37] again). The problem with the retrospective methods is that they suffer from memory decay, which means that the subject is able to recall only the very last few minutes of the task, according to Endsley [47]. Fracker [60] though argues that the memory
3.1 Situation awareness
38
Table 3.1: Explicit measurement methods of situation awareness Abbrev
Name
Timing
Ref
QUASA
Quantitative Analysis of SA
concurrent, freeze
[116]
SAGAT
SA Global Assessment Technique
freeze
[45]
SALSA
Measuring SA of Area Controllers within the Context of Automation
freeze
[75]
SAVANT
SA Verification Analysis Tool
concurrent
[202]
SAPS
SA Probes
concurrent, retrospective
[37]
decay issue is also shared by the concurrent methods. On the other hand, a clear advantage of the retrospective methods over the concurrent ones is that they are much less obtrusive, which makes them better suited for real world scenarios as well. In order to eliminate this distraction of the concurrent methods, Endsley [45] proposed the “freeze technique”, in which the measurement method is still applied concurrently but the task is halted while it is done so. Endsley used the freeze technique in a method she developed to measure the situation awareness of air traffic controllers, named the Situation Awareness Global Assessment Technique (SAGAT). This method is one of the most popular methods in the ATC area, and has also formed the basis of many other developed methods (such as QUASA [116] and SALSA [75]). It is also the only assessment method that has been applied in the area of robotics [145; 146; 158]. The procedure of SAGAT is as follows. The subject is executing the task as normal. At some random point of time the task is halted, and all the availables sources of information are hidden from him/her and he/she is then requested to go through a “SAGAT stop” session, in which he/she is asked some questions, related to the current pursuit goals and revealing “bits and pieces” from his/her mental model, i.e. his/her situation awareness. The set of questions
3.1 Situation awareness
39
asked at each stop are random, so that the subject is not prepared specifically for them, which otherwise would bias the measurements. Explicit methods are considered methods of high validity, because they directly assess the knowledge that the subject has about the situation, and they are objective as they compare this knowledge with the true state of the world, without being based on self-ratings or external judgements [47]. On the other hand, Fracker [60] argues that as long as the subject self-reports his/her situation awareness, the methods are subjective. Such a criticism seems to be weak, as carefully selected queries could provide answers that would be the same whether they were retrieved from the subject or in some other way without his/her interference. Pritchett et al. [141] and Uhlarik and Comerford [181] criticise explicit methods that even if situation awareness is directly measured, this does not provide any clues on how the subject will perform, quoting once more that there is no clear consensus on what is the relation between these two, whether they are standalone variables or one is incorporated within the other. Moreover, Sarter and Woods [152] think that such queries can bias the subject in seeking specific information and following certain patterns of actions, however, some methods (e.g. SAGAT) take care of this, by randomly selecting the queries to be asked and avoiding repetition. All these strengths and weaknesses are summarised in Table 3.2.
Implicit methods Implicit measurement methods (Table 3.3) indirectly measure situation awareness, by inferring it through the measurement of another variable, which is associated with it. The most common ones are task performance (used in GIM [20], SABARS [133] and SALIANT [129]) and response time of the subject when there is a forced sudden change in the situation (used in SASHA-L [93] and SPAM [42]). When performance is used, it is usually considered to be the overall task performance, and less specific elements of it. It is measured by asking the subjects to
3.1 Situation awareness
40
Table 3.2: Pros and cons of explicit measurement methods of situation awareness Pros (+) More direct methods. Objective
measurement of SA through knowledge assessment.
High validity. Non-obtrusive
when used retrospectively.
Cons (−) Their validity is questioned as it is not clear
how situation knowledge is used and for how long it remains in the temporal/working memory. Obtrusive when used concurrently. Suffer from memory decay when used retro-
spectively. Increase workload when used concurrently.
Do not suffer from
Concurrent methods (with or without the
memory decay when used concurrently or when utilising the freeze technique.
freeze technique) usually cannot be used in real world scenarios. Direct and bias the sampling of information
and actions of the subject.
self-rate themselves, or by asking external expert observers to assess the subject’s performance. Pre-defined performance guidelines are usually used to guide these ratings for a more objective way [20; 129; 133]. Uhlarik and Comerford [181] think that implicit methods are easy to use, because performance itself is easier to define and measure. Pritchett et al. [141] consider these methods to be more objective than the explicit ones, as the measurement of performance itself is considered to be an objective criterion. They also support the view that implicit methods can identify constraints on a user due to training, experience and standard procedures. Moreover, because performance can usually be measured independently of the task, implicit methods have typically low obtrusiveness and are ideal for real world scenarios [92; 141].
3.1 Situation awareness
41
Table 3.3: Implicit measurement methods of situation awareness
Abbrev
Name
Timing
Ref
GIM
Global Implicit Technique
global embedded task
[20]
SABARS
SA Behaviourally Anchored Rating Scales
global, embedded task
[133]
SALIANT
SA Linked Indicators Adapted to Novel Tasks
global embedded task
[129]
SASHA-L
SA for SHAPE (on-line)
global, external
[93]
SPAM
Situation Present Assessment Method
global, external
[42]
The major criticism of implicit methods is that good or poor performance may be a result of more factors than just high or low situation awareness [92; 181]. In other words as long as the relation between performance and situation awareness is not well understood then the results from these methods are questionable. Endsley [46] considers them obtrusive, when performance or response time has to be measured in forcing the situation to change, or when having to “on-line query” the subject. Furthermore, Endsley [46] notes that by measuring the performance of the subject under a specific situation, the situation awareness of the subject is inferred for these specific conditions, and as such it is not safe to make any generalised assumptions. Counter to that, Pritchett et al. [141] note that although implicit measurement methods may not provide a pure measurement of a subject’s knowledge, they are able to illustrate the relationship between the subject’s knowledge and the manner in which it is being used. Implicit methods have the advantage of being easy to use. However, they have been questioned because they are based on the understanding of the relations between situation awareness and the variables measured from which it is inferred. As
3.1 Situation awareness
42
Table 3.4: Pros and cons of implicit measurement methods of situation awareness Pros (+) Objective measurement of SA
through performance assessment. Easy to use and analyse. Typically non-obtrusive; can be
used in real world scenarios. Can identify constraints and lim-
Cons (−) Questionable validity. Can sometimes be obtrusive. Need careful design. Fail to generalise on subject’s SA
when investigating a particular dimension of it.
itations of a subject due to training, experience and procedures.
a result of this, they have not been very popular outside the domains of air traffic control and military avionics, as researchers approach them with caution. Their strengths and weakness are summarised in Table 3.4.
Subjective methods Most of the subjective measurement methods (Table 3.5) use self-ratings from the subjects [38; 93; 113; 114; 117; 174; 176; 194], and rarely in some cases ratings from expert observers [38]. They are based on the assumption that the subject knows better what he/she does or does not know [100]. In the case where an expert is rating the subject, the expert is guided by specific expected behaviours, which are associated with certain levels of situation awareness, a way similar to the pre-defined criteria used in the implicit methods. One of the most popular methods is SART, which has been developed by Taylor [174] to measure the situation awareness of an aircrew in a commercial airplane. It is a multi-dimensional method, and is used retrospectively after the end of task
3.1 Situation awareness
43
Table 3.5: Subjective measurement methods of situation awareness Abbrev
Name
Timing
Ref
CARS
Crew Awareness Rating Scale
self-rating
[117]
CC-SART
Cognitive Compatibility SA Rating Technique
self-rating
[176]
C-SAS
Cranfield SA Scale
self-rating, observer
[38]
MARS
Mission Awareness Rating Scale
self-rating
[114]
PSAQ
Participant SA Questionnaire
self-rating
[113]
SA-SWORD SA Subjective Workload Dominance self-rating, comTechnique parative
[194]
SART
SA Rating Technique
self-rating
[174]
SASHA-Q
SA for SHAPE (questionnaire)
self-rating
[93]
execution. The dimensions provide a “guideline” for the design and grouping of certain queries that aim to assess the situation awareness of the subject. However, the queries and the dimensions are tightly grounded into the flight content domain, which makes this method impossible to use in other domains. However, the multidimensional approach is something that could be taken into account. Another subjective method which was also used to assess the situation awareness levels of a flight crew is CARS, which was developed by McGuinness [117]. It is a multi-dimensional method based on the dimensions of situation awareness proposed by Endsley [44]. Unlike SAGAT though, CARS is a much easier, quicker, and general method that can be transferred into other application domains. The simplest measurement method of situation awareness was proposed by Matthews et al. [113], and it merely consists of one query: “Please rate on a scale the level and quality of situation awareness you had during the task.” Such a simple method though is not very helpful, as it does not give any insights about the underlying factors. Pew [140] criticises that such a question does not actually measure the situation awareness of the subject, but it rather is a self-report of the subject’s
3.1 Situation awareness
44
self-confidence. As such, subjective methods are usually multi-dimensional, requiring the subject or an external expert observer to report on a series of questions reflecting the quality of their mental model [175]. The fundamental assumption of subjective methods, i.e. that the subjects knows best, has been their main criticism claiming that the subject is actually unaware of the true state of the situation which leads into inaccurate self-estimations of his/her situation awareness [47; 92; 140]. A further criticism is that their subjective nature, due to several factors such as ignorance, abilities, performance, or even personal views of what situation awareness is, can influence the integrity of the experimental results. Bell and Lyon [16] note that even external observers can be biased from the subject’s performance or familiarity with him/her. Sarter and Woods [152] also criticise subjective methods, because according to them these methods only treat situation awareness as a product neglecting the processes involved in constructing and maintaining it. Despite these drawbacks subjective methods are very popular, because of their high validity and easy deployment. As a last word of warning, some researchers [100; 175; 181] suggest that the numeric scales, which they commonly use, should be carefully designed to ensure their validity and sensitivity. Table 3.6 summarises their pros and cons.
3.1.4
Situation awareness and human-robot interaction
The investigation of the effects of situation awareness in performance from a humanrobot interaction perspective has been identified as one of main research issues for the effective use of teleoperated robots [19; 23; 121]. Some studies have focused in isolating a particular dimension of situation awareness by examining the effects of a particular sensor on it. For example, Hughes and Lewis [84, 85]; Yanco and Drury [208] have studied the effects of camera use, or Reichard [142]; Reichard and Crow [143] have investigated health awareness in terms of power requirements. Scholtz
3.1 Situation awareness
45
Table 3.6: Pros and cons of subjective measurement methods of situation awareness Pros (+) Easy to use. Easy to transfer into other appli-
cation domains. Low obtrusiveness and can be
used in real world scenarios. Provide an insight to the sub-
ject’s SA. Provide a multi-dimensional as-
pect of SA.
Cons (−) Subjective to the rater (self or ex-
ternal). Can be biased from other factors
such as ignorance, abilities, performance and familiarity. It may be that they reflect confi-
dence levels of SA than SA itself, i.e. their validity is questionable. Suffer from memory decay when
used retrospectively.
et al. [155, 157]; Yanco et al. [209] have studied the effects of the HRI graphical teleoperation interfaces at two major robot USAR competitions, by analysing data collected from videotapes, scoring sheets and personal interviews. Some useful recommendations were drawn from these studies, such as the need for fusion of the information, presentation of them when necessary, need for assistive localisation and mapping, and distinct indicators of the status of the robot and its modules. However, Scholtz et al. [155] note that the limitation of these studies is that the subjects under investigation are the robot system designers, and hence, their performance is biased by the detailed knowledge they have of their systems. Moreover, these studies are completely unaware of any of the theories and models of situation awareness, which would better support how performance and situation awareness are related to each other. Johnson et al. [98] compare two HRI-GUIs by interpreting the task performance scores and relating them to situation awareness, in a way similar to the implicit measurement methods. The video analysis from the USAR robot
3.1 Situation awareness
46
operations in the World Trade Centre by Casper [25]; Casper and Murphy [26]; Micire [122] have identified the need for systems that support the user in acquiring and maintaining high levels of situation awareness, but without suggestions how this can be achieved and assessed. Similar results and little practical suggestions have also been found in further field studies [21; 22]. On the other hand, explicit measurement methods allow the study of situation awareness in isolation and in a more objective and direct manner, without making assumptions on how performance and situation awareness are related to each other, as this is something that can derived by investigating the individual measurements of the two variables. Scholtz et al. [158] have measured the situation awareness of a human supervising an on-road vehicle through a two dimensional map display interface. For that Endsley [45]’s SAGAT method was employed. The situation awareness scores, along with measurements of the workload that the subjects experienced, were used to assess the HRI interfaces. However, their work does not take into account earlier and more extensive work on the same directions by Kaber et al. [102]; Riley [145]. Their approach is a bit different, as the main variable of interest is telepresence, and its relation with all the other is the central focus of the study domain was robot de-mining. This study is probably the most complete so far. However, it suffers from the limitation that performance is partially measured (see also Section 1.3), which has an effect on the quality and accuracy of the performance measurements.
3.1.5
Dimensions of situation awareness
The first step in developing a measurement of situation awareness is to identify the related dimensions of it, based on the user and task requirements. In the case of the USAR scenario here, the dimensions should be reflecting the mission goals, i.e. searching an area in the shortest amount of time, protecting the robot from hazards and bringing it safely back within the operational time of the batteries. For these
3.1 Situation awareness
47
goals to be effectively pursued the user should have situation awareness over the following high level dimensions: Mission awareness: This dimension includes the items that measure the level of awareness that the user has about the mission goals and how well these are being achieved. To identify individual items able to measure this dimension what is needed to fulfil the mission goals has to be identified. So the mission goal of searching the area in the most efficient way for any existing casualties implies that the user should be able to keep track of how much and which area has been covered so far, being able to keep track of the locations and conditions of any found casualties, being able to easily process the data as they come along, feel confident when and for what reason he/she has to change the course of action, and in general have a good understanding of what is going on. An equally important mission goal is to protect the robot, which implies that the user should be able to identify and assess the danger of any potential obstacle or hazard, as well as know if the time or the battery level is sufficient to drive the robot safely back. Spatial awareness: This dimension includes the items that measure the level of awareness that the user has about the robot and the surrounding objects in space. This first and foremost includes knowing the current position and orientation of the robot and where it has been, as well as the position of critical elements, such as the location of the casualties, the positions of threatening obstacles and hazards and the location of the exit points. Time awareness: This dimension includes the items that measure the level of awareness that the user has about time aspects and it mainly involves the elapsed and the remaining times to battery depletion, the time needed to cover the required task, as well as the time needed to reach an exit point.
3.1 Situation awareness
48
These three dimensions (mission, spatial and time awareness) are the main ones. There is a secondary axis of dimensions consisting of the three levels of situation awareness as proposed by Endsley [51]. Despite their criticism (Section 3.1.2), they do provide a consistent manner of measuring the situation awareness of the user. They are also valuable, because although the main set of forementioned dimensions offers insights on the individual parts of situation awareness (Figure 3.1, pp 31) this set investigates the different stages in the user’s mind of forming a situation awareness picture. These dimensions namely are: Level 1 – Perception: This dimension expresses how well the user is able to perceive the data from the HRI displays. The items investigate the correctness of the basic data perception that the user has, e.g. how much time has elapsed, what is the current battery level, if there are any obstacles or hazards and where they are, how many victims have been found, etc. Level 2 – Comprehension: This dimension expresses how well the user is able to comprehend the perceived data into useful information and form an accurate mental picture of the current situation. The items investigate the correctness of this comprehension in terms of more complicated queries that require the user to combing basic data into meaningful information, e.g. which is the trajectory that has been followed so far, how much area has been covered, what is the distance of the robot from the exit, if the remaining time is sufficient to reach it, etc. Level 3 – Prediction: This dimension expresses how well the user is able to make predictions on how the outcome of his/her actions and things are likely to evolve. The items investigate the outcome of the actions taken, e.g. how much area can be search at this rate withing the remaining time, whether the time is sufficient to drive the robot back, etc.
3.1 Situation awareness
3.1.6
49
Proposed methods for measuring situation awareness
So far the various types of measurement methods for situation awareness have been presented along with their strengths and weaknesses. Implicit methods though are inappropriate in this study, considering the fact that there is no clear consensus and lack of any experimental results that would indicate what the relation between situation awareness and performance is. Because the relation between performance and situation awareness is examined in this research (Section 4.2), it does not make sense to use a method that is completely based on this. On the other hand both explicit and subjective methods can measure situation awareness as a standalone variable. This allows, the correlation of these measurements with the measurements of the other experimental variables, such as performance, and the draw of conclusions from them. However, the majority of the methods mentioned in Section 3.1.3, with the exception of CARS, is tightly tied to the domain they have been developed for and as such inapplicable in any other. However, the general methodologies of the different categories and the measurement procedures of some methods are elements that can be transferred into the area of robotics and assist to develop new measurement methods, that address the specific requirements of this domain. In particular, SAGAT and its variations (QUASA) are good examples on how to develop an explicit method.
ASAGAT: Analogue Situation Awareness Global Assessment Technique The Situation Awareness Global Assessment Technique (SAGAT) [45] is an explicit measurement method utilising the freeze technique (Section 3.1.3), meaning that while the subject is executing the experimental task, the task is paused at random intervals, and the subject is required to answer a set of random questions regarding the current situation. The level of situation awareness of the subject is then measured based on the “level of correctness” of the results. In its original form [45] the SAGAT answers are measured as strictly right or wrong, something that has
3.1 Situation awareness
50
been criticised for because this negatively effects its sensitivity. For this reason, in this experimental study the scores of items that do not have a strict right or wrong answer are measured on a scale of 0–1, with 0 being completely wrong and 1 being absolutely right. For example, when the subject is asked to record his/her current position, the size of the error deviation from the true position gives more definition than a simple right or wrong answer. To address this modification and separate it from its original form, this method is called Analogue Situation Awareness Global Assessment Technique. Other than this ASAGAT is similar to SAGAT in other respects, and as such anything that applies to the latter is also true for the first. ASAGAT (like SAGAT) is an explicit measurement method that can be applied concurrently using the freeze technique. As a result of this it inherits all the strengths and weaknesses of SAGAT (Section 3.1.3). In particular, it was selected because of its objectivity and that because it does not suffer from memory decay issues. Endsley [49] also claims that SAGAT provides a measurement of the overall situation awareness. However, this would be true as the number of SAGAT stops is large enough to cover the entire duration of the task. This is impractical, as it is extremely disturbing for the subject. For this reason a relatively small number of stops has been used so far [45; 46; 49; 145]. In this case though, situation awareness is not measured between the stops, something which gives a partial picture of the subject’s situation awareness for the complete duration of the task. On the other hand, a serious limitation of ASAGAT is its high obtrusiveness. Although this is something that can be afforded in this simulated study, it is not the case in real world scenarios. ASAGAT is based on Endsley [50]’s model of situation awareness (Sections 3.1.1 and 3.1.2). According to this, situation awareness is a continuous three-level process. The first one is the perception of data, the second is the comprehension of this data into meaningful information, and the third is the projection of future states based on the results of the first two. The ASAGAT items should be reflecting one or more of these dimensions. SAGAT was developed for the domain of air traffic control, and
3.1 Situation awareness
51
as such its items are domain specific. New ones had to be designed for the robotics teleoperation task under investigation. These were based on the situation awareness dimensions presented in Section 3.1.5. So for example, the item asking “how much area has been searched so far”, falls under both the mission awareness and spatial awareness dimensions, because it consists of a mission goal and also examines the knowledge of the subject on localisation issues. It also falls under the comprehension (L2) dimension on Endsley’s model, because it combines multiple elements of knowledge, such as a series of positions, range of sight and dimensions of the room, to give an answer. The complete list of the ASAGAT items and their corresponding dimensions are presented in Appendix A. For rapid and easier experimentation a software version of the ASAGAT method was implemented using C/Gtk+. The final score of the subject’s situation awareness is the average score of all items.
QASAGAT: Quantitative Analogue Situation Awareness Global Assessment Technique The Quantitative Analogue Situation Awareness Global Assessment Technique is a completely new method developed in this research. The reasons for its necessity are easier to explain after the method is presented. QASAGAT is based on ASAGAT, presented in the previous section, and the Quantitative Analysis of Situational Awareness (QUASA) [116]. The latter utilises a query method in which the subject is periodically probed with statements regarding the current situation and is asked to give a true or false answer. In addition, a calibration technique is used to eliminate any bias. This is done by asking the subject to self-rate his/her confidence on a 5-point scale the correctness of each of his/her replies. The bias-score is “the average confidence rating across all test items minus the proportion of the same items that were judged correctly. In terms of situation awareness, a “well-calibrated individual” is one who has a high level
3.1 Situation awareness
52
of actual situation awareness and correctly perceives this to be the case in his/her perceived situation awareness” [116]. In other words, this implies that situation awareness is not only a matter of how good the understanding that the subject has about the situation, but also a combination with the right or wrong belief that the subject has about the true level of his/her situation awareness. For example, a well-calibrated subject is one that believes that his/her level of situation awareness is high or low when they truly are. A badly-calibrated subject is one that believes that his/her situation awareness is high when it is actually not, or the other way around, one that believes he/she has a low level of situation awareness, when in fact this is high. The advantage of a well-calibrated subject is that he/she is aware of his/her capabilities and limitations, i.e. a subject that recognises his/her poor situation awareness can take appropriate actions to improve it, or a subject that is correctly confident about his/her high situation awareness can make good decisions. On the other hand, a badly-calibrated subject is either erroneously over-confident or underconfident, making decisions based on false evidences. As such, there is a theoretical reason that by taking into account the self-awareness of the subject, QASAGAT makes an improvement on the accurate measurement of situation awareness over the ASAGAT method. The QASAGAT method developed here has a different procedure. First of all, the ASAGAT method is used, i.e. the queries are measured in a scale rather than as simply right or wrong answers. The second difference is that the confidence scores of each answer modify the individual answers, rather than forming an average level of confidence. There are penalties whenever a false-positive or a true-negative situation occurs. For example, if a subject has a high confidence on a correct response or a low one on a wrong one, then the final score remains unchanged, however, if the subject has a high confidence on a wrong answer or a low one on a correct one, then the score of the answer is reduced by a penalty of 0.1 per unit of deviation from
3.1 Situation awareness
53
the corresponding confidence. This is done as such, because it is in agreement with the theoretical assumption that situation awareness is a matter of understanding the situation and also being aware of your true level of it. A further reason for this change is that in its original form is not applicable in this case, due to the scalar nature of some of the answers, which do not give a strict right or wrong answer. The confidence scores are measured on a 5-point scale, with the lower values indicating low confidence. If the penalty given is more than 0.1, then the effect of the confidence is large enough to lead into non-representative results. For example, in the extreme case that a query is perfectly correct, a score of 1, but the subject has a very low confidence, a score of 1, then if the penalty is 0.2, the outcome would be 0.21 , a score that significantly underestimates the still correctness of the response. The list of items of the QASAGAT method are identical to ASAGAT (Appendix A). By having as backbone the ASAGAT method, it also inherits its advantages and disadvantages.
CARS: Crew Awareness Rating Scale The Crew Awareness Rating Scale [117] is a subjective self-rating method, used postexperimentally. CARS consists of 8 items (see Appendix B) which aim to measure the same dimensions that the original SAGAT is based on. The subjects provide their answers on a fully labelled 4-point scale, which gives better descriptions of each point. The scores from each item are averaged to provide a mean score of the overall situation awareness of the subject, ranging in a continuous scale from 1-low to 4-high. The main advantage of CARS is that it is possibly the only method generic enough to be transferred across a wide range of application domains with little or no modification at all. Being a subjective method, it is easy and quick to administer and to analyse. 1
1 − (5 − 1) × 0.2
3.1 Situation awareness
54
On the other hand, this abstraction makes it incompatible with the main set of dimensions and does not offer any results on the specific aspects of situation awareness. Moreover, being a retrospective method, it suffers from the criticism of memory decay. Also, like all subjective methods, its subjectiveness is another common criticism. To this last criticism Jones [100] replies that “multidimensional rating scales break situation awareness down into its components that are, arguably, available for self-rating.”
PASA: Post Assessment of Situation Awareness The online methods (ASAGAT and QASAGAT) measure situation awareness by sampling at some random intervals. This has the limitation that changes in the levels of situation awareness that occur in between are missed. Retrospective methods (CARS) measure the levels of situation awareness of the subject by looking back at the complete task. The drawback of CARS is that it is too generic to capture the individual factors that affect the situation awareness of the user of a teleoperated robot. A new measurement method, called Post Assessment of Situation Awareness (PASA), was developed in this research to overcome these drawbacks. It is applied post-experimentally, and as such has minimum interference with the execution of the task, something that makes it applicable in real-world experiments. Also, being retrospective it is able to measure the subject’s situation awareness over the complete duration of the task. The items are similar to the ones in ASAGAT, but they are expressed in a way that is “looking back” over the complete duration of the task. For example where a ASAGAT query might be “What is your current position and orientation?”, the PASA one is “How well do you feel you were able to keep track of your position and orientation?” The complete set of items (Appendix C) cover all the dimensions of situation awareness, offering improved diagnostic capabilities. But, because of this tight integration with the specific domain of telerobotics, it is not reusable into other applica-
3.1 Situation awareness
55
Table 3.7: Mapping of the items in SPASA with the ones in PASA and CARS SPASA 1 PASA 1 CARS 1
2 2, 3 1
3 4 1
4 5, 7 1
5 6 1
6 8 1
7 9 3, 7
8 10 4
9 7 8
10 7 5
11 6
tion domains. Being a subjective retrospective method, it inherits all the main pros and cons of them, such as being easy to use and to analyse, having low obtrusiveness, but suffering from memory decay. The subjects answer on a 6-point scale, with the minimum and maximum values accordingly labelled (see Appendix C for an example). A biased scale was chosen because a neutral answer actually indicates a poor level of situation awareness. Six points were also chosen because this number provides good sensitivity [54]. The scores from each item are then averaged to provide a mean score of the overall situation awareness of the subject, ranging in a continuous scale from 1-low to 6high.
SPASA: Short Post Assessment of Situation Awareness PASA can be further improved into two directions: to make it faster to use, as this would make it more suitable for real world scenarios; and to include the helpful items from CARS that are not already covered by PASA, such as the item that measures situation awareness as a global structure. Most importantly, by having a method that covers both PASA and CARS, these two will be no longer needed. The result of these improvements was the new measurement method, called Short Post Assessment of Situation Awareness (SPASA). Table 3.7 shows the mappings of the items of SPASA with those of PASA and CARS, explaining the relation of the parent methods with the child one. Nearly all the items from PASA are inherited by SPASA. Only item 7 -“How well do you feel you were able to keep track of the status of the modules of the robot?”-
3.1 Situation awareness
56
is dropped out. The reason was that this item is already covered by items 9 -“It was easy to change my course of action because I felt confident about the information provided”- and 10 -“The information were provided at a rate I could easily perceive”of SPASA. Another change was the integration of items 2 -“identifying obstacles”and 3 -“avoiding them”- of PASA, into one as they make more sense as a joined one, because they query about the same thing, since avoiding an obstacle requires that you identify it first. Furthermore, main differences between the two include the way in which the items are expressed and measured in each one of them. In PASA these were questions with a 6-point scale labelled at the two extreme values. In SPASA the items are statements with which the subject expresses his/her agreement/disagreement on a 4-point Likert scale [109; 200], fully labelled at all points, similar to the one used in CARS. These changes make the method faster and clearer to the subjects, because firstly it is easier to provide a rating in terms of agreement or disagreement, rather than into a scale of “not well – very well”, as used in PASA; and secondly because the scale is shorter, making the process of deciding the most representative answer easier. This comes though at the price of losing some of its sensitivity, which a scale with more points better has [54]. However, it has also be noted that when subjects have to answer in scales with a large number of points, they tend to avoid the extreme values [54]. A biased scale was again used for the same reasons as with PASA, i.e. a neutral answer is actually an indication of poor situation awareness. The scores from each item are again averaged to provide a mean score of the overall situation awareness of the subject, ranging in a continuous scale from 1-low to 4-high. The majority of the CARS items are included in SPASA. Item 1 of CARS “Would you say your awareness of relevant information is satisfactory?”-, is redundant as it is already covered by items 1–6 of SPASA, which investigate specific pieces of “this relevant information”, such as localisation, avoidance of obstacles and hazards, battery level, etc. (for more information see Appendix D). Item 2 of
3.2 Telepresence
57
CARS -“Would you say your grasp of the situation, i.e. understanding of what is going on, is satisfactory?”-, is actually another way of asking the subject to self-rate his/her situation awareness. Such items, or methods consisting of such items (e.g. PSAQ [113]), have received strong criticism about their validity as measurements ([140], Section 3.1.3). The rest of the CARS items were included in SPASA, although they had to be rephrased from a question-like form into statements, e.g. items 5 -“Would you say it is easy to keep to speed with the details of the situation?”- and 8 -“Would you say it is easy to make sense of the situation as a whole, to see the “big picture”?”were rephrased to items 10 -“The information were provided at a rate I could easily perceive”- and 11 -“I was able to have a good understanding of the holistic (global) situation”-. Further changes to some of the CARS items were necessary so that they reflect one or more of the mission, spatial, time awareness dimensions, e.g. item 8 of CARS -“Would you say it was easy to decide upon the best course of action?”- was changed to item 9 in SPASA -“It was easy to change my course of action because I felt confident about the information provided”-, which falls under the mission awareness dimension by reflecting the ability to change strategy and actions upon the light of new information.
3.2 3.2.1
Telepresence Definitions
Telepresence (TP) was a term introduced by Minsky [124] to describe the sensation of being physically present on the remote site of the telesystem that the human operator is using. According to Akin et al. [4] telepresence occurs when at the worksite the teleoperated systems have the dexterity to allow the operator to perform normal human functions (e.g. moving, colliding with an obstacle, lifting an object, etc.), while at the remote control station the operator receives sufficient quantity and
3.2 Telepresence
58
quality of sensory feedback to provide a feeling of actual presence (e.g. the sensation of moving into space, the collision with an obstacle, the perceptual feedback of lifting an object, etc.) at the worksite. Held and Durlach [80] think though that such a definition is limited as it does not provide any evidences on how this can be measured, because the restriction of being able to perform normal human functions excludes a variety of systems that allow humans to perform abnormal ones. What it is generally agreed by many researchers [14; 161; 162; 171] is that telepresence expresses the sensation of being present at the remote environment. Sheridan [162] makes a distinction between telepresence and virtual presence where the remote environment is the real world or a virtual/computer generated version of it. However, such a distinction is unnecessary from an analytical point of view, according to Ijsselsteijn et al. [87], and in fact the term telepresence is used to imply virtual presence as well.
3.2.2
Theories and models
Telepresence has been a main research issue for years because of its hypothesised positive effect on task performance [24; 83; 162; 171]. Riley [145] states that “telepresence is a psychological experience of the human that is postulated to enhance sensorimotor, as well as cognitive, performance in teleoperation”. However, Held and Durlach [80] warn that this is an experimental hypothesis and there is no proven theorem stating that these two are truly related. It is commonly accepted [87; 161] that some of the main factors that affect telepresence include: the extent and fidelity of sensory information, which is the amount and usefullness of the information presented to the operator; the consistency of the displayed information and the controls with the true state of the environment and the actions of the system; content factors, which include all the entities in the environment and their properties and interactions with the subject and among them; and user characteristics, such as skills and experience.
3.2 Telepresence
59
The interaction interfaces are very much responsible for these factors. Smith and Smith [168] have described telepresence in terms of HMI interfaces and the compatibility to “the behavioural-physiological performance capability and limitations of the human”. In addition to, Sheridan [161, 162] adds that given “a sufficiently highfidelity display, a mental attitude of willing acceptance, and a modicum of motor participation”, a human operator can experience telepresence during teleoperation. A lot of researchers, particularly ones concerned with virtual reality, investigate the effect of technological equipment to telepresence. According to Slater and Wilbur [165] the investigation of the interaction interfaces with the sense of telepresence, is actually called immersion, a quantifiable aspect of the interaction interfaces, while telepresence is a “state of consciousness”. In the same lines Witmer and Singer [205] state that immersion is a psychological state that an individual experiences, affected by the degree that the interaction interfaces and media enhance isolation from the local environment, perception of self-inclusion, natural modes of interaction and control, and perception of self-movement. They support that in addition to immersion, involvement of the subject is what leads to the experience of telepresence. They explain involvement as another psychological state an individual experiences, which is affected by the shifting of attention to a meaningful and coherent set of stimuli in the remote world to the exclusion of unrelated ones from the local environment. However, they suggest that immersion and involvement are not necessarily related to each other, e.g. a usual arcade game may lead to high levels of involvement even if it poorly supports immersion. Their views further suggest that although both immersion and involvement are important contributors to telepresence, high levels of one can lead into a sensation of telepresence, despite the level of the other. This last remark is very important for investigating telepresence in telerobotics, as most of the time the interaction interfaces are computer graphical displays, which poorly support immersion. But, they can be designed to support involvement, and therefore telepresence, by a consistent flow of information and an easy and friendly
3.2 Telepresence
60
way of control.
3.2.3
Measurement methods
Based on these factors a number of objective and subjective measurement methods have been proposed. Riley [145] states that there is no consensus on what constitutes a good measurement method of telepresence. Sheridan [161] though argues for the need of operational, repeatable, reliable, useful and robust measurement methods for telepresence.
Subjective measurement methods Subjective measurement methods seem to be more popular [145]. Sheridan [161] states that telepresence is a subjective sensation, and argues for their power and high validity. Such methods are typically used retrospectively, requiring the subject to self-report and self-rate the level of experienced telepresence. Witmer and Singer [205] have developed a measurement method based on their theoretical views on telepresence being mainly determined by immersion and involvement. The method is applied in two stages. In the first one, the subject, before starting the execution of the task, is asked to self-rate his/her immersive and involvement behaviour on common everyday activities. In the second stage, which is applied after the end of the task, the subject is required to self-report his/her experienced telepresence by answering some items that reflect the factors and analytical subscales of control, sensory, distraction, realism, involvement, naturalness, auditory and haptic interaction, and resolution and interface quality. It is at this stage that the actual level of experienced telepresence is being measured. Slater [163] criticises this method that none of the items directly measure presence. Such criticism though is a little confusing, as a lot of measurement methods of telepresence, as well as of other human factors, e.g. situation awareness, workload, etc., attempt to assess these variables based on measurements of their hypothesised
3.2 Telepresence
61
underlying factors, something that should be considered as direct measurement of the variable of interest. Another confusing criticism is that, the WSPQ method is rather subjective, because it measures the individual characteristics of the subjects, meaning that different results from different subjects are provided about the same system/interface, instead of actually investigating how the system/interface itself influences telepresence. The point made is that it seems from these measurements that telepresence is a function of factors merely residing in the subject, rather than to the system or to both. The truth is that telepresence is a human factor, and a developed system should be able to cover a wide range of users, rather than the opposite, i.e. a wide range of users should be able to adapt into a particular system. There is no doubt, that the interaction interface is an important factor of telepresence, and when measuring the experiences of the users, it is the system that it is being actually assessed, rather than the user him/herself. A good point made by Slater [163] is that by using the WSPQ method, it is not possible to separate the measurement of telepresence from the measurements of the hypothesised factors that influence it; i.e. by summing up the individual scores of each factor it only makes sense to investigate their relative variation with each other rather than the actual contribution they have on telepresence. On the other hand, it can be assumed that all factors have an equal contribution to it, although such an assumption needs experimental validation. This criticism can be further extended on the methods of measuring situation awareness and workload. Slater, Usoh and Steed have also proposed their own measurement method [166; 192]. It is applied retrospectively, and it is also based on self-reports of the subjects. However, it is faster than the WSPQ one, as it consists of fewer items, which reflect the sense of being in the remote environment, the extent in which the remote environment becomes the dominant reality, and the extent in which the remote environment is remembered as a place. These three dimensions emerge from the views of Kim and Biocca [105] on telepresence, i.e. that there are two dimensions of telep-
3.2 Telepresence
62
resence worth evaluating: a departure from the local world and an arrival into a remote one. To recapitulate these two views on the assessment of telepresence; WSPQ assumes that telepresence is a function of immersion and involvement influenced by the characteristics of the system as well as those of the individuals [205]; while the SUSPQ approach following a more absolute approach, supports that immersion is a quantifiable description of the display technology and only of that [165; 166]. Both agree on one thing, that telepresence is a psychological construct of the subject. Although the majority of the subjective measurement methods of telepresence are applied retrospectively, there are cases in which the subjects self-report their experiences continuously throughout the task, e.g. using a slider to indicate any adjustments [62]. The problem with them is that they are highly obtrusive, and in some cases even impractical to apply as the subject may not be able to allocate any physical or mental resources for it. On top of that, they can negatively affect telepresence, because the subject is continuously requested to perform a separate external task. A less popular category of subjective measurement methods is based on psychophysical methods, with very little experimental research available [87]. An example of psycho-physical methods is cross-modality matching, in which a subjective expression of a sensation represents the level of experience of telepresence, e.g. volume of voice [197]. However, such methods seem impractical for the domain of telerobotics as they are highly obtrusive, subjective and unreliable.
Objective measurement methods Objective measurement methods of telepresence have also been proposed, although they are not as popular as the subjective ones. Ijsselsteijn et al. [87] distinguishes between four types of them: postural responses, social responses, physiological measures, and dual task measures.
3.2 Telepresence
63
Postural and social responses, as suggested by many researchers [63; 80; 161; 164], are based on the concept that the user expresses telepresence in the form of reacting to the events occurring in the remote environment as if they were happening locally, e.g. ducking as a reflex response into an approaching looming remote object or smiling in the occurrence of a remote positive event; this kind of behaviour has been named behavioural presence [164] or behavioural realism [63]. In order to observe such events the environment and the task themselves should greatly support events that evoke such behaviour, something that is not always the case in many tasks, without that implying that the user does not experience any level of telepresence. The task of teleoperating a robot inside a building, driving a car in a simulator, and moving around in shoot-em up games are typical example activities, which do not frequently evoke any behavioural presence. In some rare events, behavioural presence might emerge when for example the user of the robot wants to see behind an object and extends his/her head, the driver of the car starts traversing corners in high speeds and leans his/her body to one direction to signify this effort, or the gamer starts ducking when bullets are fired towards him/her. The bottom line is that if telepresence is to be measured through postural or social responses, then the experimental task should be designed so that it frequently includes activities that evoke such responses. Physiological measurement methods are based on measuring the variations of physiological indicators, such as heart rate and skin conductance response, according to variations of telepresence [118; 119]. Postural and social responses, along with physiological measurements and the use of virtual reality technologies have been used in psycho-physiological phobia treatments, such as height [201] or flying [103; 198] phobias, arachnophobia [31], etc. A serious drawback with physiological measurement methods is that the cost of the measurement equipment is usually very high. In psychotherapy and entertainment applications the cost of these systems may be justifyable, because performance is dependent on the realism of the scenario
3.2 Telepresence
64
and the physiological responses of the subject that express fear or excitement. In other words it could be said that performance is actually synonymous to the level of experienced telepresence. On the other hand, in the domain of robotics, performance is typically measured in terms of mission accomplishment. Taking into account that the relation between telepresence and performance is still an open question, and also Witmer and Singer [205]’s view regarding immersion and involvement, physiological measures may not be ideal. Ijsselsteijn et al. [87] cross-citing Greenwald et al. [73] supports these views by stating that “galvanic skin response and heart rate variations are sensitive to arousal and hedonic valence, important components of emotion such as excitement”. These factors may be important in entertainment applications and psycho-physiological treatment methods, but definitely not as much in other domains, such as robot teleoperation. In plain words, although physiological measurement methods of telepresence seem to be objective and valid, they might be inappropriate for all domains, one of them being teleoperation, due to the high cost of the equipment needed, and the low effect of the psychological elements influencing the physiological indicators measured. The last category of the objective methods is the secondary task measurement one. These methods are based on the assumption that the allocation of attentional and processing resources is important to telepresence, since if more effort is required for the primary task, then less resources are left for the secondary one, provided that the number of these is finite [14; 24; 41; 205]. Ijsselsteijn et al. [87] hypothesise that “as presence increases, more attention will be allocated to the mediated environment, which would mean an increase in secondary reaction times and errors”; or alternatively, the extent in which information from a secondary source is processed indicates the number of resources used for the primary task, and hence the level of involvement and telepresence of the subject with it. Ijsselsteijn et al. [87] also suggest that the information coming from the secondary task could be coming from the local world, however, it must have some ecological meaning, otherwise telepres-
3.2 Telepresence
65
ence diminishes due to the nature of the secondary task, e.g. the sound of a phone ringing in a simulation of an underwater task [87]. However, these methods are not so popular, possibly because the other methods, e.g. multidimensional subjective methods or continuous measurement of physiological indicators are less obtrusive and offer a better diagnosticity. Moreover, attention or lack of attention into a secondary task might not be an indicator of telepresence but rather of high or low levels of workload.
3.2.4
Telepresence and human-robot interaction
Telepresence seems to be playing an important role in the performance of systems used in the domains of entertainment, virtual reality and therapeutic treatments, as the two of them are synonymous. In the case of teleoperators, it has been speculated that the experience of telepresence should increase the actual task performance, as the interaction interfaces should be easy to use and natural, so that the human operator of the robot would focus into the mission goals and having the sensation that he/she is present into the remote environment [161; 162]. Welch [196] notes that there are no experimental studies to even conclude that telepresence consists a causality of task performance, no more to support such a hypothesis; and strongly suggests experimental studies in this direction, because any attempts to improve the support of systems to telepresence, with the belief that such a thing would improve the task performance, might prove to be a waste of time and effort. Such an experimental study was conducted by Riley [145]; Riley et al. [146], using a teleoperated robot de-mining task. Task performance and telepresence were individually measured, using the average time-to-mine neutralisation for measuring performance, and the Witmer-Singer method for measuring telepresence; followed by a statistical correlation analysis to explore their relation. This approach is rational and theoretically sound, as also suggested by Welch [196]. The results showed that there is a positive correlation between the two. However, this study has already
3.2 Telepresence
66
been criticised (Sections 3.1.4 and 1.3) for its partial measurement of performance, which has an impact on the quality of the results.
3.2.5
Proposed methods for measuring telepresence
So far the various types of measurement methods for telepresence have been presented along with their strengths and weaknesses. The high cost of the equipment needed in the objective methods to measure the behavioural responses and the variations of the physiological characteristics of the subject caused by telepresence, as well as the fact that some applications may not promote such reactions, make these methods inapplicable for these experiments. On the other hand, subjective methods are based on self-reports of the subjects themselves or rating from external expert observers. They are hardly obtrusive, are easy and fast to use and to analyse, have a very low cost and are usually based on multiple dimensions of telepresence. For all these reasons they are much more popular than the objective ones.
WSPQ: Witmer–Singer Presence Questionnaire The Witmer–Singer Presence Questionnaire [204; 205] is a subjective rating method, which is applied retrospectively. In its final version it consists of 19 items (Appendix E), which reflect the following three dimensions of telepresence: The Involvement-Control dimension addresses how much the visual and
perceptual aspects contribute to the level of involvement of the subject, the level of control that the subject has over the remote environment and the level of responsiveness of the environment to subject-initiated actions. Example items are -“How much did the visual aspects of the environment involve you?”and -“Were you able to anticipate what would happen next in response to the actions that you performed?”-. The Naturalness dimension addresses the level of realism that the virtual
3.2 Telepresence
67
environment resembles to a real world one. Example items are -“How natural did the interactions with the environment seem?”- and -“How natural was the mechanism which controlled movement through the environment?” The Interface Quality dimension addresses the level of distraction that the
interfaces oppose to the subject, which results in loss of focus from the actual task and hence into degraded telepresence. Example items are -“How much did the control devices interfere with the performance of the assigned tasks or with other activities?”- and -“How well could you concentrate on the assigned tasks or required activities rather than on the mechanisms used to perform those tasks or activities?”Each item is rated on a 7-point scale with the minimum, median and maximum values labelled accordingly [205] (see Appendix E for an example). The scores of each item are combined to provide a composite score of overall telepresence, with higher values indicating higher levels of perceived telepresence. This method extends beyond the stereotypical interpretation of telepresence, that of being the sensation that a subject is perceiving the remote site like being physically there, something which is still reflected by the naturalness dimension. The involvement-control dimension is measuring the level of immersion of the subject in the task, while the interface quality dimension is measuring how well the interaction interface supports or distracts this immersion. This interpretation is important as it can be argued that a computer monitor and a joystick may offer a less natural way of interaction than a virtual reality helmet and a haptic interface that seem to be closer to the way humans perceive and interact with the world. However, it is possible that a high level of subject’s involvement in the executed task can make a computer display and a joystick seem as a natural way of interacting with the robot and the environment.
3.2 Telepresence
68
MSUSPQ: Modified Slater–Usoh–Steed Presence Questionnaire Slater–Usoh–Steed Presence Questionnaire [166; 192] is a subjective rating method, which is also applied retrospectively. It is influenced by the views of Kim and Biocca [105], according to which telepresence is the sense of departure from the local world and arrival into the remote one. It consists of 6 items asking the subject to selfreport on a 7-point scale (see Appendix F for the list of items and an example of the measuring scale): on the sense of being in the remote environment, the extent to which the remote environment becomes the dominant reality, and the extent to which the remote environment is remembered as a “real
place”. The telepresence score is calculated as the number of questions that scored a 6 or 7 over the total number of questions, and the higher the ratio the higher the level of the experienced telepresence. This kind of rating though seems to be resembling the strict rating procedure that was used by SAGAT in the measurement of situation awareness, resulting into less sensitive results. For this reason, this last step is replaced by using the average score of the items instead. Also the original items have been slightly changed to reflect this particular operating environment. For reasons of clarity, the modified version is called Modified Slater–Usoh–Steed Presence Questionnaire (MSUSPQ).
SPATP: Short Post Assessment of Telepresence It would be better to combine the two methods of measuring telepresence (WSPQ and MSUSPQ) into one, so that the benefits from both would be gained, while at the same time the administration time would be reduced. The result is a new method, called Short Post Assessment of Telepresence (SPATP). It consists of 12 items rated
3.3 Workload
69
on a 5-point fully labelled Likert scale, which allows the subject to easier choose the most representative point as they are clearly described by their labels. The full list of the items along with the rating scale are presented in Appendix G.
3.3
Workload
The increased complexity of modern systems requires greater demand and effort from their operators. Although this seems like a controversial statement, since the development of new intelligent machines is to relieve humans from many tasks and reduce their workload; the new demands and modalities re-define the roles and tasks of human operators. Humans are swapping from the solo role of machine operators to operators, supervisors and co-workers of intelligent systems [154; 162]. Tsang and Wilson [180] state that these new responsibilities and multiple roles of humans require them to be able to develop and maintain high levels of situation awareness, something that has direct relations to workload, considering that the demands for maintaining high levels of situation awareness compete with the actual task demands for the common processing and attentional resources. In other words, although a great deal of workload has been taken away, the new roles and demands have transformed the context of it. Another good remark that they make, is that the recent increased interest in investigating the user’s situation awareness can benefit from the studies of workload, and that the studies of both human factors can further benefit the design of complex systems from a human-centric point of view.
3.3.1
Definitions
Tsang and Wilson [180] define mental workload as the amount of work that a human operator has to do together with the finite processing resources required to effectively perform it. In the case where the resource demands exceed the user’s capacity, then the levels of workload reach critical points and the user is unable to adequately
3.3 Workload
70
perform the required task. It is the system designer’s responsibility to identify the amount of workload posed by his/her developed system and what are the effects of it. For this reason a number of measurement methods have been developed [70; 94; 169; 180].
3.3.2
Measurement methods
It is commonly agreed across the research community [96; 150; 169; 180] that there are four main categories of measurement methods, based on the type of the data collected and what is primarily measured. These are2 : analytic measures, performance-based measures, psycho-physiological measures, and subjective rating measures.
Analytic measures Analytic measurement methods rely on modelling the workload situation, and are used both in an evaluative as well as a predictive manner [180]. Although they consist the least popular group, Tsang and Wilson [180] further advocate for them believing that since each parameter and assumption must be made explicitly, then careful consideration about these parameters should be taken into account even from the design stage, providing specific predictions subjected to empirical evaluation and facilitating communication of studies. The most serious drawback of these methods comes from their very specific nature, as once developed for a particular domain they are so tied to it that it is not possible to be reused in any other sector. 2
Although the terminology may slightly vary in some papers, e.g. Johannsen [96], they still express the same categories.
3.3 Workload
71
Performance-based measures Performance-based methods, as their name implies, measure the performance of a primary or of a secondary task, and through these they try to infer the level of the experienced workload. These are similar to the implicit methods used in the measurement of situation awareness and are based on the assumption that high levels of workload will have a negative impact on performance as the human perceiving and processing resources are finite. Primary task methods attempt to infer the level of workload by measuring the overall task performance. This is a convenience since task performance is usually measured in any case in the first place [180]. Moreover, a great deal of experts consider these methods to be objective measurements of workload [70; 169; 180]. On the other hand, they have been strongly criticised that variations or non-variations in performance may be due to other factors (e.g. skill, experience, telepresence, situation awareness, etc.), rather than solely of changes in workload [169]. Since workload is a measurement of to what extent the processing resources are used, a common performance-based measurement technique is to measure the performance of the operator on a secondary concurrent task. It is based on the assumption that both primary and secondary tasks are using the same resources, and any spare capacity from the primary task will be used to perform the secondary one, i.e. changes in the primary task demand should result in changes in the performance of the secondary task as more, or less resources become available for it [180]. Typical examples of secondary tasks include detecting certain stimulus, counting and calculating arithmetic operations, classification of objects, reaction times to certain stimulus, monitoring and memory recalls, etc. [70]. Gawron [70] believes that they can provide a sensitive measure to operator mental capacity even in low levels, as well as sensitivity to variations of workload due to different system configurations, which might be indistinguishable by primary task performance measurement methods. He also thinks that they can provide a sensitive index of task impairment due
3.3 Workload
72
to stress, and that they can provide a common metric for comparisons of different tasks. Tsang and Wilson [180] note that secondary performance measurement methods can be applied in cases where the measurement of the primary task is difficult or not possible at all. On the other hand though, these methods have been severely criticised for their obtrusiveness with the primary task execution [70; 169; 180], and as a common workaround for this problem, it has been suggested that the secondary task should be one which is embedded within the primary task execution. To further strengthen this view, Tsang and Wilson [180] note that secondary task performance methods will only be sensitive workload measures of the primary task, only if both of them are competing for the same resources, based on the initial assumption that such methods measure the spare capacity of the operator from the primary task. However, if not carefully selected, then there is the danger that the secondary task will become the primary one. Another important criticism, common in all performance-based or implicit measurement methods, is that the relations between workload with the secondary ones are not well understood and quantified, something that has an effect on the results and makes these methods less popular [70].
Psycho-physiological measures Psycho-physiological measurement methods try to infer the level of workload, by measuring psycho-physiological aspects that are affected by it, such as heart rate variability [120; 128; 203], eye movement and brain activity [183; 203] and breathing frequency [95]. They are very much similar to the physiological methods used in the measurement of telepresence, and as such they have the same strengths and weaknesses. This means that they have very low obtrusiveness, which makes them applicable in real world scenarios, the monitoring is usually continuous and provides information about the whole of the task [169; 180]. On the other hand, the cost of the equip-
3.3 Workload
73
ment needed is much higher than for any other method [169]. Moreover, like in the case of telepresence and its physiological responses, where the associations between them are not well understood, here as well the associations between workload and its physiological responses are unclear, making these methods complex to use and to analyse [95].
Subjective rating methods The category of the subjective rating methods is the most popular one. As their name implies, they are based on self-reports and self-ratings from the users regarding their experienced workload. They are applied retrospectively or concurrently with the task, and as such they have low obtrusiveness. Their main criticism resides on their subjectiveness. Muckler and Seven [127] surprisingly argue that there is no meaningful distinction between subjective and objective measurement methods in human performance studies, since as long as humans are involved, either as subjects or experiment designers, then there shall always be an element of subjectiveness. Gawron [70, pp 102] further adds to their advantages by saying that they are inexpensive, easily administered, easily transferable and have high face validity; while their disadvantages include potential confounding of mental and physical workloads, difficulty in distinguishing external demand/task difficulty from actual workload, unconscious processing of information that the operator cannot rate subjectively, dissociation of subjective-rating and task performance, the requirements of welldefined questions and dependency on short-term memory. Stanton et al. [169] distinguish between two groups of subjective methods, unidimensional and multi-dimensional ones. Examples of uni-dimensional measurement methods include the Cooper-Harper Scale [30] and its many variations such as the Bedford Scale [148], the Honeywell Cooper-Harper Scale [206], the McDonnell Scale [115] and the Modified Cooper-Harper Scale (MCHS) [199]. All these methods follow a decision-tree like structure guiding the rating of perceived workload from
3.3 Workload
74
the subject. These methods are easier to use and analyse, but they seem to suffer from sensitivity issues [145]. Multi-dimensional methods, as the name implies, rely on the subject’s rating over several dimensions of workload. Two of the most popular ones are the NASA Task Load Index, which has six dimensions: mental demand, physical demand, temporal demand, performance, effort and frustration [74]; and the Subjective Workload Assessment Technique with three: time demand, effort demand and frustration [144]. Due to their high validity and easiness of use, subjective measurement methods are the only ones that have also been applied in the robotics domain.
3.3.3
Workload and human-robot interaction
Riley [145] used the MCHS to measure the workload of a human teleoperating a robot in a simulated robot de-mining task. The experimental results showed that the initial hypothesis, that the level of task difficulty would affect the operator’s mental workload, did not hold true. One possible reason as she explains might have been that the subjects felt overconfident as they managed to successfully complete the task resulting in underestimating the true level of mental workload required. Another reason was the uni-dimensional nature of the scale, which is mainly related with performance in terms of task accomplishment and number and significance of errors, neglecting any other contributing factors to workload, such as time pressure, frustration, processing demands, etc. This clearly illustrates the diagnostic and sensitivity limitations of uni-dimensional methods, in contrast to multi-dimensional ones. NASA-TLX has also been used in a number of studies involving assessment of human-robot interaction interfaces [40; 52; 59; 82; 86; 99; 101]. A common mistake in all of them is that they take into account all the dimensions of the method, even ones that are not applicable such as the physical demand, resulting into inaccurate and misleading results.
3.3 Workload
3.3.4
75
Proposed methods for measuring workload
So far the various types of measurement methods for telepresence have been presented along with their strengths and weaknesses. Analytic methods may be a good assistance in developing systems with the aim of reducing the workload, however, in terms of quantifying the actual level of the workload posed by the system, they do not provide any measurement. In addition to, considering that the relation between performance and workload still remains unquantifiable, and this is one of the research hypotheses here, it does not make any sense to use any of the performancebased or psycho-physiological methods. Subjective methods seem to be the most appropriate ones, and their selection is not a matter of despair, rather the contrary considering their strengths.
TLX: NASA Task Load Index NASA Task Load Index [74], which was briefly mentioned in Section 3.3, is a subjective self-rating measurement method of workload, widely accepted due to its validity, reliability and sensitivity. It is applied post-experimentally. It consists of six component scales: Mental demand: How much mental and perceptual activity (e.g. thinking,
deciding, calculating, remembering, looking, searching, etc.) was required? Was the task easy or demanding, simple or complex, exacting or forgiving? Physical demand: How much physical activity (e.g. pushing, turning, con-
trolling, activating, etc.) was required? Was the task easy or demanding, slow or brisk, slack or strenuous, restful or laborious? Temporal demand: How much time pressure did you feel due to the rate
or pace at which the task or task elements occurred? Was the pace slow and leisurely or rapid and frantic?
3.3 Workload
76
Performance: How successful do you think you were in accomplishing the
goals of the task set by the experimenter? How satisfied were you with your performance in accomplishing these goals? Effort: How hard did you have to work (mentally and physically) to accom-
plish your level of performance? Frustration level: How insecure, discouraged, irritated, stressed and an-
noyed versus secure gratified, content, relaxed, and complacent did you feel during the task? The physical demand factor has been excluded as it is not applicable in this experimental case, since the task does not really require any physical stress from the subject other than moving a joystick or pressing some keys. The experimental procedure consists of two stages. On the first stage, the subject self-rates on a scale of 1-100 each one of these factors. The second stage determines the weight of each factor by presenting all possible pairs of the them and asking the subject to select which one according to him/her has a more significant contribution to the overall workload for the specified task. The final score of TLX is a weighted average of these component scales representing the overall workload of the specified task. US Naval Research Lab: NCARAI–IDE Section [191] has developed a software version of TLX for rapid experimentation. However, this version does not allow the experimenter to exclude inapplicable factors, it does not allow continuous ratings rather than discrete with a step of 5 units, and it can run only on only one kind of platform3 . For these reasons, a cross-platform version of TLX has been developed, using C/Glade/Gtk+ (Appendix H), that eliminates the drawbacks of the previous software. 3
The software runs under Win32 platforms. Under Linux platforms it has been tested to be possible to run through the Wine emulator.
3.3 Workload
77
MCHS: Modified Cooper–Harper Scale The Modified Cooper–Harper Scale [199] (MCHS) is a one-dimensional measurement method of workload based on task performance in terms of the number and magnitude of errors occurring, as well as to what extent it is possible to accomplish the task. It consists of a rating scheme synthesised by the difficulty level of the task as influenced by the system under investigation and the opposed subject’s demand level. It uses a 10-point scale, where 1 represents a desirable system that opposes minimal workload demand and it is easy to attain a good performance, and 10 represents such high levels of workload opposed by the system that the instructed task cannot be reliably accomplished. The actual experimental procedure is a guided selection based on three questions regarding to what extent the task can be accomplished without any errors, the severity of errors and the level of mental effort needed to accomplish this (Appendix I). The MCHS was chosen as one of the methods as it is an easy and fast administered method, and is applicable in a variety of application domains, unlike the original Cooper-Harper Scale, which is restricted to only assessing aircraft handling. Previous studies [145] have shown that it is a valid and reliable method, although it has some issues with sensitivity due to its one-dimension nature. A software version of it was developed using C/Glade/Gtk+ for even faster and easier administration.
FSWAT: Fast Subjective Workload Assessment Technique The Fast Subjective Workload Assessment Technique is a self-rated multi-dimensional method, which is a heavily modified version of the original Subjective Workload Assessment Technique [144]. They are both based on the same dimensions, namely, time demand, effort demand and stress load, which are very similar to the ones of TLX. In the preliminary pilot experiments that were conducted in this study, it was generally suggested that the original version of the method is very much complicated, particularly its weighting procedure. In fact, one of the subjects found it
3.4 Performance
78
too complicated that refused to answer. In order to make it simpler and faster the weighting procedure was dropped. Furthermore, the descriptive labels signifying the three levels of each dimension were replaced by a colouring scheme representing low-medium-high values of them. Although there is no weighting procedure anymore, the subjects were still asked to put in order the top three combinations that best reflect the level of the workload they had experienced. These top three answers are accordingly weighted with the first one having a weight of 3, the second one a weight of 2 and the final third one a weight of 1. The final score is averaged weighted values from all three pairs of the three dimensions. It was chosen to use only three as trials with five or more showed no difference, due to the relatively small contributions of the rest of the values in comparison to the top three. A software version was developed in C/Glade/Gtk+ (Appendix J) for even faster administration.
3.4
Performance
There is a great interest in identifying valid and reliable performance metrics, mainly for autonomous intelligent systems rather than for teleoperated systems [132]. The most related metric of task performance to this research is the one used in the RoboCup Rescue competition4 . It is primarily based upon the number of victims and their difficulty in being located [91]. However, there is the question of whether this metric is an accurate measurement of performance, as it fails to address issues that occur when a user has searched most of the area but failed to find an existing casualty and as a result of this he/she will have a worse performance than a user that may have searched only a tiny fraction of the area needed to be searched but was “lucky” to locate a casualty. Moreover, this metric fails to cover issues when no casualty exists in the area to be searched. In this particular study there is an additional reason that the RoboCup Rescue metric is inappropriate, this is that it 4
http://www.robocuprescue.org
3.4 Performance
79
is very easy to locate the casualties once they are seen in the camera, as they are placed in clearly visible open spaces without being hidden behind any obstacles or “camouflaged” within the environment. They also do not provide any additional visual (e.g. thermal signature) or audio cues, that would justify the use of locating a victim as a measurement element of performance. For all these reasons, it was necessary to develop a more appropriate and objective way of measuring performance based mainly on the area searched and the time taken to do so, rather than the number of located casualties and their difficulty in being identified. This metric is based on the assumption that the larger the area searched, the more likely it is to locate existing casualties, or in the case when none exists, then time can be saved as the area searched can be marked as “clear”. The details of this new proposed method for measuring performance are explained in the following section.
3.4.1
Proposed method for measuring performance
Performance is measured in all experimental sets according to searching the assigned area in the most efficient way, i.e. covering as much area as possible in the shortest amount of time, protecting the robot from potential hazards in the environment, and bringing it back safely. This is mathematically described by the Equation 3.1:
P =(
ACi × k2 + RS + EP ) × k1 t
(3.1)
where, • P :
The performance score, measured in a scale from 1–1005 . A
score above 70 is considered a very good one, and in order for a subject to achieve it he/she should have a high coverage of the area as well as getting all the bonuses of exceptional performance and of bringing the robot safely back. A score in the range 5
Actually, scores can go above 100. However, such a score is very rare, and it is usually achieved by someone who already knows exceptionally well the area and the system.
3.4 Performance
80
of 50-70 signifies a good level of performance, and it is possible to be reached by mainly having a relatively good coverage of the area, even if the robot was lost. For this, the RS reward, explained below, is responsible. A score lower than 50 signifies a poor overall performance, with the subject covering a small area and also usually failing to bring the robot safely back. • ACi :
The area covered by the subject, measured as a percentage
out of the total area that can be covered. •t:
The mission time, measured in seconds. The maximum time is
1980 seconds (33 minutes), and that is the time before the batteries are depleted to the point that the robot becomes immobilised. The maximum time was decided to be the mean time that the experimenter, who is supposed to be the best user due to the detailed knowledge of the world and of the system, needs to complete the task plus an extra one third of it. This period was found to be about 22 minutes. The one third extra was decided from some prior pilot studies, in which it was found that the subjects that successfully completed the task, with an area coverage that was close to the level of coverage by the experimenter, needed on average this extra third of time. • k2 :
A normalising constant equal to 19.8. This value is based on
the maximum time of the mission (1980 sec). A value of 1 in the term of ACi × k2 /t signifies a subject that has searched the complete area and has depleted all the available time. Values greater than 1 signify a more efficient coverage, but these are rare. In other words, this term has a unit contribution to the final score of performance. • RS :
A reward for bringing the robot safely back, set to 25%, i.e. it
has a one quarter contribution to the final score of performance. This was chosen because the metric of how much area has been covered is the main one. A bigger value was observed to significantly affect the overall results, as the subjects that lost the robot but still had a good coverage had scores that were similar with subjects
3.4 Performance
81
that had much smaller coverage but managed to somehow bring the robot safely back. Smaller values have shown to have not a sufficient impact on the scores. The subjectiveness occurring from this, could be a criticism against the claim for the objective nature of the performance measurement. However, careful consideration guarantees that this reward merely fulfils its single goal, differentiating the outstanding performances from the rest. • EP :
A reward for extensive use of robot, i.e. exceptional perfor-
mance, awarded if the percentage of the area covered is more than 80%. It is set to 25%, i.e. like RS it has an additional one quarter contribution to the final score of performance. This reward is given to resolve an issue that occurs in the term of area covered over the time taken. A subject that has spend very little time searching but moved around as much as possible in this short period, can achieve a higher score than a subject who tried to search all the area, dealing with all the complexities of it, and naturally spending more time. This reward aims to separate such subjects. Like, the RS reward, this one as well is a cause of subjectiveness in contrast to the claim for the objectivity of the measurement technique. However, here again careful consideration guarantees that the reward serves its purpose, successfully separating the appropriate groups. • k1 :
A constant used for transforming the scores in a range of 1-100
(see also the performance score above). It has the value of 66.67. This is because the initial value of the performance is up to 1.5. This works out as follows: the term ACi × k2 /t is up to 1 (actually this can go higher, and that is the reason why the overall score of performance can be more than 100), the terms RS and EP are each 0.25. As such to transform the score we have to multiply the raw value by k1 = 100/(1 + 0.25 + 0.25) = 66.67.
3.5 Experimental scenario
3.5
82
Experimental scenario
The experimental scenario consisted of a robot-assisted USAR mission in a building that has partially collapsed due to a disaster, and has been classified as “too dangerous for a human to enter”. The commander of the rescue operations has decided to deploy a robot, in order to search particular rooms and floors of the building for any likely casualties. The goals of the robot operators were to search the area assigned to them for any casualties in the most efficient way possible. Upon finding a casualty they must mark the location and if possible identify the condition of the victim. They also have to protect the robot from damage, and finally bring it safely back before the batteries get depleted.
3.6 3.6.1
Experimental resources Software and hardware
The details of the software system were presented in Chapter 2 and the research work that lead to the decision to use the Player-Gazebo software as the simulator where the experimental scenario was to be realised. It was run on a PC workstation equipped with an AMD Athlon XP 2.2GHz, 512 MB RAM and an nVidia GeForce 5200 graphics card running Fedora Linux. These resources allowed the implementation of this particular experimental scenario without any problems, however, considering the high processing demands of Gazebo a faster system, particularly a more powerful graphics card, would be necessary for more complicated tasks.
3.6.2
Virtual robot platform
The virtual robot resembles the real platform both in functionality and in look (Figure 3.5). The Gazebo model of a Pioneer 2AT robot equipped with a virtual
3.6 Experimental resources
83
(a) virtual
(b) real
Figure 3.5: Robot platform camera and a SICK LMS200 laser range finder was selected. It also had localisation capabilities since the simulator software provides the exact position and orientation of the robot, however, the absence of an error model makes it unrealistic. The robot can be controlled with a joystick, mouse or keyboard. The client controllers were implemented using Player’s C++ library, and support functions were coded in object-oriented C.
3.6.3
Real robot platform
A real robot platform (Figure 3.5b) was developed in order to be used for further research work in real world experiments. Careful consideration was given in the design and implementation of the system to address the important issue that the real robot and the virtual one (Section 3.6.2) should be as identical as possible, so that to eliminate any potential difference in the results due to the individual characterstics of the two systems. As such, it is a 4-wheel platform able to carry large payloads, e.g. a SICK LMS200 laser range finder, multiple cameras and other sensors, multiple batteries, etc. It is capable of traversing indoor as well as outdoor 2D environments, like the ones in the simulations. The detailed architecture of the system is shown in the block diagram of Figure 3.6. The robot server is an x86 architecture, more specifically a laptop. By using
3.6 Experimental resources
84
Digital sensors
Phidgets USB 8/8/8 I/O Card
R O B O T
Analogue sensors
Drive Motors
U S B
Motor Cards
Camera
Server RS232>USB Sick LMS200
i386
WiFi
Remote Client
Figure 3.6: Block diagram of the robot architecture a laptop the issue of powering the controller is resolved by the power autonomy of the laptop, which provides longer running hours. In addition, a laptop has more powerful processing capabilities than any alternative architecture (e.g. PC104), allowing full operating systems with the latest drivers and communication protocols to be run, which in turn makes easier the interfacing of the various plug-n-play robot modules. As such a plug-n-play USB camera was used for video feedback. The SICK LMS200 laser range finder was also connected into a USB port through a RS232-to-USB converter. A Phidgets IO plug-n-play USB interface card6 was used for the various analogue and digital IO needs. The card consisted of 8 digital inputs, 8 digital outputs and 8 analogue inputs. The benefits of using the Phidgets interface card are that it is well documented, supported with programming libraries and extended with various plug-n-play modules. The robot used the following extra phidget modules: voltage sensors to measure the batteries levels and a thermometer to measure the ambient temperature for detecting fire hazards. The motor con6
http://www.phidgets.com
3.6 Experimental resources
85
trollers were custom built in the School of Mechanical Engineering, University of Leeds. They are able to control 2 DC motors up to 1.5A each. Four DC motors with a planetary gearbox of 516 : 1 were used to drive the robot. According to the manufacturer’s specifications7 the motors operate on a supply voltage of 4.5 to 15V dc with 27rpm at 12V dc. Two encoders, one at one front wheel and one at the back, are used to obtain odometry data for dead-reckoning. The system is ready to be wirelessly teleoperated from a remote client station through the on-board wifi card of the laptop. The interfaces and control programs developed for the simulated scenarios (Section 3.6.4) are also reused for interacting with the real robot with minor modifications.
3.6.4
Human-robot interaction graphical user interface
A graphical user interface (GUI) was developed for the human-robot interactions (HRI), based on the GNOME Human Interface Guidelines [17] and implemented using the GTK+ toolkit and the Glade user interface designer with C bindings. The HRI GUI is shown in Figure 3.7. The main windows are: 1. The navigation centre display which is used to drive the robot with a joystick, keyboard or mouse; alter the speed and the turning rate of the robot. The power display is also integrated in the navigation centre. 2. The timer display used to keep track of the time elapsed as well as the current time. 3. The camera display proving the video feedback from the robot. 4. The laser range finder display showing the data from the laser range finder. It can be used to detect if there are any objects in a range of approximately 8 m , 180◦ in front of the robot. 7
Como Drills, part no. 942D5161
3.6 Experimental resources
86
Figure 3.7: The graphical user-robot interaction interface 5. The position display shows the accurate 2D position and orientation of the robot in a “white canvas”. It can be “upgraded” to display the actual 2D map in the background instead. In addition, the subjects were given a paper version of a drawing, showing a plan of the arena.
3.6.5
Experimental arenas
Two arenas, one used for the training of the subjects and one for the actual experimental search task, were implemented in Gazebo. Their schematic diagrams and hawk-eye views are shown in Figure 3.8 and Figure 3.9. Careful consideration was given in the selection of the two arenas as they should be able to support future real world experiments. For this reason, the training arena is simulating the foyer of the School of Mechanical Engineering, University of Leeds. This would also allow an easier training, because the subjects recruited from within the school would already
3.6 Experimental resources
87
(a) Drawing-Map
(b) Implementation in Gazebo
Figure 3.8: Training arena
(a) Drawing-Map
(b) Implementation in Gazebo
Figure 3.9: Experimental arena be familiar with it, while it would make possible to show the real arena to the rest of them. On the other hand, the experimental arena should be one that the subjects are not familiar with, in order to simulate real world conditions where the rescue teams are not familiar with the area of operation beforehand. However, it should still support future real world experiments. As such, it represents a typical floor of an office building of size of 20 × 20 m, consisting of rooms, corridors, blocked or narrow passageways and casualties. One drawback with the arenas, which is actually a drawback of the simulator
3.7 Experimental procedure
88
software, is that all the walls look visually identical to each other, as well as all the floors to each other. From one perspective, this was desirable as in a collapsed structure everything is covered with dust, camouflaged within the environment. On the other hand though, so much similarity seems unnatural. However, the physics engine, the motion of the robot and any interaction with the objects were all very much realistic. In fact, these strengths and weaknesses were also pointed out by the subjects.
3.7
Experimental procedure
Each of the experimental trials lasted between 1.5 and 2 hours. The procedure consisted of the following stages: 1. The briefing stage, during which the subject is informed of the aims of the study, the experimental task, the mission goals, the robot system, the HRI interfaces, and the methods of measurement. 2. The training stage, which lasted on average 15-20 minutes. During this the subjects had the opportunity to get some hands on experience with the system and the search mission in the training arena. 3. The experimental task stage, during which the subject performed the task on the actual experimental arena. In this stage ASAGAT-QASAGAT were applied. The actual experimental task lasted a maximum of 33 minutes with an added 15 minutes on average for the pauses, adding up to a total of about 45 minutes for the complete experimental task stage. The only piece of information that the experimenter is “allowed” to give to the subject at this stage is whenever he/she is near an exit point. This was done so, to simulate the knowledge that someone would have by listening to the robot approaching it, considering the lack of acoustic feedback. Questions regarding the interface
3.8 Experimental set
89
are answered by the experimenter, but other than these, the experimenter does not provide any further assistance to the subject. 4. The assessment stage, during which the majority of the measurement methods were applied. This stage lasted about 30 minutes. 5. A cleanup stage, during which the experimenter and the subject had an open free discussion about the system and the task.
3.8
Experimental set
The experimental set consisted of 70 subjects, out of which: 17 were USAR rescuers of the West Yorkshire Fire and Rescue Service, sta-
tioned at the Cleckheaton Fire Station; 16 were paramedics of the Greek EKAB8 , from the subranches of Ioannina and
Corfu; 37 were students and members of staff from the University of Leeds.
3.9
Summary
In the previous chapters it was discussed the necessity for a user-centric design and assessment approach of interaction interfaces based upon the critical human factors of task performance, situation awareness, telepresence and workload, where little work has been carried out in this direction in the domain of robotics. On the other hand, situation awareness has extensively been investigated in the application domains of aviation and air traffic control. Robot users, like air traffic controllers and pilots, have to form a mental picture of a dynamic situation, in 8
Ejnikä Kàntro `Ameshc Bojeiac,
diate Assistance.
freely translated in English into National Centre for Imme-
3.9 Summary
90
order to guide their actions, through a large number of information coming through their interaction displays. In aviation the term situation awareness was coined to guide pilot selection, pilot training and flightdeck interface design [178]. As such the same term is being used for similar aims within the context of human-robot interaction and robot teleoperation. The different types of measurement methods have been discussed and compared. The specific measurement methods developed in the domains of avionics and air traffic control seem to be tied to them, with the exception of the SAGAT technique and the CARS method. SAGAT has provided the main base ground for the development of the new methods of ASAGAT and QASAGAT. CARS seemed quite general, and as such new methods were necessary to fill in this gap. Lastly, PASA and SPASA are also two new methods, that are less obtrusive and applicable in real world scenarios, with the latter being faster to use than the first. Telepresence has a long research history in the areas of entertainment, psychological treatment and industrial robotics. However, there is still no clear consensus on its effect to task performance and its role within the overall spectrum of it. Investing time and money in the design of a system that supports telepresence, might prove a large waste of resources without any definite conclusions and experimental results to back them up. The few studies that have been carried out so far are encouraging, as they show that there is some kind of relation between the two. The WSPQ and SUSPQ are two of the most popular and valid measurement methods of telepresence and were adopted and processed to fit in the particular domain, particularly the latter which was renamed to MSUSPQ to differentiate it from the original version. SPATP is a new method developed by combining the WSPQ and the MSUSPQ methods that improves the time needed for the method to be used, but without losing any of the benefits of its parents methods. Reduction of the workload opposed by the system to its operator has always been a design issue in any complex system, and as such it is the one with the
3.9 Summary
91
longest research history. However, as robotics is a relatively new area, there have been very few studies within it. Moreover, as robots are capable of automating some of the subtasks, they may appear to be taking some of the workload from the user. However, new subtasks are being created, as the user has the need of being aware of these details in order to form a complete picture of the situation. In other words, the relation of workload with task performance may have become more complicated, as it is also affecting to some bigger extent now other human factors, which are also influencing performance. NASA-TLX, MCHS and SWAT are all well established measurement methods and are adopted for this study. SWAT was found to be very difficult for the subject to use and as such it has been improved and simplified, but still retaining the original ideas, leading into a new method called FSWAT. Lastly, the issue of how to measure task performance has been troubling researchers in the area of robotics from the very beginning of it. In this case here, an objective measurement of it, applicable to the task under investigation was proposed. It is primarily based on the area covered under the least amount of time. This way seems more objective than the number of found victims, used in the RoboCup Rescue competition, firstly due to the fact that a “lucky” finding of the victim will not bias the results, and secondly because all victims in this scenario have about the same difficulty in being located. Overall, there are two strong conclusions drawn from looking at the so far research studies on these human factors. Within the area of HRI and telerobotics, there is no clear consensus and little experimental investigation to study them and their effects on task performance, as well as between each other. On the other hand, although the existing theories seem to be satisfactorily explaining the human factors of situation awareness, telepresence and workload within the area of robotics, the existing measurement methods are completely inadequate, particularly in the case of situation awareness. All the methods proposed in this chapter are compared to each other on the next chapter.
Chapter 4 Method Selection and Hypotheses Validation This chapter presents the comparison and selection of the most reliable and effective methods of measuring situation awareness, telepresence and workload from the methods that have been proposed in Chapter 3. This chapter also presents the experimental validation of the hypotheses made regarding the relations between the experimental variables, those being that situation awareness and telepresence positively affect performance, while workload has a negative effect on performance.
4.1
Method selection
The methods used for the measurement of the experimental variables, those being performance, situation awareness, telepresence and workload have been presented in Chapter 3. In the case of situation awareness, telepresence and workload the proposed measurement methods are multiple; more specifically, situation awareness is measured using two concurrent methods (ASAGAT and QASAGAT) and three retrospective ones (CARS, PASA and SPASA), telepresence is measured through three retrospective methods (WSPQ, MSUSPQ and SPATP), and so is workload (TLX, FSWAT and MCHS). The majority of the proposed methods (ASAGAT,
4.1 Method selection
93
QASAGAT, PASA, SPASA, MSUSPQ, SPATP and FSWAT) are newly developed methods to meet the requirements of the robotics domain. CARS is cross-transferred and tested here in the domain of robotics for the first time. Obviously, how all these methods perform is the first issue of concern. Moreover, using such a large number of methods is impractical, particularly for real world scenarios and it it therefore necessary to have some kind of comparison and selection mechanism between them, in order to “separate the wheat from the chaff”.
4.1.1
Criteria for method selection
For the measurement of workload, Johanssen et al. [97] have suggested that multiple methods should be used to provide a better estimate of the true level of the subject’s workload. This can be extended into the other factors of situation awareness and telepresence. It can also formulate the basis of the first criterion which the methods can be compared with each other. In other words, a first criterion would be to investigate the different scores provided by the various measurement methods for a given variable. The more reliable value would be the one that finds more than one method in agreement, hence, methods that are in agreement should have a higher validity. One straightforward way in doing this is to compare the mean values from each one of them. Moreover, the experimental hypotheses, that performance is positively correlated to situation awareness and telepresence, but negatively correlated to workload, can be used as axioms, considering their apparent nature. The extent that these are supported by the measurement methods is a further comparison criterion, i.e. the methods that have a stronger positive correlation with performance have an advantage over the rest. Ideally, this would be a perfect correlation, but because this is not truly known, the first criterion, i.e. that methods with similar scores would increase their overall validity, is also taken into account here as an indication of the actual magnitude. In other words, a method that shows a higher correlation of its
4.1 Method selection
94
Table 4.1: Descriptive statistics for the measurement methods of the experimental variables (N = 30) Mean
SD
SE
Performance
0.553 0.154
0.028
ASAGAT QASAGAT CARS PASA SPASA
0.613 0.580 0.653 0.654 0.578
0.159 0.029 0.148 0.027 0.148 0.027 0.180 0.033 0.170 0.031
Mean
SD
SE
WSPQ MSUSPQ SPATP
0.512 0.578 0.581
0.113 0.021 0.138 0.025 0.097 0.018
MCHS TLX FSWAT
0.633 0.506 0.602
0.256 0.047 0.159 0.029 0.204 0.037
measured variable with performance would be preferred, unless there is a group of more than one methods with similar correlation coefficients. Although these two criteria can provide a way of selecting from the various methods used, it is important to take into account the individual characteristics of each for a more detailed and comprehensive comparison. So for example, it should also be taken into account that SPASA and SPATP are results of a number of combined influences and methods, which are also under investigation here, and although they might be more complete than their parents methods their results might also be influenced by them. For this comparative study 30 subjects were used, out of which 16 were the paramedics group and the remaining 14 were academics and students. The experimental scenario and procedure used were as described in Sections 3.5 and 3.7.
4.1.2
Comparison of the measurement methods
Table 4.1 shows the mean value (µ), the standard deviation (σ) and the standard error (SE) for each of the measurement methods used. A first observation is that all the standard errors are less than 0.05, something that suggests that these samples are likely to be accurate reflections of the corresponding populations.
4.1 Method selection
95
Looking at the mean scores of the measurement methods for situation awareness it is difficult to draw any conclusions as there seem to be two groups; the first one consists of QASAGAT (µ = 0.580, σ = 0.148) and SPASA (µ = 0.578, σ = 0.170), and the second group consists of CARS (µ = 0.653, σ = 0.148) and PASA (µ = 0.654, σ = 0.180), with ASAGAT lying between the two groups (µ = 0.613, σ = 0.159). From the measurement methods of telepresence, MSUSPQ (µ = 0.578, σ = 0.138) and SPATP (µ = 0.581, σ = 0.097) are close to each other, something that is in favour of the newly developed method of SPATP. WSPQ does also not have a big difference from the group (µ = 0.512, σ = 0.113). Lastly, from the measurement methods of workload, FSWAT (µ = 0.602, σ = 0.204) and MCHS (µ = 0.633, σ = 0.256) seem to be close to each other. Taking into account previous recommendations that a multi-dimensional measurement method might be more appropriate than a unidimensional one, due to reasons of better diagnosticity and sensitivity (Section 3.3), FSWAT is preferred at this stage. In order to investigate the extent that the methods are “in agreement” with the axioms, the magnitude of their correlation with performance was calculated. In order to decide between a parametric or non-parametric test, the normality of the data sets was tested using the Shapiro–Wilk and Anderson–Darling methods. Most of them seemed to have a normal distribution. However, the data sets from PASA (W = 0.911b ; A = 0.793b ), SPASA (W = 0.913b ; A = 0.945b ), TLX (A = 0.738b ) and MCHS (W = 0.841c ; A = 1.772c ) showed a statistical significant deviation from it. For this reason, a non-parametric correlation coefficient was preferred, and more specifically Spearman’s ρ was used. The results obtained are summarised in Table 4.2. The highest correlation between performance and situation awareness was found with the ASAGAT method (ρ = .562c ). With some difference from this, three methods came very close to each other next, these being PASA (ρ = .455c ), QASAGAT (ρ = .431c ) and SPASA (ρ = .412b ). A much smaller correlation was found for CARS (ρ = .279a ). As such,
4.1 Method selection
96
ASAGAT seems to be the method that better supports the axiom of the positive correlation between situation awareness and performance, however, as already discussed in Section 4.1.1, due to the fact that the true magnitude of the correlation is unknown, the closeness of the other three methods gives them a higher validity. From these three methods, QASAGAT and SPASA have also shown in the first criterion to have close mean values to each other and for this reason they are preferred over PASA. Additional advantages of these two methods were discussed in Section 3.1.6; SPASA offers a faster use and is more comprehensive than the rest of the retrospective methods, while from the concurrent methods, QASAGAT, unlike ASAGAT, takes also into account the confidence of the subject, which is considered to be an important element for accurately measuring situation awareness. It was also discussed in Chapter 3 the benefit gained by using a concurrent method together with a retrospective one, and this is a further reason for selecting both of them. A similar issue seems to appear with the measurement methods of telepresence, as although MSUSPQ showed a higher correlation between telepresence and performance (ρ = .436c ), WSPQ (ρ = .364b ) and SPATP (ρ = .364b ) had exactly equal correlation coefficients, something that increases their overall validity. Out of these two, SPATP is preferred because it has also demonstrated good reliability in the first criterion with the mean values and most importantly because it is aimed to be a faster, more complete and closer to the domain of telerobotics measurement method of telepresence as it was discussed in Section 3.2. Lastly, in the case of measuring workload the multi-dimensional methods of FSWAT and TLX showed a higher negative correlation with performance, with FSWAT having a stronger correlation than TLX. For this reason and because it has shown good reliability in the first criterion with the mean scores, FSWAT the preferred method for measuring workload. As such, for the rest of the experiments the following measurement methods are used:
4.2 Hypotheses testing
97
Table 4.2: Spearman ρ, one-tail correlations with performance, N = 30 ASAGAT QASAGAT CARS PASA SPASA a b c
.562c .431c .279a .455c .412b
WSPQ MSUSPQ SPATP
.364b .436c .364b
MCHS −.182 TLX −.305c FSWAT −.486c
significant at .1 significant at .05 significant at .01
QASAGAT and SPASA for the measurement of situation awareness, SPATP for the measurement of telepresence, and FSWAT for the measurement of workload.
4.2
Hypotheses testing
In the previous section, the experimental hypotheses were used as axioms due to their apparentness. Still though, it is theoretically sound that these are statistically verified. The selected methods were used over the complete data set of the 70 subjects (Section 3.8). Figure 4.1 shows the boxplots of the distributions, which allows the identification of any outlier values. These were removed prior to any further analysis, leaving a sample size of 63 subjects in total. Like before, the choice between using a parametric or non-parametric test depends on whether the datasets are normal. The Shapiro–Wilk and Anderson–Darling statistical methods were again used to investigate this. None of the sets were found to be significantly different from a normal distribution (Table 4.3), something that is also graphically verified by their normal Q-Q plots (Figure 4.2). As such, the parametric Pearson’s r correlation coefficient was used. It has to be noted that in the case of situation awareness the scores from the two methods are averaged pro-
1.0
4.2 Hypotheses testing
98
● ●
●
●
0.4
0.6
0.8
● ●
● ●
0.2
● ●
0.0
●
Perfomance
QASAGAT
SPASA
SPATP
FSWAT
Figure 4.1: Boxplots showing the outlier values viding a combined measurement. Although this might not be the best, it provides an easy and obvious way for this first verification of the experimental hypotheses. Table 4.4 summarises the results. The strongest influence to performance seems to be from situation awareness (r = .629c ). Both telepresence and workload also have a significant contribution but to less extent (r = .412c and r = −.311c respectively). Telepresence though seems to be more strongly correlated with situation awareness (r = .500c ), with workload also having an important influence (r = −.407c ). Sur-
Table 4.3: Tests of normality (df = 63)
Performance Situation awareness Telepresence Workload
Shapiro–Wilk W sig.
Anderson–Darling A sig.
0.971 0.990 0.991 0.986
0.669 0.179 0.244 0.315
.140 .898 .942 .693
.077 .915 .754 .535
99
●
● ●
●
0.9
4.2 Hypotheses testing
●
●
●
●
●
0.8
0.8
● ●
●
● ●
0.7
●
●
●●●
●● ●●● ●● ●● ●● ●●● ●● ●●● ●● ●●
●
● ●●
●
●
● ●
0.3
0.2
●
0.4
● ●
●
●●●●
●
●
●
●●● ●● ●●●
0.6
Sample Quantiles
●● ● ●●●●●
0.5
0.6 0.4
Sample Quantiles
●●
● ● ● ● ●● ● ● ●●● ●●● ●● ●●● ●● ●● ● ●● ●● ●●● ●● ● ●●● ● ● ●● ●●
●
●
−2
−1
0
1
●
2
●
−2
−1
Theoretical Quantiles
0
1
2
Theoretical Quantiles
(b) situation awareness 1.0
0.9
(a) performance ●
●
●
● ● ●
0.8
●
0.8
● ● ● ●
●● ● ●
●● ●
0.7
●●
●●●
0.6
Sample Quantiles
0.6
● ●●●●● ●● ● ●● ● ●●●●●●
●●● ● ● ●●● ● ●●●● ●● ●●●●●● ●● ●●●●
0.4
●● ● ●●●●● ●● ●●●●●●
●●●●● ●● ●
● ● ●●●
0.5
Sample Quantiles
●● ●●●●
● ● ●
●● ●●
●
0.4
●●
● ● ●●
● ●
0.2
●
●
●
●
0.0
●
●
−2
−1
0
1
2
Theoretical Quantiles
(c) telepresence
●
−2
−1
0
1
2
Theoretical Quantiles
(d) workload
Figure 4.2: Normal Q-Q plot on the data sets of the experimental variables prisingly, a small and also statistically non-significant correlation of workload was found with telepresence (r = −.141). All the results seem to verify the experimental hypotheses, those being that situation awareness and telepresence positively affect performance, while workload has a negative effect on it. Clearly, situation awareness plays an important role in achieving high levels of performance. Telepresence and workload also showed to be important influencing factors, but to less extent. However, these magnitudes may not be accurate reflections, because the results may be affected by the assumption
4.2 Hypotheses testing
100
Table 4.4: P earson r, one-tail correlations, N = 63; P: performance, SA: situation awareness, TP: telepresence, WL: workload P P SA .629c TP .412c WL −.311c c
SA .629c .500c −.407c
TP .412c .500c
WL −.311c −.407c −.141
−.141
significant at .01
that all the items in each measurement method had an equal contribution, i.e. the overall score given by each measurement method was an average of its items, something that may not necessarily be the case. It is therefore vital to further investigate and model the variables with the selected measurement methods, and this is the main focus of Chapter 5. The only previous related study by Riley [145] for de-mining robots also suffers from the same weakness. Although most of the results between the two are in agreement, there are significant differences in the ones found for the relations between situation awareness with performance and telepresence. In the first case, the magnitude of the relation between situation awareness and performance was found to be significantly higher here. The most possible reason for that is the partial measurement of situation awareness focussing only on one subgoal and neglecting all the others that exist in Riley’s work, even if this is treated as a holistic measurement. The second main difference is that here situation awareness and telepresence are strongly correlated to each other, while Riley was surprised to find that there was none. The limitation on her measurement of situation awareness may also be an underlying reason for this results. On the other hand, the correlation between situation awareness and telepresence found in this study fits well within the theoretical models of situation awareness presented in Section 3.1.2. In the case of the perception-action cycle model, high levels of telepresence, i.e. involvement, can
4.3 Summary
101
explain the process on how accurate schemata are formed and better actions that sample the environment are decided. Within Endsley’s perception-comprehensionprediction model, high levels of involvement seems to be enhancing them. Workload seems to have a very low impact on telepresence, something that implies that involvement does not require any processing resources, but could also be described as a behavioural phenomenon, in which the subject is voluntarily immersed in the task. On the other hand, the high negative impact of workload to situation awareness, implies that the processes involved for the formation and maintenance of situation awareness are the main users of the subject’s processing resources. As stated above this work has assumed that all the items and the dimensions were considered to be equally important and hence have been weighted equally. The focus of Chapter 5 is to model these parameters and investigate their true contributions.
4.3
Summary
In Chapter 3 methods for the measurement of the human factors under investigation were proposed. In the case of situation awareness, telepresence and workload there are several methods for measuring them, with some of methods having similarities between them. Therefore, it would be impractical and a “cumbersome” procedure if all of them had to be used. Furthermore, some assessment of them is needed to identify which ones perform better than others. The first comparison criterion was based on the fact that the results that are closer to each other indicate a strong reliability and accuracy on the true value of the variable, and hence, have stronger validity and sensitivity. An additional criterion was by using the hypotheses on the relations between situation awareness, telepresence and workload with performance as axioms, and investigate to what extent each method supports them. The last criterion used were the individual characteristics of each measurement method, such as whether they are multi-dimensional or not, applicability in real world scenarios,
4.3 Summary
102
time needed for using and analysing them, etc. The experimental results have shown that the best methods for measuring situation awareness are the newly developed methods of QASAGAT and SPASA. As it was discussed earlier in this chapter and in Chapter 3 these two can be complementary to each other. For the measurement of telepresence, the newly developed method of SPATP came top. Lastly, for the measurement of workload the newly developed method of FSWAT seemed to be better than the other two used. It has to be noted that in previous related work [145], the variables of situation awareness, telepresence and workload were measured by using one method for each, without much consideration of whether there were applicable or examining any alternatives. As such there is no prior comparison between the methods, and hence the comparison of the measurement methods presented here is also useful, apart from the effectiveness of the individual methods themselves. The hypotheses on the global relations between the variables may seem apparent, however, there has been little work in experimentally proving them. The results obtained here confirm these for the first time and give reassurance that the human factors are measured correctly. As such it seems that performance is positively influenced by situation awareness and telepresence, while workload seems to have a negative effect on it. Situation awareness seems to also have a strong positive correlation with telepresence. Workload was shown to indeed have a small negatively effect on situation awareness and telepresence. In Chapter 5, the selected methods are brought forward and tested on larger scale experiments with more subjects. Through modelling, the individual effects of each item and the dimensions of each variable are revealed. Also, the modelling is optimised, in an attempt to provide an accurate prediction model of performance based on the predictor variables, which could be used to assess the quality of the interaction interfaces.
Chapter 5 Relations and Modelling In Chapter 4 a comparison of various methods for the measurement of the predictor variables was carried out, which resulted in selecting the most appropriate ones. Specifically, these were QASAGAT and SPASA for the measurement of situation awareness, SPATP for the measurement of telepresence, and FSWAT for the measurement of workload. Chapter 4 also investigated the extent into which these human factors influence task performance. The results verified the hypothesised relations of the predictor variables to the response one, i.e. that situation awareness and telepresence have a positive correlation with performance, while workload has a negative correlation with performance. They were based on the assumption that all items and dimensions measuring each of these human factors had an equal contribution. This poses several limitations, firstly in predicting the task performance and also accurately assessing the interaction interface. Slater [163] has also highlighted this limitation in the measurement methods of telepresence, which can also be extended to the measurement methods of situation awareness and workload. By “finer tuning” the measurement methods and knowing the individual contributions of each item and dimension, a better understanding of which elements in the interaction interfaces assist the human user to better achieve his/her task can be gained. This in turn allows system designers to focus on the modules that matter the most.
5.1 Differences between the groups of subjects
104
1.00 Rescuers
Paramedics
Academics
0.80
0.60
0.63 0.55 0.55
0.59
0.55
0.59
0.63 0.56
0.60
0.60 0.52
0.51
0.40
0.20
0.00
P
SA
TP
WL
Figure 5.1: Overall mean scores of performance (P), situation awareness (SA), telepresence (TP) and workload (WL) for the different types of subjects
5.1
Differences between the groups of subjects
The complete dataset of the subjects consists of 17 USAR rescuers, 16 paramedics and 37 academics and fellow research students (see Section 3.8 for details). The USAR rescuers are the main end users, while the paramedics can also be considered as ones to some lesser extent. It is interesting to investigate whether there are any differences in the overall levels of performance, situation awareness, telepresence and workload between these three groups. Situation awareness is measured using the mean scores between QASAGAT and SPASA, telepresence is measured with SPATP and workload is measured with FSWAT. Figure 5.1 shows the mean scores for each of the four variables for the three different groups of subjects. The USAR rescuers on average achieved a slightly better overall performance over the paramedics and the academics. It was discussed during the trials that in real world scenarios when they have to physically search an area with low light conditions, they are trained to employ a wall-following search strategy in a clockwise
5.1 Differences between the groups of subjects
105
or anti-clockwise direction in order to minimise the danger of getting lost, while maximising the area searched. It was observed that the same search strategy was adopted with the robot search, and this might be a reason for their overall better performance. This signifies that the use of a search strategy might be another factor affecting task performance. The small improvement though shows that this is not responsible to a large extent, and that the interface and how it affects the experimental human factors of situation awareness, telepresence and workload plays a more significant role. The overall levels of situation awareness, telepresence and workload were similar for the groups of the rescuers and the academics and slightly better than those achieved by the paramedics. The use of a search strategy may have some influence on the results of the rescuers. The academics have the most experience with computer interaction interfaces and this might have been another factor of influence for their similar results to the rescuers and slightly better than the paramedics. However, the small differences between them verify once again that the interaction interfaces themselves and the human factors of situation awareness, telepresence and workload are the main influence factors on performance, rather than the use of a search strategy or the level of familiarisation of the subjects with computer interaction interfaces. Overall the following conclusions can be drawn from these results. Other factors, such as the use of a search strategy or some kind of familiarisation with robot and computer interaction interfaces, have some minor impact on all experimental variables. However, it is the interaction interfaces themselves and the human factors of situation awareness, telepresence and workload that are the main influence variables on performance. The small differences in the overall levels of performance, situation awareness, telepresence and workload between the three groups indicate that there are no substantial differences between the end users and those that are not. This means that it is possible to assess the interaction systems and the human factors by mixing different types of users, or even without actual end users.
5.2 Linear modelling: Multiple linear regression
5.2
106
Linear modelling: Multiple linear regression
The correlation results from Chapter 4 indicate that some form of linear relation exists between the predictors (situation awareness, telepresence and workload) and the response variable (performance). A linear model (Equation 5.1) is usually preferred for reasons of simplicity and clarification [34, pp 325]. As such a linear model is examined first with the assistance of the R statistics software [177].
y = β0 + β1 × x1 + β2 × x2 + · · · + βn × xn
(5.1)
A necessary step, before any further analysis is carried out, is to transform the data into a common form. A common scale between 0 and 1 was used for all the scores. In the case of situation awareness, where two different methods were used, the scores from each were combined together into one vector containing the average scores of each corresponding item from the SPASA method, as described in Section 3.1.6. The mapping of the items are shown in Table 5.1. A further reduction in this case was forced from the experimental scenario. Considering that the only hazards existing in the experimental environment were the various obstacles encountered, Item 3 is dropped as it is already covered by Item 2. In fact the two of them are the only ones that are extremely highly correlated to each other ρ = .83c , something that “forbids” both of them to be used in a linear regression model as it is further discussed later in this section. The sample size consisted of 70 subjects (Section 3.8). Prior to any analysis it is necessary to remove any outlier values that would affect the results. These are easily identified by plotting the boxplots of the variables as it was previously done so in Section 4.2. However, the predictor variables of situation awareness, telepresence and workload have been broken down into their individual items and as such it is no longer possible to identify any outlier values from them, leaving only the response variable of performance as the only one able to provide the outlier cases. Figure 4.1
5.2 Linear modelling: Multiple linear regression
107
Table 5.1: Mapping of the QASAGAT items to the SPASA ones QASAGAT 1, 2, 16 4, 5 4, 5 8–10, 12, 17 6, 7 13–15
SPASA 7 8 9 10 11
1.0
SPASA 1 2 3 4 5 6
QASAGAT 9, 11, 18 4–7, 18 2, 4, 7, 9–11, 16 1, 4, 5, 8, 12
●
0.0
0.2
0.4
0.6
0.8
●
Perfomance
Figure 5.2: Boxplot showing the outlier values of performance shows the boxplot of the distribution of performance, which indicates that there are two outliers. These were removed prior to any further analysis, leaving a sample size of 68 subjects in total.
5.2.1
Results and discussion
One of the primary aims is to investigate the individual effect that each item and dimension of every predictor variable has to the response variable being estimated.
5.2 Linear modelling: Multiple linear regression
108
For this reason, at this stage, less importance is given to whether the contribution of each item is statistically significant, but more attention is given to the actual magnitude of the effect that each item has on performance. Interaction terms are also excluded from the full model. Although, this might not be the best approach, it is done so because the emphasis is on the individual effect of each to performance rather than in between them. A further reason is given futher along the section. A reduced model with less inputs has the benefit of being simpler while having the nearly the same accuracy as a full model. As such, a minimal model is also produced by using stepwise regression with the Akaike Information Criterion [33]. This is compared to the full model. However, considering that there is no previous work on the effects of situation awareness, telepresence and workload on performance, more emphasis is given to the full model, because it explains in detail the effect of every contributor.
Full model The individual items from each variable are used as the predictors. This is so for two main reasons. Firstly, if the dimensions (mission awareness, spatial awareness, time awareness, etc.) were used then the items would have to be averaged with the result of losing their specific information details. Moreover, some items are commonly used in more than one dimension, which means that there will be high levels of multi-collinearity between them. This, in turn, has a negative effect on the model. On the other hand, by using the individual items not only specific details can be revealed, but also the items can be used as “representatives” of their corresponding dimensions. As such, there are 10 terms from situation awareness representing the 10 items of SPASA (see Appendix D), excluding Item 3; 12 from telepresence representing the 12 items of SPATP (see Appendix G); and 3 from workload representing the 3 dimensions of FSWAT (see Appendix J). The coefficients of the linear regression
5.2 Linear modelling: Multiple linear regression
109
Table 5.2: Multiple linear regression coefficients (β), in bold are the ones with an absolute value greater than 0.1 and in italics if they are less than 0.05
x SA.Q1 SA.Q2 SA.Q3 SA.Q4 SA.Q5 SA.Q6 SA.Q7 SA.Q8 SA.Q9 SA.Q10 SA.Q11
Coef (β) SE 0.20 0.17 0.07 0.15 n/a 0.10 0.15 0.05 0.15 0.13 0.04 0.09 0.01 0.19
0.22 0.10 0.11 0.24 0.22 0.20 0.11
x TP.Q1 TP.Q2 TP.Q3 TP.Q4 TP.Q5 TP.Q6 TP.Q7 TP.Q8 TP.Q9 TP.Q10 TP.Q11 TP.Q12
Coef (β) 0.09 0.01 0.00 0.06 0.08 0.06 0.00 0.03 0.05 0.04 0.20 0.01
SE 0.17 0.11 0.13 0.12
x WL.Time WL.Effort WL.Stress
0.15 0.07 0.10 0.10 0.10 0.08 0.12 0.09
Intercept (β0)
Coef (β) 0.02 0.02 0.10
SE 0.07 0.08 0.08
0.04 0.17
model are shown in Table 5.2. The ones with an absolute value greater than 0.1 are emphasised in bold, while the ones that are less than 0.05 are in italics. It is quite clear from these results the strong influence that situation awareness seems to have to performance. In particular, there seems to be a strong influence from the dimension of spatial awareness, as Item 1 is associated with localisation. Individual aspects of situation awareness might be important, however, Item 11 seems to indicate that it really affects performance when it is considered as a whole. This seems to agree with Endsley [47, 50]’s views that situation awareness is meaningful only as a whole structure. Moreover, it seems that performance is directly associated with mission awareness and prediction of the outcome of the initiated actions (Level 3), as indicated by Items 7 and 9. It was surprising to find that time awareness aspects have a negative impact to performance (Item 4). An explanation might be provided if we also look at Item 10 from telepresence, which is concerned with whether the subjects’ involvement with the task leads into loss of track of the real time that it lasted. It was found that approximately 75% of the subjects did
5.2 Linear modelling: Multiple linear regression
110
not really lose track of time. This implies that the “internal” clock was responsible for mainly tracking time, while constant observations of the time displays caused more of a distraction than actually being helpful. As such it might be the case that subjects that were not paying so much attention into time issues adopted a more “aggressive” approach into searching, resulting into covering more ground. Finally, a marginal significant positive effect seemed to come from Item 9 concerned mainly with the dimension of mission awareness and the relation of the comprehension of the data (Level 2) with the prediction of future events (Level 3). This means that even inexperienced and unfamiliar users of robot systems, can make good decisions provided that the data provided by the interaction interfaces, assist them into interpreting them into accurate information. Also, mission awareness seemed to have a positive effect in terms of safety of the robot from hazards, as Item 2 concerned with it also achieved a marginal large positive effect to performance. This means that the robot system and in particular the interaction interfaces associated with the safety of the robot from hazards and obstacles play an important role in good performance. Telepresence seemed to have a minimal effect on performance. The main items of the involvement and control dimension, such as Items 2, 7, 10 and 12 were found to have no significant effect, something that was surprising. However, the Items 2, 10 and 12, are measuring involvement in terms of “departure from the real world and arrival into the remote/virtual one”, based on the views by Kim and Biocca [105]; Slater et al. [166]; Usoh et al. [192]. In other words, they are mainly measuring the immersion of the subject into the task. Based on these three items, 68% of the subjets reported that they still had sensation of the events happening in the real world around them, with just about 3% really reporting that they were fully immersed into the task. It was discussed in Chapter 3 that unlike entertainment tasks, robot teleoperation involvement might be a significantly different aspect from immersion and not so important. The results here, seem to verify these views. The
5.2 Linear modelling: Multiple linear regression
111
only item of telepresence that had a significant positive effect on performance, was Item 11 concerned with whether the subjects learnt new techniques that would help them have a better performance next time. This item reflects the involvement of the subject into the task, and not his/her immersion, in terms of learning. It also highlights the issue of experience. Although, it is obvious that performance should improve with experience of the subject, it should not be included as a factor at this stage, if the aim is to develop an objective assessment of the interaction interface, independent as much as possible of subjective characteristics of the subjects. Lastly, it was found that the only dimension of workload that has some negative effect on performance was stress rather than time demand or effort. This is a bit surprising as a simulated task can never cause the stress that would exist in a real world scenario. However, about 25% of the subjects experienced more than moderate levels of stress with 10% reporting high levels. Although, in a real world scenario it would be expected that this would be much higher, still these levels are quite high. They can be interpreted as stress they had for still performing well in the task, but without getting into extremely high levels for most of them, due to the fact that failure to do so, would not have any critical consequences. It is possible then that this might have influenced the other two dimensions, as in a real world case the effort and time demands might have been much higher as poor performance could cost a human life.
Minimal model In the beginning of the section it was mentioned that the emphasis was on the magnitude of the terms, than on their actual statistical significance which would yield a minimal model. Here, a minimal model is produced in order to see how well this compares with the full one. A straightforward and accurate method of dropping terms that seem to have less impact is obtained using stepwise regression with the Akaike Information Criterion [33]. The produced model is shown in Table 5.3.
5.2 Linear modelling: Multiple linear regression
112
Table 5.3: Multiple linear regression minimal model using stepwise method with the Akaike Information Criterion
Coef (β) Std. Error t value Pr(>|t|) x Intercept (β0) 0.1 0.07 1.43 0.16 SA.Q1 0.19 0.09 2.21 0.03 b SA.Q6 0.13 0.07 1.85 0.07 a SA.Q7 0.13 0.07 1.77 0.08 a SA.Q11 0.2 0.06 3.18 0c TP.Q11 0.17 0.07 2.4 0.02 b WL.Stress 0.09 0.05 1.71 0.09 c a significant at .1 b significant at .05 c significant at .01
The first thing to be noticed is that the terms existing in this minimal model are pretty much the strong ones from the full model. Both models seem to explain the same variance of the response variable, this is R2 = 0.6 for the full model and R2 = 0.572 for the minimal model. Even if both models seem to have a significant fit of the data overall, the latter seems to have a better ability in predicting performance as F = 13.57c , while F = 2.516c for the full one. It also seems that the minimal model is able to generalise better than the full one as the difference of its adjusted R2 value (0.530) from the value of R2 is smaller than it is in the case of the latter (adjusted R2 = 0.361). However, to fully understand their accuracy and their generalisation extent a number of other factors should be examined. These are presented in Section 5.2.2.
5.2.2
Model assessment and limitations
In order to assess the accuracy of the model Field [53, pp 162] asks the following questions: how well does the model fit the data?
5.2 Linear modelling: Multiple linear regression
113
to what extent is it influenced by a small number of cases? to what extent can the model generalise to other samples?
Starting from the last criterion, the type and number of the subjects are important factors affecting the generalisation of the model. In contrast to previous studies [145; 158], on this one different types of subjects were used, with nearly half of them being the actual potential end users. However, the results presented in Section 5.1 showed that the use of end users has no significant impact. According to Crawley [33] approximately no more than n/3 parameters should be estimated on a multiple regression. This turned the other way around means that for k number of parameters the minimum size of the sample should be approximately 3 × k. In the case of the 25 parameters used here, this size is approximately 75, which is very close to the 68 actually used. Moreover, it now makes more sense why the interaction terms, where in the case of 25 parameters these are 300, were excluded from the model as nearly 1,000 trials would be necessary. In addition to the type of the subjects and the sample size, it is important that a number of assumptions are satisfied for the model to be unbiased. In other words, this means that the model obtained from the sample size is more likely to approximate the model that would be obtained if the complete population was available. A list of these assumptions is presented in Field [53, pp 169] cross-citing Berry [18]. The first of these is concerned with the variable types. More specifically, the response variables should be measured in a continuous scale and all the measurements should be independent to each other. Also, the predictors should be quantitative and measured at least on an interval scale. Performance, the response variable here, satisfies these assumptions as it is measured on a continuous scale and the values are independent as they come from different subjects. The predictors, situation awareness, telepresence and workload also satisfy their assumptions. The items of workload are measured on a continuous scale and so do some of the items of situation awareness due to QASAGAT. The rest of the items of situation awareness as well
5.2 Linear modelling: Multiple linear regression
114
as the ones of telepresence are measured on an interval scale. The only issue is that the response variable should be covering the complete measurement scale, and here performance is slightly bounded as the minimum value obtained was 0.2. Two further assumptions that should be satisfied are that the predictors should have some variation in value and there should be no perfect multi-collinearity between them. Both assumptions are satisfied here as all of the predictors had a variance greater than 0. Moreover, none of them was found to have an extremely high correlation coefficient1 , with the exception of Items 2 and 3, out of which the latter was removed, as discussed in the beginning of the section. This is further verified as the variance inflation factors in both the full and the minimal model were much less than 10. Two more assumptions on the list are that the errors should be independent and normally distributed. In the full model the value of the Durbin-Watson test was 2.01, while in the minimal model this is 2.03, something that in both cases shows that the errors are independent. On the other hand the assumption of normally distributed errors is not satisfied, as the values from the Shapiro-Wilk and Anderson-Darling tests were W = 0.96b , A = 1.08c for the full model, and W = 0.96b , A = 1.07c for the minimal one. This deviation from a normal distribution is a sign of concern, however, it could be claimed that overall the models seem unbiased and are quite likely to be able to generalise beyond the sample size. The next question is to what extent the models are influenced by individual cases. In other words, if a few cases are found to have a high influence then the model is not very representative of the complete dataset. R has a built in function for providing influential diagnostics2 , including DFBETAS for each variable of the model, DFFITS, covariance ratios, Cook’s distances and the diagonal terms of the hat matrix. It also marks the cases that are influential with respect to any of these measures. As such 17 cases seemed to have a higher influence for the full model. 1
Both Pearson and Spearman correlation coefficients were calculated. Cut − of f point = .8 [53, pp 174] 2 For further details please refer to the manual pages of R for the function influence.measures
5.2 Linear modelling: Multiple linear regression
115
This number is quite large (25% of the total cases), and as such it could be claimed that the model is drawn from the overall set. On the other hand, the same cannot be claimed for the minimal model as it was found that only 6 cases (9%) seemed to be highly influential. So far, it has been shown that overall the two models are unbiased. However, generalising a model that does not provide a good fit of the observed data is undesirable. The first thing to look at is their degree of fit through the values of their coefficient of determination (R2 ), which measures the proportion that the predictor variables account for the variance of the response variable. These are .6 and .57 for the full and the minimal models respectively. Although both of them are quite high indicating that the models are good fits of the data, they are far from being a perfect fit. A deeper understanding of the actual fit of the models can be obtained by examining their residuals, i.e. what is the “behaviour” of the wrongly fitted values. The root mean square error (RMSE) for both the full and the minimal models is 0.11 (σ = 0.02). These numbers show that the two models are relatively good fits of the data, but not perfect. A more accurate understanding is gained by examining the number of outliers based on the Stundentized residuals that have an absolute value greater than 1.96. These are 7 for the full model and 4 for the minimal one, i.e. 10% and 6% respectively of the total number of cases. These percentages are quite high and provide strong evidences that the model is a poor representation of the actual data. Recalling from before that the residuals of both models are not normally distributed, and as such this may not be an accurate reflection of the error prediction of the model. By looking back at the unstandarised residuals that have a significant difference of 0.1 units a better picture can be obtained. These are 22 cases for the full model and 24 cases for the minimal one. In other words, the two models fit with a high error 32% and 35% of the total cases. These are even higher and they give clear and serious indications of unsatisfactory fit of the linear models.
5.3 Non-linear modelling: Neural networks
(a) full model
116
(b) minimal model
Figure 5.3: Scatterplots of the actual values of performance with the fitted ones from the two models The scatterplots between the actual values of performance with the fitted ones from the two models, shown in Figure 5.3, provide an easy way of visualising this. A perfect fit would be represented by the blue dotted lines. It is obvious from these plots the large deviations of the points from this line and their scatter, clearly illustrating their poor fit. One possible reason for that is the omission of the interaction factors. However, as already explained, a maximal model was not feasible due to the demand of an impractical sample size, but most importantly because we are interested in analysing the individual effects of each predictor. As such, the non-optimal fit of the linear models suggests that a non-linear model should be examined.
5.3
Non-linear modelling: Neural networks
The linear modelling analysis carried out so far has shown strong elements that there is a non-linear relation between the predictor variables (situation awareness, telepresence and workload) with the response variable (performance). Traditional linear models are inadequate when it comes to modelling data that contains nonlinear characteristics. One of the most popular techniques of non-linear modelling
5.3 Non-linear modelling: Neural networks
117
is that of artificial neural networks (ANN). Although the theory behind them is still unclear to some large extent, they are very reliable and successful in nonlinear problems. A more complicated alternative would be non-linear regression. However,the large number of involved factors and the lack of any previous work makes it very difficult to “guess” the non-linear kernels. Their main advantage is that they are able to represent both linear and nonlinear relationships, learnt directly from the data being modelled. They have the remarkable ability to derive meaning from complicated or imprecise data, and they can be used to extract patterns and detect trends that are too complex to be noticed by either humans or other computer techniques. A further benefit is that neural networks are adaptive, in the sense that they are capable of continuing to learn during their operation or as new data is collected. Moreover, unlike conventional techniques ANNs are not limited by strict assumptions of normality, linearity, variable independence, etc. Neural networks altough seem to be like the holy grails of non-linear modelling, they come “wrapped up in black boxes” which are difficult to “open”. This metaphor means that the equations and coefficients defining the relationship are difficult or impossible to extract. The final product is the trained neural network itself, governed by its internal rules of operation. Despite this limitation, ANNs seem to be the most suitable technique for nonlinear modelling in this study, because they can capture many kinds of relationships and relatively easily model phenomena, which otherwise may have been very difficult or impossible to explain otherwise due to their dynamic and complexity, such as the case here. The artificial neural network selected to be used is a feed-forward multilayer neural network trained with the backpropagation algorithm. This type of ANN is commonly and successfully employed in problems of function approximation and prediction [15; 78; 112]. The logistic sigmoid function was chosen as the transfer
5.3 Non-linear modelling: Neural networks
118
function over the hyperbolic tangent that might lead in faster training, because the size of the data is not large enough to cause any concerns on the training time. Moreover, the logistic sigmoid function is already in the same range as the output, unlike the hyperbolic function that would require an additional step of linearly transforming the data. More details are presented in the following sections.
5.3.1
Data preparation
The first stage in the development of any artificial neural network (ANN) is the preparation of the data to be used. Every neural network textbook [7; 112; 170] provides a set of guidelines, commonly listing as the main issues of the type of the data, the removal of outlier values that can have an effect on the model, and the encoding of the data into a format that can be processed by the neural network. In this study the data are measured at a ratio scale (performance data) or at an interval one (situation awareness, telepresence and workload data). This means that a single neuron can be used to represent each input and output [112]. The removal of outliers is usually based on statistical methods [112; 170], i.e. a case is an outlier when it deviates for more than two standard deviations from the mean value of a normally distributed data set. In a boxplot, the points that are more than 1.5 times the interquantile range below the first or above the third quantile are plotted as individual outliers. The distance of “1.5 times the interquantile range” is roughly more than two standard deviations [34]. This kind of analysis and removal of the outliers was carried out during the linear modelling. This filtered dataset, consisting of 68 cases, is used. Another important step is to transform the output data into a scale that the output squashing function can produce. The performance data are already in a range of 0 to 1, which is required by the logistic function. It is a common practice that the input data are also on the same range. In the linear modelling the datasets were already linearly transformed into this range, allowing them to be reused in the
5.3 Non-linear modelling: Neural networks
119
neural network modelling.
Training and validation sets Several empirical guidelines have been proposed on what should be the ratio of the partitioning of the dataset into training and validation subsets. Swingler [170] suggests a split of 80% of the data to be used as the training set and the remaining 20% for validation. Similarly, Nelson and Illingworth [135] suggest that the training subset should be between 60-70% of the total data, while the remaining 20-30% should consist the validation one. In the case that a testing subset is needed, Looney [110] suggests that 65% of the data should be used for training, 25% for validation and 10% as “new” data used for aftermath testing. Based on these assumptions it was decided to use 75% (51 patterns) of the data for the training subset, considering that the largest portion should go for adequate training, and the remaining 25% (17 patterns) to be used as the validation subset. There seems to be no need for a separate testing subset, as the validation provides sufficient testing and results on the generalisation capabilities of the neural networks. Some other issues of concern are the extent of the noise in the complete dataset, as well as how this is distributed between the training and the validation sets. The implications of these issues and analysis of their results are discussed in detail in Section 5.3.3.
5.3.2
The architecture of the neural network
The next stage in the development of an ANN model is to determine its structure. Every neural network consists at its minimal level of an input and an output layer of known length, because the number of their nodes are specified by the problem requirements. What remains is the number of hidden layers and their lengths. On the first issue, Hecht-Nielsen [78] proved that one hidden layer is sufficient to approximate any target function. Masters [112] further suggested that this is true
5.3 Non-linear modelling: Neural networks
120
provided that the target function consists of a finite collection of points, it is continuous and it is defined on a compact, i.e. finite domain. All these three assumptions are satisfied for the current dataset as both the inputs and the outputs are defined on finite interval, i.e. continuous, scales. As such, the only remaining issue is determining the number of nodes in the hidden layer. The main problem faced here is a small number of nodes may not be able to fit complicated patterns, thus resulting in large training errors. The opposite, if a large number of hidden nodes exists then the neural network will overfit the data and the included noise in it, resulting into very poor prediction capabilities into new unseen cases. As Swingler [170] states, this is an issue of optimising the trade-off between accuracy and generalisation. A number of guidelines, aiming to set some boundaries on the number of hidden nodes, have been suggested in the literature based on the number of input and output units, size of the dataset, and finally the problem of non-linearity [15]. As such, Hecht-Neilsen [77] suggested that there should not be more than 2i + 1 hidden units, where i is the number of input units. This means, that in this case the number of hidden units should not exceed 51. Swingler [170] using the theories of Upadhyaya and Eryurek [182] suggests that a p number of patterns of k number of elements (this is typically the input-output patterns) can be loaded into a maximum of k log2 p hidden units. As such, in this case the maximum number of hidden units is 147, for 25 inputs, 1 output and 51 training patterns. Masters [112], on the other hand suggested that the topology of a neural network should follow a pyramidlike structure, with the number of hidden nodes for a one hidden layer network √ to be equal to i × o, where i and o are the numbers of input and output units respectively. Based on this an “ideal” length of the hidden layer in this case would be 5. An obvious observation from all these guidelines is that they yield very much different results. In fact, it is widely agreed that there is no single and correct
5.3 Non-linear modelling: Neural networks
121
SA Items
SA
TP Items
TP
WL Items
WL
P
Figure 5.4: Diagram of the conceptual neural network model answer, but rather the task of identifying an “optimum” length for the hidden layer is best achieved by trial-and-error [15; 76; 112; 170]. Swingler [170] offers a useful suggestion that it is simpler to decide whether the network should fan-in or out, i.e. the number of hidden units would be less or more than the input ones. He notes that when the role of the hidden layer is to extract features from the inputs in order to generalise or reduce the dimensionality of the data set, then a fan-in network is required. In this particular study a theoretical or conceptual neural network could be developed with the hidden layer representing the three high level predictor variables. The connections from the inputs would then not only reflect the measurement of their corresponding variable, but also their influence in the other ones, something that seemed to be impossible in the linear model. A graphical illustration of such a network is given in Figure 5.4. This is only a conceptual neural network and the actual investigation to determine the optimum length of the hidden layer is a necessity to find the optimum one. A set of candidate networks can be formulated based on the suggestions of Masters [112] and Swingler [170]. It was found out that for a pyramid-like neural network the length of the hidden layer is 5. For a more comprehensive study, neural networks with 9 and 13 hidden units are also examined. The upper limit of 13 nodes comes from the fact that it is approximately half of the number of input units, without making the total number of nodes exceed the number of training patterns. Such a
5.3 Non-linear modelling: Neural networks
122
thing would lead into over-parametrisation of the network, i.e. into a look-up table, hence, reducing its generalisation capability [170]. This assumption is open and can be refined if a suitable network is not found within this set of candidates.
5.3.3
Revisiting the issue of noise in the dataset
Before proceeding to investigate the optimal structure for the neural network model, the issue of noise in the data set has to be looked at closely. In Section 5.3.1, which presented the data preparation process, it was shown how the outlier cases of performance were removed from it. Although such a technique is simple and effective, and for this it is recommended in a number of neural network textbooks [112; 170], it has the limitation that it deals with noise in a uni-dimensional manner. A complete case, i.e. a pattern of an inputs-outputs pair, can also consist an outlier. Detecting such noisy cases in a two-dimensional or even three-dimensional space is an easy task, as a simple scatter plot can reveal them. This gets extremely difficult when the dimensions of the space increase, as two-dimensional scatter plots are no longer possible to produce. This is next to impossible when there are 26 dimensions as it is the case here. However, such removal might not be necessary due to the high tolerance of neural networks to noise, provided that they are not over-parametrised or over-trained. The remaining problems are to what extent the dataset is still noisy, and how the noise is distributed between the training and the validation sets. The first issue will have an impact on the quality of the results, as if the data are mostly noise then this means that they are completely random and there is no function to be learnt, i.e. “garbage in, garbage out”. The latter issue is concerned with the bias of the results as a result of an unequal distribution of the noise into the two sets. In order to investigate these two issues 10 pairs of training and validation sets were randomly generated and tested on a neural network with three hidden nodes. Although this network is not proven to be the best solution, the small length of its
5.3 Non-linear modelling: Neural networks
123
hidden layer should allow an acceptable generalisation to be achieved. The main goal here is to investigate whether there are relatively low training and validation errors on all 10 pairs, something that would indicate that a significant amount of noise is not present in the dataset. In addition, the more uniform these errors are, i.e. there is no big difference between them, the smaller the chances are that a particular set of training and validation datasets would bias the results. The errors of each pair were the mean values of five successful training sessions. The vanilla back-propagation algorithm [149] was used for the training of the ANN, with a small learning rate of η = 0.1, and a maximum non-propagated error of dmax = 0. The patterns are presented in a random order, so that to minimise the bias of a possible first noisy pattern, which could lead the learning into the wrong direction [15]. The weights were initialised into random values between −0.3 and 0.3 [11]. It was found that the mean values of the root mean square of the training and validation errors were 0.033 (SE = 0.001, σ = 0.002) and 0.185 (SE = 0.009, σ = 0.027) respectively. These values as well as their difference are low enough to indicate that the data does not suffer from large amounts of noise. Moreover, the very low values of the standard deviations show that the errors from all the sample pairs of training-validation sets are very similar. This means that the selection of a particular pair of training-validation set should not have any bias effects on the model.
5.3.4
Determining the length of the hidden layer
The most common training algorithm used for function approximations is that of backpropagation [15; 78; 112]. The algorithm is explained in many texts that describe neural networks (e.g. [77; 125; 147; 207]). In brief backpropagation works in small iterative steps. At each step the inputs are fed-forward into the neural network, which produces an output. This output is compared to the actual output. The error of the predicted value from the true one is propagated back to the nodes,
5.3 Non-linear modelling: Neural networks
124
which adjust their weights accordingly so that to minimise this error. JavaNNS3 implements the standard backpropagation algorithm as introduced by Rumelhart and Mcclelland [149]. This version is also called online backpropagation because the weights are updated just after presenting an individual pattern. This is in contrast to batch backpropagation, in which the weights are updated after the complete set of training patterns has been presented. Basheer and Hajmeer [15] note that online backpropagation may get stuck in a first bad pattern, which can lead the learning into the wrong direction. On the other hand, batch backpropagation does not suffer from such a limitation. However, the results from the noise investigation, presented previously, showed that this is unlikely to cause any concern. Moreover, the training set is shuffled at every learning cycle to further minimise this risk. The setup parameters are as follows. The activation (transfer) function of the hidden and output nodes is the logistic sigmoid function
4
[s(y) =
1 ], 1+e−y
as it
is the most appropriate for multi-layer, feed-forward, backpropagation neural networks [15; 207]. The weights are randomly initialised in the range of [−0.3, 0.3]. The typical topological order was selected for the update of the weights. In the learning parameters for the backpropagation, the maximum non-propagated error (dmax ) was set to 0, because the RMS training error we want to achieve should be lower than the one achieved from the linear modelling, this being 0.11. The “shuffle” option was selected so that the patterns are presented in a random order at each step. The update step was set to 1, while the number of cycles/epochs dependent on the learning rate (η). The pruning settings were left to their default values. By looking at the validation and training errors as well as the number of steps it is possible to compare the performances of the neural networks over different learning rates and decide which one is more appropriate. The errors are calculated 3
A bug in JavaNNS Version 1.1 (based on SNNS 4.2 kernel) regarding the incorrect calculation of the mean square training errors was found and taken into account for all the results presented in the thesis. 4 Also known as the standard logistic function.
5.3 Non-linear modelling: Neural networks
125
1 e2 n∑ Validation error
Training error Learning cycles (a) Good trial
1 e2 n∑
Validation error
Training error Learning cycles (b) Noisy trial
Figure 5.5: Example neural network training sessions before overfitting of the data occurs, as shown in Figure 5.5a. Convergence errors are also helpful, as they reveal the effect of overfitting, as well as cases of being trapped in local minima. All errors are reported as the mean square errors (MSE), P 2 equal to n1 ei . Moreover, the results presented are the mean values of the best 5 trials over
5.3 Non-linear modelling: Neural networks
126
6 “good” ones. A “good” trial is the one in which the convergence error is not extremely high, something that would indicate that the neural network has been correctly trained, e.g. Figure 5.5a. On the other hand a wrong direction of training, called here as “noisy trial” (NT), is the one that the validation error grows in large scales out of control, e.g. Figure 5.5b. Tables 5.4 – 5.7 summarise the results. Before proceeding into their analysis, a note that should be made is that the values presented are scaled in the range of [0, 1] from an initial range of [0.000511, 0.039847]. This was done to make them clearer and easier to compare. A first observation is that all training errors are very similar to each other to allow any comparisons to be made based on them. At the same time though, this means that all networks are able to fit the training data. Most importantly, in their unscaled values all errors are lower than the one obtained for the linear model, something that signifies the improved performance of the non-linear model. A more detailed comparison between the two follows later in the final model. By firstly looking at Table 5.4 where the results of the neural network with 3 hidden nodes are presented, it can be said that the best results were obtained when η = 0.5, as the validation error was the lowest while the convergence validation error was also relatively low. Moreover, with so high learning rate the training is the shortest. A serious problem is the high number of unsuccessful training sessions. Taking into account that 6 good sessions were required, this approximately works out as just one good session for every four. This makes the training process very unreliable and time consuming. Similar results to these were obtained for η = 0.4. For the rest of the learning rates the results were relatively good and similar to each other. The best convergence validation error was achieved when η = 0.05, however, this also suffers from unreliability issues. The best balance for a network with 3 hidden nodes seems to be achieved when η = 0.1, although it has to be noted that the convergence error for this was one of the highest.
5.3 Non-linear modelling: Neural networks
Table 5.4: Transformed errors of neural network with 3 hidden nodes for different values of learning rate (η) (NT: noisy trials) Mean STD Min Max NT Validation 0.01 0.68 0.09 0.54 0.75 6 0.05 0.68 0.08 0.59 0.82 11 0.1 0.68 0.04 0.61 0.72 2 0.2 0.72 0.11 0.57 0.83 3 0.3 0.75 0.03 0.71 0.79 4 0.4 0.68 0.05 0.61 0.75 8 0.5 0.66 0.10 0.53 0.77 15 Convergence 0.01 0.81 0.12 0.70 0.95 0.05 0.69 0.14 0.57 0.88 0.1 0.81 0.12 0.70 0.95 0.2 0.80 0.14 0.66 1.00 0.3 0.74 0.14 0.56 0.95 0.4 0.80 0.12 0.64 0.92 0.5 0.76 0.10 0.62 0.85 Training 0.01 0.01 0.00 0.01 0.01 0.05 0.01 0.00 0.01 0.01 0.1 0.01 0.00 0.01 0.02 0.2 0.01 0.00 0.01 0.01 0.3 0.01 0.00 0.01 0.02 0.4 0.01 0.00 0.01 0.01 0.5 0.01 0.00 0.01 0.01 Steps 0.01 69200 7294 60000 80000 0.05 15200 837 14000 16000 0.1 6600 418 6000 7000 0.2 3900 894 3000 5000 0.3 3040 472 2400 3500 0.4 2200 505 1600 2900 0.5 2000 596 1600 3000
η
127
Table 5.5: Transformed errors of neural network with 5 hidden nodes for different values of learning rate (η) (NT: noisy trials) Mean STD Min Max NT Validation 0.01 0.64 0.08 0.52 0.72 0.05 0.59 0.03 0.55 0.62 6 0.1 0.63 0.07 0.56 0.75 2 0.2 0.63 0.09 0.51 0.73 3 0.3 0.65 0.07 0.59 0.74 14 0.4 0.62 0.06 0.55 0.69 10 0.5 0.61 0.06 0.52 0.68 6 Convergence 0.01 0.70 0.06 0.63 0.77 0.05 0.72 0.09 0.59 0.84 0.1 0.68 0.08 0.56 0.75 0.2 0.70 0.07 0.59 0.76 0.3 0.68 0.04 0.62 0.74 0.4 0.72 0.14 0.56 0.89 0.5 0.72 0.09 0.63 0.83 Training 0.01 0.01 0.00 0.00 0.01 0.05 0.01 0.00 0.00 0.01 0.1 0.01 0.00 0.01 0.01 0.2 0.01 0.00 0.01 0.01 0.3 0.01 0.00 0.01 0.01 0.4 0.01 0.00 0.01 0.01 0.5 0.01 0.00 0.00 0.01 Steps 0.01 59400 7797 50000 70000 0.05 12000 612 11000 12500 0.1 5800 274 5500 6000 0.2 3100 224 3000 3500 0.3 2380 303 2100 2800 0.4 1760 152 1600 1900 0.5 1500 302 1100 1900
η
When the number of hidden nodes is increased into 5, the results (Table 5.5) are overall better than before, both in terms of error values as well as in the number of steps. A further observation is that they are all very close to each other. As such, intermediate values of learning rate should be preferred as they offer a better speed over the lower ones, and are more reliable than the higher ones.
5.3 Non-linear modelling: Neural networks
Table 5.6: Transformed errors of neural network with 9 hidden nodes for different values of learning rate (η) (NT: noisy trials) Mean STD Min Max NT Validation 0.01 0.56 0.05 0.53 0.65 1 0.05 0.61 0.06 0.53 0.68 0.1 0.55 0.04 0.52 0.59 0.2 0.61 0.06 0.53 0.68 1 0.3 0.61 0.06 0.52 0.66 1 0.4 0.58 0.08 0.49 0.70 1 0.5 0.62 0.06 0.54 0.70 Convergence 0.01 0.69 0.12 0.50 0.80 0.05 0.76 0.13 0.58 0.91 0.1 0.60 0.05 0.55 0.66 0.2 0.69 0.05 0.63 0.76 0.3 0.63 0.12 0.48 0.81 0.4 0.66 0.11 0.57 0.83 0.5 0.66 0.08 0.57 0.77 Training 0.01 0.01 0.00 0.00 0.01 0.05 0.01 0.00 0.00 0.01 0.1 0.00 0.00 0.00 0.01 0.2 0.01 0.00 0.01 0.01 0.3 0.01 0.00 0.01 0.01 0.4 0.01 0.00 0.00 0.01 0.5 0.01 0.00 0.00 0.01 Steps 0.01 65400 4615 60000 71000 0.05 11380 646 10500 12300 0.1 5940 559 5100 6500 0.2 3180 327 2700 3500 0.3 2200 122 2000 2300 0.4 1640 204 1500 2000 0.5 1450 200 1150 1700
η
128
Table 5.7: Transformed errors of neural network with 13 hidden nodes for different values of learning rate (η) (NT: noisy trials) Mean STD Min Max NT Validation 0.01 0.55 0.09 0.42 0.64 0.05 0.63 0.02 0.59 0.65 1 0.1 0.58 0.06 0.49 0.66 0.2 0.57 0.04 0.54 0.63 0.3 0.57 0.02 0.54 0.59 0.4 0.57 0.05 0.51 0.63 0.5 0.54 0.03 0.50 0.57 Convergence 0.01 0.58 0.13 0.41 0.70 0.05 0.78 0.06 0.70 0.85 0.1 0.68 0.09 0.53 0.78 0.2 0.59 0.05 0.55 0.65 0.3 0.60 0.05 0.52 0.64 0.4 0.57 0.07 0.50 0.66 0.5 0.63 0.08 0.54 0.76 Training 0.01 0.00 0.00 0.00 0.01 0.05 0.01 0.00 0.01 0.01 0.1 0.01 0.00 0.00 0.01 0.2 0.00 0.00 0.00 0.01 0.3 0.01 0.00 0.00 0.01 0.4 0.01 0.00 0.00 0.01 0.5 0.01 0.00 0.00 0.01 Steps 0.01 61200 7328 54000 72000 0.05 11400 1077 10000 12800 0.1 6540 808 5400 7500 0.2 3100 100 3000 3200 0.3 2140 207 1900 2400 0.4 1700 177 1550 2000 0.5 1420 168 1250 1600
η
A further improvement in the results comes when the number of hidden nodes is increased into 9 (Table 5.6). In particular, this neural network eliminates any unreliability issues for all learning rates it was tested. Most of the results are very similar to each other. The one that stands out is when η = 0.1. This has the lowest and most steady validation error (0.55, σ = 0.04), convergence validation
5.3 Non-linear modelling: Neural networks Situation Awareness
129 Telepresence
Workload
Performance
Figure 5.6: Diagram of the final neural network model error (0.60, σ = 0.05) and training error (0.00, σ = 0.0), while it is also quite fast (5940, σ = 559). In the case of 13 hidden nodes (Table 5.7), a small improvement is observed for the results with intermediate and high learning rates (η ≥ 0.2), but these seem to be similar or worse for lower rates. Moreover, like the neural network with 9 hidden nodes, this one is highly reliable. In this case, slightly better results seem to be obtained when η = 0.2. However, these are very close to the best case in the neural network with a hidden layer of 9 nodes, when the learning rate was 0.1. Following the principle of parsimony and Occam’s razor [112; 170], i.e. simpler solutions are preferred over more complex ones when both are equally good, the neural network with 9 hidden nodes is preferred over the one with a hidden layer of 13 nodes. This is further exploited in the following section to obtain the optimal non-linear modelling solution.
5.3.5
Final model
The neural network with a hidden layer of 9 nodes (Figure 5.6) and trained with a backpropagation algorithm with a learning rate η = 0.1 was chosen, after the experimental analysis presented in Section 5.3.4, as the best candidate for the optimal non-linear modelling solution. The same settings and data set were used.
5.3 Non-linear modelling: Neural networks
130
The neural network was repeatedly trained until a sufficiently good solution was found. That is a solution that is better than the average one obtained previously in the experiments for determining the length of the hidden layer, and also close to the minimum values. The mean square training errors of the best five solutions were very much similar to each other (µ(M SE) = 0.001, σ = 0.000) to allow any comparisons to be made. However, these results are significantly lower (RM SE = 0.03) than the error obtained from the linear model (RM SE = 0.11). The mean value of the MSE in the validation set for the top five solutions was 0.022 (σ = 0.001). This is an indication that the global minimum solution should lie around this range. Convergence was guaranteed at about 20,000 epochs, with a mean square training error less than 10−4 , and a mean of the mean square validation errors of 0.024 (σ = 0.001). The best solution was found to have a RMS training error of 0.026 and a RMS validation error of 0.145 at 6,000 learning cycles, and a RMS convergence error of 0.152 (Figure 5.7). The weights of the neural network model are presented in Appendix K. From the training error it seems that the non-linear model outperforms the linear model previously analysed in Section 5.2, which had an RMS error of 0.011. It was previously necessary to develop the linear model on the complete dataset so that to understand in some respect the relations between the variables from the full dataset. However, in order to compare the two models in a more complete manner, the linear model has to be tested under the same conditions as the non-linear one, i.e. on the same dataset. As such a new linear model fitted on this same dataset yielded a RMS “training” error of 0.090, which is not very different from the one on the complete dataset, and a prediction error of 0.182. As such, it can certainly be concluded that the non-linear model fits the data better. Moreover, from this it can also be said with confidence that that there seems be a non-linear relation between the input and output variables. The supremacy of the non-linear model over the linear one is clearly seen in
5.3 Non-linear modelling: Neural networks
131
1 ∑ e2 n
Validation error 6,000 cycles Training error Learning cycles
Figure 5.7: Graph of the training and the validation mean square errors of the final neural network model Figure 5.8. The non-linear model, particularly when convergence occurs, forms a nearly perfect straight line, accurately predicting the outputs. This is not the case in the linear model, where the line is well segmented and the data points are quite scattered. Although the non-linear model outperformed the linear one, it is still important, as it can be used to identify and interpret the relations between the variables. Neural networks, particularly multilayer ones, are criticised of being “black boxes” when it comes to extracting the non-linear relations and functions that dictate its operation. It would be tempting to interpret the weights of the input units to formulate the rules, however, this is meaningless for multilayered networks as they are lost within the non-linear processes of the hidden layer. Some methods for extracting the rules from a trained neural network have been devised. They are all based on decision trees and symbolic artificial intelligence, i.e. the production of case-based reasoning or fuzzy logic “if [condition(s) are true] then [do as follows] else [do otherwise]” rules. Andrews et al. [8] cross-citing Craven and Shavlik [32] distinguish between three main types of rules extraction methods, with the first two named pedagogical and
5.3 Non-linear modelling: Neural networks
1.00 0.90
Predicted
0.80 0.70 0.60
132
Predicted (ANN – early training) Predicted (ANN – convergence) Predicted (Linear)
0.50 0.40 0.30 0.20 0.10 0.10
0.20
0.30
0.40
0.50
0.60
0.70
0.80
0.90
1.00
Output
Figure 5.8: Plot of the actual data with the fitted ones from the linear and the non-linear models de-compositional, while the third one being a hybrid of these two. The pedagogical category includes these methods that aim to extract the operational rules of the neural network from the input and the output layers, without taking into account the hidden layer or the connection weights of the network. It is obvious though that such algorithms (e.g. ANN-DT [153]) produce rules which are linear in nature, similar to the ones produced by the linear regression model, and because of this they have been severely criticised [159]. The second category, that of de-compositional methods, aims to extract rules at the level of individual hidden and output units. Andrews et al. [8] note that a basic requirement for this is that the output of each hidden and output unit must already be or be mapped into a binary output, which corresponds to the notion of a rule. It is clear that this might not be possible in some cases, and even further it constitutes an undesirable limitation when the interpretation has only meaning at an interval scale rather than at a binary one. This is the case in the current study. Other suggested methods have used rate of changes [170] and how the network behaves in the absence of one or more of its inputs [159]. This might be easy when the dimension space is relatively small. On a 26 dimensional space like here, any such method is very timely, costly and difficult
5.4 Summary
133
to use. On top of that, although the non-linear model clearly outperformed the linear one, the linear model has still produced good results which are not very far from the non-linear. The bottom line is that the non-linear model may have produced excellent results in terms of prediction, however, when it comes in trying to identify the rules governing its operation, it is a “black box”. On the other hand the linear regression model developed and discussed in this chapter seems to provide an easy alternative into investigating these. Its performance is not far from the non-linear model, making the explanations of the relations between the variables valid. As such, both the linear and the non-linear models have their place into the overall framework, with the first one being used for identifying the relations of the variables in an easy and cost effective manner, and the latter one for predicting the output variable from the inputs with higher precision.
5.4
Summary
The methods selected in Chapter 4 have been used in wider experiments with more subjects in order to investigate the relations between the variables themselves and to produce an accurate prediction model of performance. The subjects consisted of three groups: 17 USAR rescuers, 16 paramedics and 37 academics and fellow research students. The USAR rescuers are the main end users, while the paramedics can also be considered as ones to some lesser extent. A comparison between the overall scores of performance, situation awareness, telepresence and workload between the three groups showed small differences in these values that can be explained by individual characteristics of each group, specifically the use of a search strategy by the rescuers due to their training and the better familiarisation of the academics with general computer interaction interfaces. However, the small magnitude of these differences indicated that the interaction interfaces themselves
5.4 Summary
134
and the human factors of situation awareness, telepresence and workload are the main influence variables of performance. This further means that it is possible to assess the interaction systems and the human factors by mixing different types of users, or even without actual end users. A linear model based on multiple linear regression was developed. The results showed that situation awareness plays an important role in the task performance, with telepresence and workload also having some influence to it, but to a lesser extent. Some dimensions seemed to have a greater influence than others, such as spatial and mission awareness. Accurately predicting future states and the outcome of the initiated actions (Level 3) was also proven to be playing an important role. Although it is helpful to identify the individual dimensions that play an important role, so that system designers will know where to focus their efforts, the results also revealed that situation awareness is a global structure and the remaining dimensions should not be left aside. This last conclusion seems to be in agreement with previous theoretical work [47; 50]. Telepresence and workload seemed to also be playing a smaller role on performance. It is possible that the non-realistic conditions would have affected the results of the latter, as it is impossible to simulate certain factors, such as high stress, fatigue, interaction with other personnel, etc., expected in a real world rescue operation. An important finding regarding performance was that, in teleoperated systems in critical domains it is more meaningful to treat the level of involvement, i.e. the allocation of processing resources for achieving the task, rather than its initial definition of “departure from the local environment and departure into the remote/virtual one”. By no means this implies complete rejection of the original interpretation of performance as departure from the local world and arrival on the remote, rather it suggests that in the context of robotics more emphasis should be given on its representation of the subject’s involvement with the task. These views are futher strengthened by the strong correlation that was found between situation awareness and telepresence. A minimal linear regression model was also produced.
5.4 Summary
135
The “dominant” variables in it were the same ones that showed a stronger influence in the full one. As such, a minimal model may be equally good as the full one, however, it has the limitation that detailed information regarding the rest of the variables are lost. Overall, all these findings are important as they signify specific elements which system designers should focus their efforts on for improved results. On the other hand though, in terms of predicting the level of performance, the linear model seemed to be unable to perfectly explain the data, showing evidences of non-linearity. As such, a non-linear model was developed based on feed-forward multilayer artificial neural networks using random pattern-by-pattern backpropagation as the training algorithm. Experiments were conducted to identify the best parameters in the neural network model. The non-linear model outperformed the linear one and as such it can be used as a reliable and accurate prediction of performance and as an assessment tool for the evaluation of human-robot interaction interfaces. However, the difficulty in extracting the rules of its operation dictate that a linear model is still necessary in order to “approximately” identify the relations between the variables.
Chapter 6 Conclusions This thesis investigated human factors issues in the design and development of effective human-robot interfaces for emerging applications of teleoperated, cooperative mobile robot systems in situations such as urban search and rescue. It is conjectured that the performances of the human-robot collaborations is strongly dependent on the abilities of the user interfaces to provide effective support on the user’s situation awareness and realistic telepresence of the remote site of the working robot as well as ensuring the mental workload of the human partner does not become excessive. The thesis adopted a user-centric approach to support the human operator as this is widely accepted as the best way of realising increased levels of collaboration between humans and robotic systems, working in a partnership towards a common goal. Traditional methods of designing human-robot interaction interfaces have failed to produce effective results as witnessed in the post September 11 search operations. The research focused on these issues by producing theoretical and experimental studies which to date have been lacking so that the fundamental issue of quantifying and measuring these human factors no longer remains open. The measurement of the various human-factors that need to be studied is integral to the success of the resulting conclusions of the research carried out. For this, measuring overall system performance, situation awareness, telepresence and workload
137
for the human-robot scenarios, considered in reliable ways, is essential. Because of this, these aspects are thoroughly investigated in the research work presented here; the literature review showed that these issues have not been explored within the realms of the robotic community in any significant way and considerable progress and positive results have not been achieved. The measurement of these subjective human-factor variables is addressed by mainly looking to the flight traffic control domain where researchers have developed many methods of determining how to quantify the quality of the situation awareness, level of workload and level of telepresence of the people in the aircrafts and on the ground (Chapter 3). Based on these methods, this research proposed five methods (ASAGAT, QASAGAT, CARS, PASA and SPASA) of measuring situation awareness (Section 3.1.6), three methods (WSPQ, MSUSPQ and SPATP) of measuring telepresence (Section 3.2.5), and three methods (NASA-TLX, MCHS and FSWAT) of measuring workload (Section 3.3.4). In more detail, PASA and SPASA are completely novel retrospective methods of measuring situation awareness developed in this thesis to address the requirements of the domain of robotics. CARS, is another retrospective measurement method of situation awareness developed by McGuinness [117], which was for the first time tested in the domain of robotics in this research. ASAGAT and QASAGAT are two new concurrent measurement methods of situation awareness specifically developed for the domain of robotics, which were inspired by the ideas and methodologies of SAGAT [45] and QUASA [116]. From the measurement methods of telepresence, WSPQ has been developed by Witmer and Singer [205] and has also been previously used in the domain of robotics. MSUSPQ is the same method as SUSPQ developed by Usoh et al. [192], however, it has a different name here to address the difference in the way that the overall scores of telepresence were calculated in this thesis. It was also the first time that this method was applied in the domain of robotics. SPATP is a result of appropriately combining WSPQ and SUSPQ, in order to gain
138
the benefits of both methods. From the measurement methods of workload, NASATLX [74] and MCHS [199] are methods that have been previously used in the domain of robotics. However, in the case of NASA-TLX, these previous studies have failed to exclude a dimension of it that is not applicable in these particular tasks, an issue that was taken care of in this thesis. FSWAT was the result of making significant improvements over the SWAT [144] measurement method, to the point that it can be claimed that it consists a new different method of measuring workload. More details for each one of the proposed measurement methods have been presented in the corresponding sections of Chapter 3. A comparison between them has shown that QASAGAT and SPASA are the most reliable and accurate for measuring situation awareness, SPATP for measuring telepresence and FSWAT for measuring workload (Section 4.1). For the measurement of performance a new objective method has been developed, which does not depend on ratings from neither the subjects nor the experimenters. It is based on the amount of area that has been searched and the protection of the robot from any hazards. These two factors have been considered more appropriate for measuring performance in this particular scenario than the metrics used in the RoboCup Rescue competition. The reasons are that in this scenario it was not difficult to identify a casualty once it was visible to the user, as well as this metric deals with situations where there is no casualty present (Section 3.4). An urban search and rescue scenario has been developed both within a simulation environment and via an actual mobile robot platform in order that various conjectures and situations could be studied. The simulation studies involved extensive investigations to determine the various software tools and platforms that are available. This was performed with the assistance of the EC funded Network of Excellence on Climbing and Walking Robots (CLAWAR). About 150 software tools were identified that can be used to perform some aspects of the research and assist in the development of robotic systems. From this extensive list, five software solu-
139
tions were assessed to be the most suitable for investigating robot assisted urban search and rescue tasks. After the detailed comparison of these five, the software of Player-Gazebo came top and was selected for the research to realise the experimental search scenario (Chapter 2). A physical 4-wheel drive mobile teleoperated urban search and rescue robot system built for the experimental studies comprised a video feedback, a laser range finder, sensors for monitoring the batteries levels, sensors for monitoring the ambient temperature for detecting fire hazards and a pair of encoders for obtaining odometry data that can be used for dead-reckoning localisation purposes. The system has been completely realised and is ready to be used for future real world trials (Section 3.6.3). Using the Player-Gazebo environment an urban search and rescue experimental environment was developed (Section 3.6.5) to test various hypotheses in the design and development of user-centric human-robot interfaces. The simulation environment scenario comprised a collapsed building that needed to be searched for casualties (Section 3.5). A graphical user interface (comprising vision, laser data, map, robot locations, etc.) and controls to steer and drive the robot within the building to search for the casualties was developed (Section 3.6.4). The test subjects comprised urban search and rescue professionals from West Yorkshire Fire and Rescue Service and the Greek Centre for Immediate Assistance as well as researchers and academics from University of Leeds (Section 3.8). Every experimental trial with each subject lasted between 1.5 and 2 hours. It consisted of five stages (Section 3.7). The first stage the subject was informed about the research, the tools and how the rest of the experiment would be run. In the second stage the subject had a training session with the system in a training arena. The third stage was the actual experimental search task, during which the concurrent measurement methods (ASAGAT and QASAGAT) were applied. After the end of the task, the fourth stage, the retrospective measurement methods were applied. In the last fifth stage the experimenter and the subject had an open discussion about the experiment and the system as well as
140
ways of improving them. Various test trials were carried out to test and validate the following “obvious” hypotheses made: Performance is positively correlated with situation awareness Performance is positively correlated with telepresence Performance is negatively correlated with workload
Although these assumptions appear rather obvious, testing and validating the claims is a complex task as the details of how each variable can be reliably measured is unclear and major research has been needed to develop these new quantifiable measurement techniques. Extensive analysis of the data obtained from the search trials has been conducted and is presented in the thesis to show the robustness and reliability of the measurement techniques proposed here. The most reliable measurement methods have been further studied to validate the claims. The results show that situation awareness and telepresence positively affect performance, while workload has a negative effect on it. It was also found that there is a positive correlation between situation awareness and telepresence, while workload has a negative effect on both. This validates the assumptions made (Section 4.2). A multiple linear regression model was developed to further understand the individual contributions of each human factor to performance (Section 5.2). The limited prediction capabilities of the linear model suggested a non-linear relationship. For this reason, a non-linear model using a multi-layer feed-forward artificial neural network trained with the backpropagation algorithm was developed. The neural network was able to predict the response variables more precisely and was able to generalise well enough into unseen cases (Section 5.3).
6.1 Summary of contributions
6.1
141
Summary of contributions
A set of objectives and contributions were specified in Chapter 1. The extent these were achieved and evaluated in this thesis is assessed. Identification of appropriate software tools that can be used for the realisation
of experimental USAR scenarios. A large scale research was conducted with the support from the EC funded CLAWAR Network of Excellence, which identified more than 150 software tools that can help in the design and development of robotic systems. These were grouped into eight categories. Eleven comparison criteria were proposed and used for identifying a suitable simulator that would allow the realisation of robot USAR experiments. It was found that the robotic suite of PlayerGazebo is a good choice for this case study and the details of this are presented in Chapter 2. They have also been disseminated back to the CLAWAR community [136], published in Gatsoulis et al. [66, 67] and are also under preparation for journal publications. Investigation of whether the lessons learnt in other domains where these human
factors have been studied can benefit the robotics research. The theories and measurement methods for each of the four main experimental variables, those being performance, situation awareness, telepresence and workload, were reviewed. It was found that despite the fact that some theoretical ideas can be cross-transferred, the assessment methods are domain specific and inappropriate to be re-used easily in the domain of robotics, particularly in the case of situation awareness. New methods had to be developed and validated. The review of these theories and methods is presented in Chapter 3, and also published in Gatsoulis and Virk [64]; Gatsoulis et al. [68]. Design and development of new methods for measuring the experimental vari-
6.1 Summary of contributions
142
ables. A number of novel measurement methods were designed and developed for the measurement of performance, situation awareness, telepresence and workload in Chapter 3, based on the literature review presented in the same chapter, and a conducted task analysis revealing the individual requirements of it. A comparison between them was conducted in Chapter 4, and the “fittest” ones were used in wider scale experiments in Chapter 5. Parts of this work have been published in Gatsoulis and Virk [65]; Gatsoulis et al. [68] and are also under preparation for journal publications. Investigation of the relations between the experimental variables, and devel-
opment of a prediction model of performance based on them. A multiple linear regression model was developed in Chapter 5, which provided an insight into the detailed relations between the experimental variables. However, the model seemed to be inadequate in terms of prediction accuracy and showed evidences of non-linearity within the data. A non-linear model using a multilayered feed-forward neural network trained using a pattern-by-pattern backpropagation algorithm was developed in the same chapter. The non-linear model proved to have a good accuracy in predicting the fitted data, with also good generalisation capabilities, which were also better than those of the linear model. The difficulty and the linear approaches in decomposing the rules of its operation though, make the presence of a linear model necessary due to interpretation reasons. Parts of this work have been published in Gatsoulis et al. [69] and are also under preparation for journal publications. A complete list of publications is presented in Appendix L.
6.2 Further research work
6.2
143
Further research work
Areas and directions for further research work were identified after the completion of the project. First of all, there is a potential benefit from experiments with real robots in either training or real-world scenarios, as they may reveal a deeper insight on their dynamic relations, because variables such as workload are expected to be influenced even higher. The real robotic platform that was developed in this research is able to provide the tools for this area of future research. Further testing on more than one interaction interfaces is another area of future work. Although the amount of experiments conducted in this study is much bigger than any previous one, they all focused on one particular developed interaction interface. It would be interesting to see what results will be obtained by applying the framework in alternative interfaces, as well as using it as a comparison tool. This could have the form of an in-between groups study in which one of the interfaces is supposed to be exceeding the competitor interface in one or more of the dimensions that were identified as critical factors for effective performance. The linear model explained in detail the dynamic relations of the variables under investigation (performance, situation awareness, telepresence and workload). The non-linear model proved to be an accurate prediction tool of performance from the “input” variables (situation awareness, telepresence and workload). Both of them are necessary, as the linear model failed to accurately predict the outcome variable, while the non-linear model is incapable of explaining its internal mechanisms, and hence provide explanations of the relations between the variables. However, with these results in mind alternative modelling techniques, e.g. non-linear regression, can be investigated in the future that would both explain and predict the variables. An alternative approach would be to use some kind of dimension reduction techniques. In order to do so though, appropriate data from more types of interaction interfaces is needed for a wider investigation, and as such this work ties nicely with the previous suggestion for future work, i.e. experiments with different interaction interfaces.
6.2 Further research work
144
For the first time in such type of study potential end users, the USAR task force and the paramedics unit, were involved. One of the important lessons learnt was that there are other potential variables affecting the outcome and the income variables, such as experience with computer interaction interfaces and knowledge of rescue procedures and familiarisation with disaster environments. However, the influence of these factors was found to be minimal, indicating that the interaction interfaces themselves and the human factors of situation awareness, telepresence and workload are the main influence variables of performance. This further means that it is possible to assess the interaction systems and the human factors by mixing different types of users, or even without actual end users. All the above are immediate areas of future work. Good situation awareness proved to be an invaluable factor for effective task performance. Its investigation and modelling has identified some of its dimensions that seem to be more influential, and in some certain extent it manages to unlock the secrets of human cognition in forming and maintaining a mental picture of the situation and how this leads into good decision making. A possible large scale extension for this project is to serve as a starting point for the investigation of the development of intelligent and adaptive robot systems, biologically inspired by the results and the conclusions on the study of the human partner’s cognition that have been presented in this thesis. These long term research goals further emphasise the value of this work. The immediate benefit though lies on providing explanations and tools for the assessment and prediction of human-robot interaction interfaces with the user’s requirements and operational processes in mind. These will soon become even more important as there is an increase on robot systems that work together with humans. The work and the conclusions from this research will hopefully lead into successful collaborations between humans and robots.
References [1] J. A. Adams. Critical considerations for human-robot interface development. In 2002 AAAI Fall Symposium on Human-Robot Interaction, 2002. [2] M. J. Adams, Y. T. Tenney, and R. W. Pew. State of the art report: strategic workload and the cognitive management of advanced multi-task systems. Technical Report CSERIAC 91-6, Wright-Paterson Air Force Base, OH: Crew System Ergonomics Information Analysis Center, 1991. [3] M. J. Adams, Y. T. Tenney, and R. W. Pew. Situation awareness and the cognitive management of complex systems. Human Factors, 37(1):85–104, 1995. [4] D. L. Akin, M. L. Minsky, E. D. Thiel, and C. R. Kurtzman. Space applications of automation, robotics and machine intelligence systems, (ARAMIS) phase II. Technical Report Vol.3: Executive Summary, MIT, NASA Marshall Space Flight Centre, 1983. Contract NASA 8-34381. [5] D. Alexander. Same errors recur, despite quake lessons learnt. http:// www.alertnet.org/thefacts/reliefresources/alexanderview.htm, June 2003. [6] J. Allen. Natural Language Understanding. Benjamin Cummings, 2nd edition edition, 1995. [7] J. A. Anderson. An Introduction to Neural Networks. The MIT Press, 1995.
REFERENCES
146
[8] R. Andrews, J. Diederich, and A. B. Tickle. Survey and critique of techniques for extracting rules from trained artificial neural networks. Knowledge-Based Systems, 8(6):373–389, 1995. [9] ANSI/RIA. Industrial Robots and Robot Systems - Safety Requirements. American National Standards Insitute - Robotics Industries Association, 1999. ANSI/RIA R15.06-1999. [10] Apple. Introduction to Apple human inteface guidelines. http://developer. apple.com, 2006. [11] ASCE. Artificial neural networks in hydrology. I: Preliminary concepts. Journal of Hydrologic Engineering, 5(2):115–123, 2000. [12] I. Asimov. The Rest of the Robots. Collins, 1994. [13] J. Banks. Selecting simulation software. In Simulation Conference Proceedings, pages 15–20. IEEE, 1991. [14] W. Barfield and S. Weghorst. The sense of presence within virtual environments: A conceptual framework. In Proc. of the Fifth Intl. Conference on Human–Computer Interaction (HCI Intl.’93), Vol. 2: Software and Hardware Interfaces, Orlando, FL, 1993. [15] I. A. Basheer and M. Hajmeer. Artificial neural networks: fundamentals, computing, design, and application. Journal of Microbiological Methods, 43: 3–31, 2000. [16] H. H. Bell and D. R. Lyon. Using observer ratings to assess situation awareness. In M. R. Endsley and D. J. Garland, editors, Situation Awareness Analysis and Measurement. Lawrence Erlbaum Associates, 2000. [17] C. Benson, A. Elman, S. Nickell, and C. Z. Robertson. GNOME human inteface guidelines 2.0. http://developer.gnome.org, 2004.
REFERENCES
147
[18] W.D. Berry. Understanding regression assumptions. SAGE University paper series on quantitative applications in the social sciences, 1993. [19] M. R. Blackburn, H. R. Everett, and R. T. Laird. After action report to the joint program office: Center for the Robotic Assisted Search and Rescue (CRASAR) related efforts at the World Trade Center. Technical Report 3141, US Navy, SPAWAR Systems Center San Diego, 2002. [20] B. J. Brickman, L. J. Hettinger, M. M. Roe, D. K. Stautberg, M. A. Vidulich, M. W. Haas, and R. L. Shaw. An assessment of situation awareness in an air combat simulation: The Global Implicit Measurement approach. In D. J. Garland and M. R. Endsley, editors, Experimental Analysis and Measurement of Situation Awareness: Proceedings of an International Conference, pages 339– 344, Daytona Beach, FL, USA, 1995. Embry-Riddle Aeronautical University Press. [21] J. L. Burke and R. R. Murphy. Situation awareness and task performance in robot-assisted technical search: Bujold goes to Bridgeport, 2005. [22] J. L. Burke, R. R. Murphy, M. Coovert, and D. Riddle. Moonlight in Miami: A field study of human-robot interaction in the context of an urban search and rescue disaster response training exercise. Human–Computer Interaction, special issue on Human–Robot Interaction, 19(1–2):85–116, 2004. [23] J. L. Burke, R. R. Murphy, E. Rogers, V. J. Lumelsky, and J. Scholtz. Final report for the DARPA/NSF interdisciplinary study on human-robot interaction. IEEE Transactions on Systems, Man and Cybernetics, 34(2), 2004. [24] K. E. Bystrom, W. Barfield, and C. Hendrix. A conceptual model of the sense of presence in virtual environments. Presence: Teleoperators and Virtual Environments, 8(2):241–244, 1999.
REFERENCES
148
[25] J. Casper. Human-robot interactions during the robot-assisted urban search and rescue response at the World Trade Center. Master’s thesis, Department of Computer Science and Engineering, University of South Florida, 2002. [26] J. Casper and R. Murphy. Human-robot interactions during the robot-assisted urban search and rescue response at the World Trade Center. IEEE Transactions on Systems, Man, and Cybernetics–Part B: Cybernetics, 33(3):367–285, 2003. [27] J. Casper, R. R. Murphy, and M. Micire. Issues in intelligent robots for search and rescue. In SPIE Ground Vehicle Technology II, Orlando, FL, USA, 2000. [28] R. Clarke. Asimov’s laws of robotics: Implications for information technology; part 1. Computer, 26(12):53–61, 1993. [29] R. Clarke. Asimov’s laws of robotics: Implications for information technology; part 2. Computer, 27(1):57–66, 1994. [30] G. E. Cooper and R. P. Harper. The use of pilot rating in the evaluation of aircraft handling qualities. Technical Report 567, AGARD, London, 1969. [31] S. Cote and S. Bouchard. Documenting the efcacy of virtual reality exposure with psychophysiological and information processing measures. Applied Psychophysiology and Biofeedback, 30(3), 2005. [32] M. W. Craven and J. W. Shavlik. Using sampling and queries to extract rules from trained neural networks. In Proc. of the 11th International Conference on Machine Learning, San Francisco, USA, 1994. [33] M.J. Crawley. Statistics: an introduction using R. John Wiley and Sons Ltd, 2005. [34] M.J. Crawley. The R Book. John Wiley and Sons Ltd, 2007.
REFERENCES
149
[35] A. Davids. Urban search and rescue robots: from tragedy to technology. IEEE Intelligent Systems, 17(2):81–83, 2002. [36] L. Davis and G. Williams. Evaluating and selecting simulation software using the analytic hierarchy process. Integrated Manufacturing Systems, 5(1):23–32, 1994. [37] C. D. B. Deighton. Towards the development of an integrated human factors and engineering evaluation methodology for rotorcraft D/NAW System. Technical Report DERA/AS/FMC/CR97629/1.0, QinetiQ, Farnborough, QinetiQ Ltd., 1997. [38] K. Dennehy. Cranfield Situation Awareness Scale: User’s manual. Technical Report COA report No. 9702, Applied Psychology Unit, College of Aeronautics, Cranfield University, 1997. [39] C. Dominguez. Can SA be defined? In M. Vidulich, C. Dominguez, E. Vogel, and G. Mcmillan, editors, Situation Awareness: Papers and Annotated Bibliography. Interim Report No. AL/CF-TR-1994-0085, pages 5–15. 1994. [40] J. V. Draper and L. M. Blair. Workload, flow, and telepresence during teleoperation. In Robotics and Automation, 1996. Proceedings., 1996 IEEE International Conference on, volume 2, pages 1030–1035 vol.2, 1996. [41] J. V. Draper, D. B. Kaber, and J. M. Usher. Telepresence. Human Factors: The Journal of the Human Factors and Ergonomics Society, 40(3):354–375, 1998. [42] F. T. Durso, C. A. Hackworth, T. R. Truitt, J. Crutchfield, D. Nikolic, and C. A. Manning. Situation awareness as a predictor of performance for en route air traffic controllers. Air Traffic Control Quarterly, 6(1):1–20, 1998.
REFERENCES
150
[43] D. S. Eccles. Building simulators for aerospace applications: processes, techniques, choices and pitfalls. In Aerospace Conference Proceedings, volume 1, pages 517–527. IEEE, 2000. [44] M. R. Endsley. Design and evaluation for situation awareness enhancement. In Proc. of the Human Factors Society 32nd Annual Meeting, pages 97–101, Santa Monica, CA, U.S.A., 1988. [45] M. R. Endsley. Situation Awareness Global Assessment Technique (SAGAT). In Proc. of the IEEE National Aerospace and Electronics Conference (NAECON), pages 789–795, 1988. [46] M. R. Endsley. A methodology for the objective measurement of situation awareness. In Situational Awareness in Aerospace Operations (AGARD-CP478), Neuilly Sur Seine, France: NATO–AGARD, 1990. [47] M. R. Endsley. Measurement of situation awareness in dynamic systems. Human Factors, 37(1):65–84, 1995. [48] M. R. Endsley. Toward a theory for situation awareness in dynamic systems. Human Factors, 37(1):32–64, 1995. [49] M. R. Endsley. Direct measurement of situation awareness:validity and use of SAGAT. In M. R. Endsley and D. J. Garland, editors, Situation Awareness Analysis and Measurement. Lawrence Erlbaum Associates, Mahwah, NJ, USA, 2000. [50] M. R. Endsley. Theoretical underpinnings of situation awareness: a critical review. In M. R. Endsley and D. J. Garland, editors, Situation Awareness Analysis and Measurement. Lawrence Erlbaum Associates, Mahwah, NJ, USA, 2000.
REFERENCES
151
[51] M. R. Endsley. Situation Awareness in Dynamic Human Decision Making: Theory and Measurement. PhD thesis, University of Southern California, 1990. [52] I. C. Envarli and J. A. Adams. Task lists for human-multiple robot interaction. In Robot and Human Interactive Communication, 2005. ROMAN 2005. IEEE International Workshop on, pages 119–124. IEEE, 2005. [53] A. Field. Discovering statistics using SPSS. SAGE Publications Ltd, 2nd edition, 2005. [54] A. Fink and J. Kosecoff. How to conduct surveys: a step by step guide. Sage Publications, Inc, 1998. [55] J. Flach, M. Mulder, and M. M. van Paasen. The concept of the situation in psychology. In S. Banbury and S. Tremblay, editors, A Cognitive Approach to Situation Awareness: Theory and Application, pages 42–60. Ashgate, 2004. [56] J. M. Flach. Situation awareness: proceed with caution. Human Factors, 37 (1):149–157, 1995. [57] T. W. Fong, C. Thorpe, and C. Baur. Collaboration, dialogue, and humanrobot interaction. In Proceedings of the 10th International Symposium of Robotics Research, Lorne, Victoria, Australia, London, 2001. Springer-Verlag. [58] T. W. Fong, C. Thorpe, and C. Baur. Robot, asker of questions. Robotics and Autonomous Systems, 42(3-4):235–243, 2003. [59] T. W. Fong, I. Nourbakhsh, R. Ambrose, R. Simmons, A. Schultz, and J. Scholtz. The peer-to-peer human-robot interaction project. In AIAA Space 2005, 2005. [60] M. L. Fracker. Measures of situation awareness: review and future directions. Technical Report AL-TR-1991-0128, Wright-Patterson AFB OH: Armstrong Laboratory, Crew Systems Directorate, 1991.
REFERENCES
152
[61] X. Franch and J. P. Carvallo. A quality-model-based approach for describing and evaluating software packages. In Joint International Conference on Requirements Engineering Proceedings, pages 104–111. IEEE, 2002. [62] J. Freeman, S. E. Avons, D. E. Pearson, and W. A. Ijsselsteijn. Effects of sensory information and prior experience on direct subjective ratings of presence. Presence: Teleoperators and Virtual Environments, 8(1):1–13, 1999. [63] J. Freeman, S. E. Avons, R. Meddis, D. E. Pearson, and W. Ijsselsteijn. Using behavioural realism to estimate presence: A study of the utility of postural responses to motion stimuli. Presence, 9(2):149–164, 2000. [64] Y. Gatsoulis and G. S. Virk. Modular situational awareness for CLAWAR robots. In Proc. of CLAWAR 2005, 8th International Conference on Climbing and Walking Robots and the Support Technologies for Mobile Machines, pages 1011–1020, London, UK, 2005. [65] Y. Gatsoulis and G. S. Virk. Performance metrices for improving humanrobot interaction. In Proc. of CLAWAR 2007, 9th International Conference on Climbing and Walking Robots and the Support Technologies for Mobile Machines, Singapore, 2007. [66] Y. Gatsoulis, I. Chochlidakis, and G. S. Virk. Design toolset for realising robotic systems. In Proc. of CLAWAR 2004, 7th International Conference on Climbing and Walking Robots and the Support Technologies for Mobile Machines. Springer–Verlag, 2004. [67] Y. Gatsoulis, I. Chochlidakis, and G. S. Virk. A software framework for the design and support of mass market CLAWAR machines. In Proc. of IEEE International Conference on Mechatronics and Robotics (MECHROB’04), Aachen, Germany, 2004.
REFERENCES
153
[68] Y. Gatsoulis, G. S. Virk, M. Parack, and A. Kherada. “What’s going on?” An alternative approach into investigating human-robot interactions. In Proc. of CLAWAR 2006, 9th International Conference on Climbing and Walking Robots and the Support Technologies for Mobile Machines, 2006. [69] Y. Gatsoulis, G. S. Virk, and A. Dehghani. The influence of human factors on task performance: A linear approach. In Proc. of CLAWAR 2008, 10th International Conference on Climbing and Walking Robots and the Support Technologies for Mobile Machines, Coimbra, 2008. [70] V. J. Gawron. Human workload. In Human Performance Measures Handbook, chapter 3, pages 54–153. Lawrence Erlbaum Assoc., 2000. [71] B. P. Gerkey, R. T. Vaughan, and A. Howard. The Player/Stage project: tools for multi–robot and distributed sensor systems. In Proc. of International Conference on Advanced Robotics ICAR 2003, pages 317–323, 2003. [72] B. Graf, M. Hans, and R. D. Schraft. Mobile robot assistants. Robotics & Automation Magazine, IEEE, 11(2):67–77, 2004. [73] M. K. Greenwald, E. W. Cook, and P. J. Lang. Affective judgement and psychophysiological response: dimensional covariation in the evaluation of pictorial stimuli. Journal of Psychophysiology, 3:51–64, 1989. [74] S. G. Hart and L. E. Stavenland. Development of NASA-TLX (Task Load Index): Results of empirical and theoretical research. In P. A. Hancock and N. Meshkati, editors, Human Mental Workload, chapter 7, pages 139–183. Elsevier, 1988. [75] Y. Hauss and K. Eyferth.
Evaluation of a multi-sector-planner concept:
SALSA – a new approach to measure situation awareness in ATC. In 4th USA/Europe Air Traffic Management RAD Seminar, Santa Fe, USA, 2001.
REFERENCES
154
[76] S. Haykin. Neural Networks: A Comprehensive Foundation. Prentice Hall, 2nd edition, 1998. [77] R. Hecht-Neilsen. Neurocomputing. Addison Wesley, 1990. [78] R. Hecht-Nielsen. Theory of the backpropagation neural network. In Neural Networks, 1989. IJCNN., International Joint Conference on, pages 593–605 vol.1, 1989. [79] J. Heinzmann and A. Zelinsky. Building human-friendly robot systems. In Proc. of International Symposium of Robotics Research (ISRR’ 99), 1999. [80] R. M. Held and N. I. Durlach. Telepresence. Presence, 1(1):109–112, 1992. [81] T.T. Hewett, S. Card, T. Carey, J Gasen, M Mantei, G. Perlman, and W. Strong, G. Verplank. ACM SIGCHI Curricula for human-computer interaction. http://sigchi.org, 1996. [82] S. G. Hill and B. Bodt. A field experiment of autonomous mobility: operator workload for one and two robots. In HRI ’07: Proceeding of the ACM/IEEE Intl. Conference on Human-Robot Interaction, pages 169–176, NY, USA, 2007. ACM Press. [83] B. Hine, P. Hontalas, T. Fong, L. Piguet, E. Nygren, and A. Kline. VEVI a virtual environment teleoperations interface for planetary exploration. 1995. [84] S. Hughes and M. Lewis. Robotic camera control for remote exploration. In Proc. of the Conference on Human Factors in Computing Systems, pages 511–517, Vienna, Austria, 2004. [85] S. B. Hughes and M. Lewis. Task-driven camera operations for robotic exploration. IEEE Transactions on Systems, Man and Cybernetics - Part A: Systems and Humans, 35(4):513–522, 2005.
REFERENCES
155
[86] C. M. Humphrey, C. Henk, G. Sewell, B. W. Williams, and J. A. Adams. Assessing the scalability of a multiple robot interface. In HRI ’07: Proceeding of the ACM/IEEE international conference on Human-robot interaction, pages 239–246, NY, USA, 2007. ACM Press. [87] W. A. Ijsselsteijn, H. de Ridder, J. Freeman, and S. E. Avons. Presence: Concept, determinants and measurement. In Proc. of the SPIE, Human Vision and Electronic Imaging V, pages 3959–3976, 2000. [88] ISO TC 184/SC 2. Robots for industrial environments - Safety requirements - Part 1: Robot. International Organization for Standardization, 2006. ISO 10218-1:2006. [89] ISO TC 184/SC 2. ISO TC184/SC2/PT2 Robots in Personal Care. International Organization for Standardization, 2008. under development. [90] ISO/IEC. Standards 9126 (information technology – software product evaluation – quality characteristics and guidelines for their use), 1991. [91] A. Jacoff, Ba Weiss, E. Messina, S. Tadokoro, and Y. Nakagawa. Test arenas and performance metrics for urban search and rescue robots. In Proc. of the 2003 IEEE/RSJ International Conference on Intelligent Robots and Systems, Las Vegas, 2003. [92] E. Jeannot. Situation awareness: Synthesis of literature search. Technical Report EEC Note No. 16/00, Project ASA-Z-EC, France: EUROCONTROL Experimental Centre, 2000. [93] E. Jeannot, C. Kelly, and D. Thompson. The development of situation awareness measures in ATM systems. Technical Report HRS/HSP-005-REP-01, Ed. 1.0, Released Issue, European Air Traffic Management Programme, European Organisation for the safety of air navigation, Eurocontrol, 2003.
REFERENCES
156
[94] H. R. Jex. Measuring mental workload: problems, progress and promisses. In P. A. Hancock and N. Meshkati, editors, Human Mental Workload, chapter 2, pages 5–39. Elsevier, 1988. [95] H. R. Jex and W. F. Clement. Defining and measuring perceptual-motor workload in manual control tasks. In N. Moray, editor, Mental Workload: Its Theory and Measurement, pages 125–177. Plenum Press, 1979. [96] G. Johannsen. Workload and workload measurement. In N. Moray, editor, Mental Workload: Its Theory and Measurement, pages 3–11. Plenum Press, 1979. [97] G. Johanssen, N. Moray, R. Pew, J. Rasmussen, A. Sanders, and C. Wickens. Final report of experimental psychology group. In N. Moray, editor, Mental Workload: its Theory and Measurement. Plenum Press, 1979. [98] C. Johnson, Bugra A. Koku, K. Kawamura, and Peters. Enhancing a humanrobot interface using sensory egosphere. In Proc. of IEEE International Conf. on Robotics and Automation ICRA’02, 2002. [99] C. A. Johnson, J. A. Adams, and K. Kawamura. Evaluation of an enhanced human-robot interface. In Systems, Man and Cybernetics, 2003. IEEE International Conference on, volume 1, pages 900–905 vol.1, 2003. [100] D. G. Jones. Subjective measures of situation awareness. In M. R. Endsley and D. J. Garland, editors, Situation Awareness Analysis and Measurement. Lawrence Erlbaum Associates, Mahwah, NJ, USA, 2000. [101] D. B. Kaber, E. Onal, and M. R. Endsley. Design of automation for telerobots and the effect on performance, operator situation awareness, and subjective workload. Human Factors and Ergonomics in Manufacturing, 10(4):409–430, 2000.
REFERENCES
157
[102] D. B. Kaber, J. M. Riley, R. Zhou, and J. V. Draper. Effects of visual interface design, control interface type, and control latency on performance, telepresence, and workload in a teleoperation task. In Proc. of the 14th Triennial Congress of the International Ergonomics Association / 44th Annual meeting of the Human Factors and Ergonomics Society, San Diego, CA, USA, 2000. [103] M. Kahan, J. Tanzer, D. Darvin, and F. Borer.
Virtual reality-assisted
cognitive-behavioral treatment for fear of flying: acute treatment and followup. CyberPsychology & Behavior, 3(3):387–392, 2000. [104] KDE. KDE human inteface guidelines. http://usability.kde.org, 2004. [105] T. Kim and F. Biocca. Telepresence via television: two dimensions of telepresence may have different connections to memory and persuasion. Journal of Computer-Mediated Communication, 3(2), 1997. [106] H. Kitano and S. Tadokoro. RoboCup Rescue: a grand challenge for multiagent and intelligent systems. AI Magazine, 22(1):39–52, 2001. [107] D. Kulic. Safety for Human-Robot Interaction. PhD thesis, The University of British Columbia, 2005. [108] A. M. Law. How to conduct a successful simulation study. In Winter Simulation Conference, volume 1, pages 66–70. IEEE, 2003. [109] R Likert. A technique for the measurement of attitudes. Archives of Psychology, (140):1–55. [110] G. G. Looney. Advances in feedforward neural networks: demystifying knowledge acquiring black boxes. IEEE Transactions Knowledge Data, 8(2):211–226, 1996. [111] N. A. Maiden and C. Ncube. Acquiring COTS software selection requirements. IEEE Software, 15(2):46–56, 1998.
REFERENCES
158
[112] T. Masters. Practical Neural Network Recipes in C++. Academic Press, Boston, MA, 1993. [113] M. D. Matthews, R. J. Pleban, M. R. Endsley, and L. D. Strater. Measures of infantry situation awareness for a virtual MOUT environment. In Proc. of the Human Performance, Situation Awareness and Automation: User Centered Design for the New Millenium Conference, 2000. [114] M. D. Matthews, S. A. Beal, and R. J. Pleban. Situation awareness in a virtual environment: description of a subjective assessment scale. Technical Report ARI Research Report 1786, U.S. Army Research Institute, Fort Benning, GA, 2002. [115] J. D. Mcdonnell. Pilot rating techniques for the estimation and evaluating of handling qualities. Technical Report AFFDL-TR-68-76, Wright-Patterson AFB, Air Force Flight Dynamics Laboratory, TX, USA, 1968. [116] B. McGuinness. Quantitative Analysis of Situational Awareness (QUASA): applying signal detection theory to true/false probes and self–ratings. In Proc. of 9th Intl. Command and Control Research and Technology Symposium, Copenhagen, Denmark, 2004. [117] B. McGuinness. Situational awareness and the Crew Awareness Rating Scale (CARS). In Proc. of the Avionics Conference, Heathrow, London, 1999. [118] M. Meehan, S. Razzaque, B. Insko, M. Whitton, and Brooks. Review of four studies on the use of physiological reaction as a measure of presence in stressful virtual environments. Applied Psychophysiology and Biofeedback, 30(3), 2005. [119] Michael Meehan, Brent Insko, Mary Whitton, and Frederick P. Brooks. Physiological measures of presence in stressful virtual environments. In SIGGRAPH ’02: Proceedings of the 29th annual conference on Computer graphics and interactive techniques, pages 645–652, New York, NY, USA, 2002. ACM Press.
REFERENCES
159
[120] N. Meshkati. Heart rate variability and mental workload assessment. In P. A. Hancock and N. Meshkati, editors, Human Mental Workload, chapter 5, pages 101–115. Elsevier, 1988. [121] E. Messina, A. Jacoff, J. Scholtz, C. Schlenoff, H-M Huang, A. Lytle, and J. Blitch. Statement of requirements for urban search and rescue robot performance standards. Technical report, Department of Homeland Security Science and Technology Directorate and National Institute of Standards and Technology, 2005. [122] M. Micire. Analysis of the robotic-assisted search and rescue response to the World Trade Centre disaster. Master’s thesis, Department of Computer Science and Engineering, 2002. [123] Microsoft. Windows XP guidelines for applications. http://www.microsoft. com, 2002. [124] M. Minsky. Telepresence. Omni, pages 45–51, 1980. [125] T. Mitchell. Machine Learning. McGraw-Hill Education (ISE Editions), 1997. [126] N. Moray, editor. Mental Workload: Its Theory and Measurement, NY, 1979. NATO, Plenum Press. [127] F. A. Muckler and S. A. Seven. Selecting performance measures: “objective” versus “subjective” measurement. Human Factors, 34:441–456, 1992. [128] G. Mulder. Sinusarrythmia and mental workload. In N. Moray, editor, Mental Workload: Its Theory and Measurement, pages 327–343. Plenum Press, 1979. [129] E. J. Muniz, R. J. Stout, C. A. Bowers, and E. Salas. A methodology for measuring team situational awaremess: Situational Awareness Linked Indicators Adapted to Novel Tasks (SALIANT). In RTO Meeting Proceedings 4. Paper
REFERENCES
160
presented at the RTO HFM Symposium on Collaborative Crew Performance in Complex Operational Systems, Edinburgh, Scotland, U.K., 1998. [130] R. Murphy. Robot-assisted search and rescue: A grand challenge problem for computing systems. In Grand Challenges Conference Application for CRA Conference on Grand Research Challenges in Computer Science and Engineering, Warrenton, Virginia, 2002. [131] R. R. Murphy. Trial by fire [rescue robots]. Robotics & Automation Magazine, IEEE, 11(3):50–61, 2004. [132] Performance Metrics for Intelligent Systems Workshop, 2000–2007. National Institute of Standards and Technology, Intelligent Systems Division. [133] A. Neal, M. Griffin, J. Paterson, and P. Bordia. Human factors issues: performance management transition to a CNS/ATM environment. Technical Report Final report: Air Services Australia, Brisbane: University of Queensland, 1998. [134] U. Neisser. Cognition and reality: Principles and implications of cognitive psychology. San Francisco: W.H. Freeman, 1976. [135] M. Nelson and W. T. Illingworth. A Practical Guide to Neural Nets. AddisonWesley, Reading, MA, 1990. [136] CLAWAR Thematic Network. Summary for WP2: Simulators, 2003. [137] J. Nikoukaran, J. Hlupic, and R. J. Paul. Criteria for simulation software evaluation. In Simulation Conference Proceedings, volume 1, pages 399–406. IEEE, 1998. [138] OFDA/CRED EM-DAT. EM-DAT: The OFDA/CRED Interational Disaster Database. http://www.em-dat.net, 2006.
REFERENCES
161
[139] R. Olivares, C. Zhou, B. Bodenheimer, and J. A. Adams. Interface evaluation for mobile robot teleoperation. In Proc. of the ACM Southeast Conference (ACMSE03), pages 112–118, 2003. [140] R. W. Pew. The state of situation awareness measurement: heading toward the next century. In M. R. Endsley and D. J. Garland, editors, Situation Awareness Analysis and Measurement. Lawrence Erlbaum Associates, Mahwah, NJ, USA, 2000. [141] A. R. Pritchett, R. J. Hansman, and E. N. Johnson. Use of testable responses for performance–based measurement of situation awareness. In Proc. of the International Conference on Experimental Analysis and Measurement of Situation Awareness, 1996. [142] K. M. Reichard. Integrating self–health awareness in autonomous systems. Robotics and Autonomous Systems, (49):105–112, 2004. [143] K. M. Reichard and E. C. Crow. Self–awareness, monitoring and diagnosis for autonomous vehicle operations. In Proc. of AUVSI Unmanned Systems, Orlando, FL, USA, 2002. [144] G. B. Reid and T. E. Nygren. The Subjective Workload Assessment Technique: A scaling procedure for measuring mental workload. In P. A. Hancock and N. Meshkati, editors, Human Mental Workload, chapter 8, pages 185–218. Elsevier, 1988. [145] J. M. Riley. The utility of measures of attention and situation awareness for quantifying telepresence. PhD thesis, Department of Industrial Engineering, Missisipi State University, 2001. [146] J. M. Riley, D. B. Kaber, and J. V. Draper. Situation awareness and attention allocation measures for quantifying telepresence experiences in teleoperation. Human Factors and Ergonomics in Manufacturing, 14(1):51–67, 2004.
REFERENCES
162
[147] Raul Rojas. Neural Networks: A Systematic Introduction. Springer, 1996. [148] A. H. Roscoe. Assessing pilot workload in flight. Flight test techniques. In Proc. of the NATO Advisory Group for Aerospace Research and Development (AGARD), number AGARD-CP-473, Neuilly-sur-Seine, France, 1984. AGARD. [149] D. E. Rumelhart and J. L. Mcclelland. Parallel Distributed Processing, volume 1. MIT Press, 1986. [150] A. F. Sanders. Some remarks on mental load. In N. Moray, editor, Mental Workload: Its Theory and Measurement, pages 41–77. Plenum Press, 1979. [151] N. B. Sarter and D. D. Woods. Situation awareness: a critical but ill-defined phenomenon. The International Journal of Aviation Psychology, 1(1):45–57, 1991. [152] N. B. Sarter and D. D. Woods. How in the world did we ever get into that mode? Mode error and awareness in supervisory control. Human Factors, 37 (1):5–19, 1995. [153] G. P. J. Schmitz, C. Aldrich, and F. S. Gouws. ANN-DT: An algorithm for extraction of decision trees from artificial neural networks. IEEE Transactions on Neural Networks, 10(6):1392–1402, 1999. [154] J. Scholtz. Theory and evaluation of human robot interactions. In Proc. of the 36th Hawaii International Conference on System Sciences, 2003. [155] J. Scholtz, A. Antonishek, and J. Young. Evaluation of human–robot interaction in the NIST reference search and rescue test arenas. In Proc. in the Performance Metrics for Intelligent Systems (PerMIS ’04), 2004.
REFERENCES
163
[156] J. Scholtz, B. Antonishek, and J. Young. Evaluation of human-robot interface: development of situational awareness methodology. In Proc. of the 37th International Conference on System Sciences, 2004. [157] J. Scholtz, J. Young, J. L. Drury, and H. A. Yanco. Evaluation of human-robot interaction awareness in search and rescue. In Proc. of the IEEE International Conference on Robotics and Automation (ICRA 2004), 2004. [158] J. C. Scholtz, B. Antonishek, and Young. Implementation of a situation awareness assessment tool for evaluation of human-robot interfaces. IEEE Transactions on Systems, Man and Cybernetics-Part A: Systems and Humans, 35(4), 2005. [159] R. Setiono, W. K. Leow, and J. M. Zurada. Extraction of rules from artificial neural networks for nonlinear regression. IEEE Transactions on Neural Networks, 13(3):564–577, 2002. [160] S. Shankar, Y. Jin, J. A. Adams, and R. Bodenheimer. Enhancing roboflag users’ situational awareness. In Proc. of the 2004 Human Factors and Ergonomics Society 48th Annual Meeting, 2004. [161] T. B. Sheridan. Musings on telepresence and virtual presence. Presence, 1(1): 120–126, 1992. [162] T. B. Sheridan. Telerobotics, Automation, and Human Supervisory Control. The MIT Press, 1992. [163] M. Slater. Measuring presence: a response to the Witmer and Singer Presence Questionnaire. Presence, 8(5):560–565, 1999. [164] M. Slater and S. Wilbur. A framework for immersive virtual environments (FIVE): speculations on the role of presence in virtual environments. Presence: Teleoperators and Virtual Environments, 6(6):603–616, 1997.
REFERENCES
164
[165] M. Slater and S. Wilbur. Through the looking glass world of presence: A framework for immersive virtual environments. In M. Slater, editor, FIVE’95 Framework for Immersive Virtual Environments. QMW University of London, 1995. [166] M. Slater, A. Steed, J. Mccarthy, and F. Maringelli. The influence of body movement on subjective presence in virtual environments. Human Factors: The Journal of the Human Factors and Ergonomics Society, 40(3):469–477, 1998. [167] K. Smith and P. A. Hannock. Situation awareness is adaptive, externally directed consciousness. Human Factors, 37(1):137–148, 1995. [168] T. J. Smith and K. U. Smith. The human factors of workstation telepresence. In Third annual workshop on space operations automation and robotics (Tech. Report NASA Conference Publication 3059, pp. 235-250), 1989. [169] N. Stanton, P. Salmon, G. Walker, C. Baber, and D. Jenkins. Mental workload assessment methods. In Human Factors Methods: A Practical Guide for Engineering and Design, chapter 8, pages 301–364. Ashgate, 2005. [170] K. Swingler. Applying Neural Networks: A Practical Guide. Academic Press, NY, 1996. [171] S. Tachi. Telexistence and R-Cubed. Industrial Robot, 26(3), 1999. [172] S. Tadokoro. Special project on development of advanced robots for disaster response (DDT project). In Advanced Robotics and its Social Impacts, 2005. IEEE Workshop on, pages 66–72, 2005. [173] S. Tadokoro, F. Matsuno, M. Osonato, and H. Asama. Japan national special project for earthquake disaster mitigation in urban areas. In First Interna-
REFERENCES
165
tional Workshop on Synthetic Simulation and Robotics to Mitigate Earthquake Disaster, 2003. [174] R. M. Taylor. Situational Awareness Rating Technique (SART): the development of a tool for aircrew systems design. In Situational Awareness in Aerospace Operations (AGARD-CP-478), Neuilly Sur Seine, France: NATO– AGARD, 1990. [175] R. M. Taylor and S. J. Selcon. Subjective measurement of situational awareness. In Designing for everyone, Proc. of the 11th Congress of the International Ergonomics Association, pages 789–791, 1991. [176] R. M. Taylor, R. Shadrake, J. Haugh, and A. Bunting. Situation awareness, trust and compatibility: using cognitive mapping techniques to investigate the relationships between important cognitive systems variables. In Proc. of 79th NATO AGARD Symposium, Brussels, Belgium, 1995. [177] R Development Core Team. The R project for statistical computing. http: //www.r-project.org, 2007. [178] The Royal Aeronautical Society Human Factors Group. Summary of the various definitions of situation awareness. http://www.raes-hfg.com, 2003. [179] V. J. Traver, Del, and M. Perez-Francisco. Making service robots humansafe. In Intelligent Robots and Systems, 2000. (IROS 2000). Proceedings. 2000 IEEE/RSJ International Conference on, volume 1, pages 696–701 vol.1, 2000. [180] P. Tsang and G. F. Wilson. Mental workload. In G. Salvendy, editor, Handbook of Human Factors and Ergonomics, chapter 13, pages 417–449. John Wiley and Sons, Inc., 2nd edition, 1997. [181] J. Uhlarik and D. A. Comerford. A review of situation awareness literature relevant to pilot surveillance functions. Technical Report DOT/FAA/AM-
REFERENCES
166
02/3, FAA Office of Aerospace Medicine, Civil Aerospace Medicine Institute, Washington DC, 2002. [182] B. R. Upadhyaya and E. Eryurek. Application of neural networks for sensor validation and plant monitoring. Neural Technology, (97):170–176, 1992. [183] H. Ursin and R. Ursin.
Psysiological indicators of mental workload.
In
N. Moray, editor, Mental Workload: Its Theory and Measurement, pages 349– 365. Plenum Press, 1979. [184] US Dept of Homeland Security and US National Institute of Standards and Technology. Response Robot Evaluation Exercise. http://www.isd.mel. nist.gov, April 2006. [185] US Federal Emergency Management Agency. Urban Search and Rescue Response System: Field Operations Guide, 2003. [186] US Fire Administration. Firefighter fatalities in the United States in 2001. Technical Report FA-237, US Federal Emergency Management Agency, August 2002. [187] US Fire Administration. Firefighter fatalities in the United States in 2004. Technical Report FA-299, US Federal Emergency Management Agency, August 2005. [188] US Fire Administration. Firefighter fatalities in the United States in 2005. Technical Report FA-306, US Federal Emergency Management Agency, August 2006. [189] US Fire Administration. Firefighter fatality retrospective study. Technical Report FA-220, US Federal Emergency Management Agency, April 2002. [190] US Fire Administration. Northwest firefighters mortality study: 1945-1989.
REFERENCES
167
Technical Report FA-105, US Federal Emergency Management Agency, Sep. 1991. [191] US Naval Research Lab: NCARAI–IDE Section. NASA TLX for Windows. http://www.nrl.navy.mil, 2004. [192] M. Usoh, E. Catena, S. Arman, and M. Slater. Using presence questionnaires in reality. Presence: Teleoperators and Virtual Environments, 9(5):497–503, 2000. [193] M. A. Vidulich. Measuring situation awareness. In Proc. of the Human Factors Society 36th Annual Meeting, pages 40–1, 1992. [194] M. A. Vidulich and E. R. Hughes. Testing a subjective metric of situation awareness. In Proc. of the Human Factors and Ergonomics Society 35th Annual Meeting, Santa Monica, CA, U.S.A., 1991. [195] J. Wang, M. Lewis, and M. Koes. Validating USARsim for use in HRI research. In Proc. of the Human Factors and Ergonomics Society 49th Annual Meeting, 2005. [196] R. B. Welch. How can we determine if the sense of presence affects task performance? Presence, 8(5):574–577, 1999. [197] R. B. Welch. The presence of aftereffects. In Proc. of the 7th Intl Conference on Human-Computer Interaction, Volume 1, pages 273–276, 1997. [198] B. K. Wiederhold and M. D. Wiederhold. Three-year follow-up for virtual reality exposure for fear of flying. CyberPsychology & Behavior, 6(4), 2003. [199] W. W. Wierwille and J. G. Casali. A validated rating scale for global mental workload measurement applications. In Proc. of the 27th Annual Meeting of the Human Factors Society, pages 129–133, Santa Monica, CA, 1983. Human Factors Society.
REFERENCES
168
[200] Wikipedia. Likert scale — Wikipedia, The Free Encyclopedia. http://en. wikipedia.org/wiki/Likert scale, 2007. [201] F. H. Wilhelm, M. C. Pfaltz, J. J. Gross, I. B. Mauss, S. Kim, and B. K. Wiederhold. Mechanisms of virtual reality exposure therapy: the role of the behavioral activation and behavioral inhibition systems. Applied Psychophysiology and Biofeedback, 30(3), 2005. [202] B. F. Willems and M. Heiney. Real-time assessment of situation awareness of air traffic control specialists on operational host computer system and display system replacement hardware. In Proc. of 4th USA / Europe Air Traffic Management R&D Seminar, Santa Fe, USA, 2001. [203] G. F. Wilson and R. D. O’Donell. Measurement of operator workload with the neuropsychological workload test battery. In P. A. Hancock and N. Meshkati, editors, Human Mental Workload, chapter 4, pages 63–100. Elsevier, 1988. [204] B. G. Witmer and M. J. Singer. Measuring immersion in virtual environments. Technical Report ARI TR 1014, US Army Research Institute for the Behavioral and Social Sciences, Alexandria, VA, 1994. [205] B. G. Witmer and M. J. Singer. Measuring presence in virtual environments: a Presence Questionnaire. Presence: Teleoperators and Virtual Environments, 7(3):225–240, 1998. [206] J. D. Wolf. Crew workload assessment: development of a measure of operator workload. Technical Report AFFDL-TR-78-165, Wright-Patterson AFB, Air Force Flight Dynamics Laboratory, OH, USA, 1978. [207] B. J. Wythoff. Backpropagation neural networks: A tutorial. Chemometrics and Intelligent Laboratory Systems, 18:115–155, 1993.
REFERENCES
169
[208] H. A. Yanco and J. Drury. “Where am I?” Acquiring situation awareness using a remote robot platform. In Proc. of the IEEE Conference on Systems, Man and Cybernetics, 2004. [209] H. A. Yanco, J. L. Drury, and J. Scholtz. Beyond usability evaluation: analysis of human-robot interaction at a major robotics competition. Human-Computer Interaction, 19:117–149, 2004.
Appendices A ASAGAT: Analogue Situation Awareness Global Assessment Technique B CARS: Crew Awareness Rating Scale C PASA: Post Assessment of Situation Awareness D SPASA: Short Post Assessment of Situation Awareness E WSPQ: Witmer–Singer Presence Questionnaire F MSUSPQ: Modified Slater–Usoh–Steed Presence Questionnaire G SPATP: Short Post Assessment of Telepresence H TLX: NASA Task Load Index I MCHS: Modified Cooper–Harper Scale J FSWAT: Fast Subjective Workload Assessment Technique K Neural Network Weights L List of Publications
Appendix A ASAGAT: Analogue Situation Awareness Global Assessment Technique This appendix presents the list of ASAGAT items. This list of items is also used in QASAGAT. 1. Enter on the map your current position and orientation. 2. Enter on the map the trajectory you have followed so far. 3. Enter on the map any physical landmarks. 4. Enter the side of the object that lies next to you. 5. Are there any objects or obstacles around you in a radius of (a) 0-3 metres? (b) 3-8 metres? 6. What is the total percentage of the area you have covered so far? 7. Sketch the area you have covered so far. 8. Estimate elapsed time. 9. Estimate time needed to search the complete area.
10. Estimate remaining time. 11. Estimate the percentage of the total area that can be search within the estimated remaining time. 12. Enter the battery level. 13. How many victims have you found so far? 14. How many victims that are possibly lightly injured have you found so far? 15. How many victims that are possibly severely injured have you found so far? 16. Estimate the distance of the robot from the nearest exit point. 17. Estimate time needed to reach the nearest exit point. 18. Do you think the time you have left is sufficient to drive the robot back?
A.1
Factors and subscales
The dimensions of each one of the items are shown in the following tables: MA: Mission Awareness L1: Data perception SA: Spatial Awareness L2: Data comprehension TA: Time Awareness L3: Future state projection Q# 1 3∗ 5 7 9 11 13 15∗ 17 ∗
Dimension SA SA SA MA, SA MA, TA MA, SA, TA MA MA SA, TA
Level L1, L2 L2 L1 L2 L2 L2, L3 L1 L1, L2 L2, L3
Q# 2 4 6 8 10 12 14∗ 16 18
Dimension SA SA MA, SA TA TA TA MA SA MA, SA, TA
Level L1, L2 L1 L2 L1 L1 L1 L1, L2 L2 L2, L3
items excluded in this experimental study, due to lack of appropriate features in the environmental setup
L1
L2 ?
†
L3 †
†
13, 15?
SA
1? , 2? , 4, 5
1? , 2? , 3, 6† , 7† , 11?† , 16, 17?† , 18?†
11?† , 17?† , 18?†
TA
8, 10, 12
9† , 11?† , 17?† , 18?†
11?† , 17?† , 18?†
? †
14 , 6 , 7 , 9 , 11?† , 15? , 18?†
11?† , 18?†
MA
belongs to more than one level belongs to more than one dimension
Appendix B CARS: Crew Awareness Rating Scale The following questionnaire asks you to self-rate your situation awareness. Indicate your preferred answer by marking an “X” in the appropriate box of the 4-point scale. Please consider the entire scale when answering the questions. Please also read the explanations below. Note that there is no time limit when answering.
PART I Use the following interpretations of the rating scale: Definitely Negative: I am sure I have less than satisfactory awareness of . . . Probably Negative: I think I have less than satisfactory awareness of . . . Probably Positive: I think I have satisfactory awareness of . . . Definitely Positive: I am sure I have satisfactory awareness of . . . 1. Would you say your awareness of relevant information is satisfactory?
Definitely
Probably
Probably
Definitely
Negative
Negative
Positive
Positive
2. Would you say your grasp of the situation, i.e. understanding of what is going on, is satisfactory?
Definitely
Probably
Probably
Definitely
Negative
Negative
Positive
Positive
3. Would you say your awareness of how the situation is likely to develop over time is satisfactory?
Definitely
Probably
Probably
Definitely
Negative
Negative
Positive
Positive
4. Would you say your awareness of how best to achieve your goals is satisfactory?
Definitely
Probably
Probably
Definitely
Negative
Negative
Positive
Positive
PART II Use the following interpretations of the rating scale: Definitely Negative: I find it very difficult to . . . Probably Negative: It seems not so easy for me to . . . Probably Positive: It seems generally OK for me to . . . Definitely Positive: I find it very easy to . . . 5. Would you say it is easy to keep up to speed with the details of the situation?
Definitely
Probably
Probably
Definitely
Negative
Negative
Positive
Positive
6. Would you say it is easy to make sense of the situation as a whole, to see the “big picture”?
Definitely
Probably
Probably
Definitely
Negative
Negative
Positive
Positive
7. Would you say it is easy to foresee or predict the likely progress or events?
Definitely
Probably
Probably
Definitely
Negative
Negative
Positive
Positive
8. Would you say it is easy to decide upon the best course of action?
Definitely
Probably
Probably
Definitely
Negative
Negative
Positive
Positive
Appendix C PASA: Post Assessment of Situation Awareness The following questionnaire asks you to self-rate your situation awareness. Indicate your preferred answer by marking an “X” in the appropriate box of the 6-point scale. Please consider the entire scale when answering the questions. Note that there is no time limit when answering.
1. How well do you feel you were able to find your position and orient yourself?
Not well at all
Very well
2. How well do you feel you were able to identify obstacles?
Not well at all
Very well
3. How well do you feel you were able to avoid obstacles?
Not well at all
Very well
4. How well do you feel you were able to avoid hazards? (e.g. narrow doors)
Not well at all
Very well
5. How well do you feel you were able to keep track of time aspects?
Not well at all
Very well
6. How well do you feel you were able to keep track of the area covered?
Not well at all
Very well
7. How well do you feel you were able to keep track of the status of the modules of the robot?
Not well at all
Very well
8. How well do you feel you were able to keep track of the victims around you?
Not well at all
Very well
9. How well do you feel you were able to predict what was going to happen next around you?
Not well at all
Very well
10. How well do you feel you were able to follow the mission goals?
Not well at all
Very well
C.1
Dimensions
The dimensions of each of the items are shown in the following tables: MA: Mission Awareness L1: Data perception SA: Spatial Awareness L2: Data comprehension TA: Time Awareness L3: Future state projection Q# 1 3 5 7 9
Dimension SA MA, SA TA MA MA L1 †
Level L2 L2, L3 L1, L2, L3 L2 L3
Q# 2 4 6 8 10
Dimension SA MA, SA MA, SA MA MA
L2 ?
?†
Level L1 L2, L3 L2 L1, L2 L3
L3 ?†
?
MA
8 , 10
3 ,4 ,6, 7, 8† , 10?
3?† , 4?† , 9, 10?
SA
2
1, 3?† , 4?† , 6?
3?† , 4?†
TA
5†
5†
5†
? †
belongs to more than one level belongs to more than one dimension
Appendix D SPASA: Short Post Assessment of Situation Awareness The following questionnaire asks you to self-rate your situation awareness. Indicate your preferred answer by marking an “X” in the appropriate box of the 4-point scale. Please consider the entire scale when answering the questions. Note that there is no time limit when answering.
1. It was easy to know exactly where I was and towards where I was looking at.
Strongly Disagree
Disagree
Agree
Strongly Agree
Agree
Strongly Agree
2. It was easy to identify and avoid obstacles.
Strongly Disagree
Disagree
3. It was easy to identify and avoid hazards. (e.g. obstacles, narrow doors, etc.)
Strongly Disagree
Disagree
Agree
Strongly Agree
4. It was easy to keep track of time aspects.
Strongly Disagree
Disagree
Agree
Strongly Agree
Agree
Strongly Agree
5. It was easy to keep track of the area covered.
Strongly Disagree
Disagree
6. It was easy to keep track of the victims that I located.
Strongly Disagree
Disagree
Agree
Strongly Agree
7. It was easy to predict what would happen next.
Strongly Disagree
Disagree
Agree
Strongly Agree
Agree
Strongly Agree
8. It was easy to follow the mission goals.
Strongly Disagree
Disagree
9. It was easy to change my course of action because I felt confident about the information provided.
Strongly Disagree
Disagree
Agree
Strongly Agree
10. The information were provided at a rate I could easily perceive.
Strongly Disagree
Disagree
Agree
Strongly Agree
11. I was able to have a good understanding of the holistic (global) situation.
Strongly Disagree
D.1
Disagree
Agree
Strongly Agree
Dimensions
The dimensions of each of the items are shown in the following tables: MA: Mission Awareness L1: Data perception SA: Spatial Awareness L2: Data comprehension TA: Time Awareness L3: Future state projection Q# 1 3 5 7 9 11
Dimension SA MA, SA MA, SA MA MA MA, SA, TA
Level L2 L2, L3 L2 L3 L3 L2
Q# 2 4 6 8 10
Dimension MA, SA TA MA MA MA, SA, TA
Level L1, L2, L3 L2, L3 L1, L2 L3 L1
L1
L2
L3
MA
2?† , 6? , 10†
2?† , 3?† , 5† , 6? , 11†
2?† , 3?† , 7, 8, 9
SA
2?† , 10†
1, 2?† , 3?† , 5† , 11†
2?† , 3?†
TA
10†
4? , 11†
4?
? †
belongs to more than one level belongs to more than one dimension
Appendix E WSPQ: Witmer–Singer Presence Questionnaire Characterise your experience in the environment by marking with an “X” in the appropriate box of the 7-point scale, in accordance with the question content and the descriptive labels. Please consider the entire scale when answering the questions. Answer the questions independently in the order they appear. Do not skip questions or return to a previous question to change your answer. Note that there is no time limit when answering. “With regard to the experienced environment:” 1. How much were you able to control events?
Not at all
Somewhat
Completely
2. How responsive was the environment to actions you initiated or performed?
Not
Moderately
Completely
responsive
responsive
responsive
3. How natural did your interactions with the environment seem?
Extremely
Borderline
Completely
artificial
natural
4. How much did the visual aspects of the environment involve you?
Not at all
Somewhat
Completely
5. How natural was the mechanism which controlled movement through the environment?
Extremely
Borderline
Completely
artificial
natural
6. How compelling was your sense of objects moving through space?
Not at all
Moderately
Very
compelling
compelling
7. How much did your experiences in the virtual environment seem consistent with your real world experiences?
Not consistent
Moderately consistent
Very consistent
8. Were you able to anticipate what would happen next in response to the actions that you performed?
Not at all
Somewhat
Completely
9. How completely were you able to survey or search the environment with your vision?
Not at all
Somewhat
Completely
10. How compelling was your sense of moving around inside the virtual environment?
Not at all
Moderately
Very
compelling
compelling
11. How closely were you able to examine objects?
Not at all
Pretty close
Very closely
12. How well could you examine objects from multiple positions?
Not at all
Somewhat
Extensively
13. How involved were you in the virtual environment experience?
Not involved
Moderately involved
Completely involved
14. How much delay did you experience between your actions and the expected outcomes?
Long delays
Moderate delays
No delays
15. How quickly did you adjust to the virtual environment?
Not at all
Slowly
< 1 min
16. How proficient in moving and interacting with the virtual environment did you feel at the end of the experience?
Not proficient
Reasonably proficient
Very proficient
17. How much did the visual display quality interfere or distract your from performing assigned tasks or required activities?
Prevented task
Interfered
performance
somewhat
Not at all
18. How much did the control devices interfere with the performance of assigned tasks or with other activities?
Not at all
Interfered
Interfered
somewhat
greatly
19. How well could you concentrate on the assigned tasks or required activities rather than on the mechanisms used to perform those tasks or activities?
Not at all
E.1
Somewhat
Dimensions of the items
INV/C: Involvement/Control NAT: Naturalness IFQUAL Interface Quality
Completely
1 5 9 13 17
INV/C NAT INV/C INV/C IFQUAL
2 6 10 14 18
INV/C INV/C INV/C INV/C IFQUAL
3 7 11 15 19
NAT NAT NAT INV/C IFQUAL
4 8 12 16
INV/C
1, 2, 4, 6, 8, 9, 10, 13, 14, 15, 16
NAT
3, 5, 7, 11, 12
IFQUAL 17, 18, 19
INV/C INV/C NAT INV/C
Appendix F MSUSPQ: Modified Slater–Usoh–Steed Presence Questionnaire Characterise your experience in the environment by marking with an “X” in the appropriate box of the 7-point scale, in accordance with the question content and the descriptive labels. Please consider the entire scale when answering the questions. Answer the questions independently in the order they appear. Do not skip questions or return to a previous question to change your answer. Note that there is no time limit when answering. “With regard to the experienced environment:” 1. Please rate your sense of being in the virtual environment, on the following scale, where the rightmost answer represents your normal experience of being in a place.
Not at all
Somewhat
Very much
2. To what extent there where times during the experience when the virtual environment was the reality of you? — There were times during the experience when the virtual environment was the reality for me . . .
At no time
Sometimes
Almost all the time
3. When you think back about your experience, do you think of the virtual environment more as images that you saw, or more as somewhere that you visited? — The virtual environment seems to be more like . . .
Images that
Somewhere
Somewhere
I saw
in between
that I visited
4. During the time of the experience, which was strongest on the whole, your sense of being in the virtual environment, or of being somewhere else? — I had a strongest sense of . . .
Being
Sometimes somewhere
Being in
somewhere else
else and sometimes in
the virtual
the virtual environment
environment
5. Consider your memory of being in the virtual environment. How similar in terms of the structure of the memory in this to the structure of the memory of other places you have been today? By “structure of memory” consider things like the extent to which you have a visual memory of the office space, whether that memory is in colour, the extent to which the memory seems vivid or realistic, its size, location in your imagination, the extent to which it is panoramic in your imagination, and other such structural elements. — I think of the virtual environment as a place in a way similar to other places that I’ve been today . . .
Not at all
Somewhat
Very much so
6. During the time of the experience, did you often think to yourself that you were actually in the virtual area? — During the experience I often thought that I was really standing in the office space . . .
Not very often
Moderately aware
Very aware
Appendix G SPATP: Short Post Assessment of Telepresence Characterise your experience in the environment by marking with an “X” in the appropriate box of the 5-point scale, in accordance with the question content and the descriptive labels. Please consider the entire scale when answering the questions. Answer the questions independently in the order they appear. Do not skip questions or return to a previous question to change your answer. Note that there is no time limit when answering. “With regard to the experienced environment:” 1. I thought the environment looked good and responded realistically to my actions.
Strongly
Disagree
Neutral
Agree
Disagree
Strongly Agree
2. I got so absorbed in the task that I was not aware of any events happening around me in the real world.
Strongly Disagree
Disagree
Neutral
Agree
Strongly Agree
3. I was well aware of the information displayed on the computer monitor and my robot controlling devices.
Strongly
Disagree
Neutral
Agree
Disagree
Strongly Agree
4. I feel I was able to search well the environment using only vision (via video provided).
Strongly
Disagree
Neutral
Agree
Disagree
Strongly Agree
5. I was able to examine objects quite closely and from multiple positions.
Strongly
Disagree
Neutral
Agree
Disagree
Strongly Agree
6. I was feeling a little bit confused or disoriented at the beginning of breaks or at the end of the experimental session.
Strongly
Disagree
Neutral
Agree
Disagree
Strongly Agree
7. I was able to adjust quickly to the virtual environment.
Strongly Disagree
Disagree
Neutral
Agree
Strongly Agree
8. I felt confident in moving and interacting with the virtual environment at the end of the task.
Strongly
Disagree
Neutral
Agree
Disagree
Strongly Agree
9. I was able to concentrate on the assigned tasks rather than on the mechanisms (e.g. controls, video quality, robot status, etc.) used to perform them.
Strongly
Disagree
Neutral
Agree
Disagree
Strongly Agree
10. I got so engrossed in the search task that I lost track of the real time it lasted.
Strongly
Disagree
Neutral
Agree
Disagree
Strongly Agree
11. I learnt new techniques that I think they will allow me to better teleoperate a robot in a search and rescue task.
Strongly
Disagree
Neutral
Agree
Disagree
Strongly Agree
12. There were times during the experiment that the virtual environment was the reality for me.
Strongly Disagree
Disagree
Neutral
Agree
Strongly Agree
G.1
Dimensions of the items
INV/C: Involvement/Control NAT: Naturalness IFQUAL Interface Quality 1 INV/C, NAT 2 INV/C 5 NAT 6 INV/C 9 IFQUAL 10 INV/C
3 IFQUAL 4 NAT 7 INV/C 8 INV/C 11 INV/C 12 INV/C
INV/C
1? , 2, 6, 7, 8, 10, 11, 12
NAT
1, 4, 5
IFQUAL 3, 9 ?
belongs to more than one dimension
Appendix H TLX: NASA Task Load Index The dimensions of TLX are the following six: 1. Mental demand: How much mental and perceptual activity (e.g. thinking, deciding, calculating, remembering, looking, searching, etc.) was required? Was the task easy or demanding, simple or complex, exacting or forgiving? 2. Physical demand: How much physical activity (e.g. pushing, turning, controlling, activating, etc.) was required? Was the task easy or demanding, slow or brisk, slack or strenuous, restful or laborious? 3. Temporal demand: How much time pressure did you feel due to the rate or pace at which the task or task elements occurred? Was the pace slow and leisurely or rapid and frantic? 4. Performance: How successful do you think you were in accomplishing the goals of the task set by the experimenter? How satisfied were you with your performance in accomplishing these goals? 5. Effort: How hard did you have to work (mentally and physically) to accomplish your level of performance? 6. Frustration level: How insecure, discouraged, irritated, stressed and annoyed versus secure gratified, content, relaxed, and complacent did you feel during the task?
Figure H.1: NASA-TLX software version in C/Glade-Gtk+
Appendix I MCHS: Modified Cooper–Harper Scale Very easy Operator mental effort is minimal Highly desirable and desired performance is easily attainable. Workload is low, interface is acceptable
Yes
Is the level of mental effort to complete your task acceptable?
No Mental workload is high and should be reduced
Yes
Are the errors small and inconsequential?
Easy Desirable
Operator mental effort is low and desired performance easily attainable.
Fair Mild difficulty
Acceptable operator mental effort is required to attain adequate system performance.
Minor but Annoying difficulty
Moderately high operator mental effort is required to attain adequate system performance.
4
Moderate Objectionable difficulty
High operator mental effort is required to attain adequate system performance.
5
Very objectionable but Tolerable difficulty
Maximum operator mental effort is required to attain adequate system performance.
6
Maximum operator mental effort is required to bring errors to moderate level.
7
Major difficulty
Maximum operator mental effort is required to avoid large or numerous errors.
8
Major difficulty
Intense operator mental effort is required to accomplish task, but frequent or numerous errors persist.
9
Impossible
Instructed task cannot be accomplished reliably.
Major difficulty
No Major deficiencies, interface redesign is strongly recommended
1
2 3
Yes
Instructed task can be completed most of the time without any serious mistakes?
No Major deficiencies, interface redesign is mandatory
10
Operator
Figure I.1: Flowchart of the Modified Cooper-Harper Scale
Appendix J FSWAT: Fast Subjective Workload Assessment Technique
Figure J.1: FSWAT software version in C/Glade-Gtk+ The dimensions of FSWAT are the following three: 1. Time demand: High values signify no free time as well as frequent overlaps of the various subtasks of the activity, while low ones signify a lot of spare time during the task execution and rare overlap of activities. 2. Effort demand: High values signify extensive mental effort, concentration and attention demands from the user; while low ones signify an activity which requires little mental effort, concentration and is nearly automatic. 3. Stress load: High values signify very intense stress due to confusion, frustration or anxiety, which require extreme determination and self-control; while low ones signify little confusion, risk, frustration or anxiety.
Appendix K Neural Network Weights The weights of the neural network model are presented in the following table. The first column is the weight in the form “Starting-Node>End-Node”. The StartingNode has the form “Factor.Q#”, e.g. SA.Q1 represents the first item of situation awareness. For the list of items see Appendices D, G and J. As explained in Section 5.3, Question 3 of situation awareness was excluded. The second column “A” are the weights at 6,000 cycles, which is when the model has the best trade-off between the training and the validation error. The third column “B” are the weights at 20,000 cycles when convergence has occurred. SA.Q1>H1 SA.Q1>H2 SA.Q1>H3 SA.Q1>H4 SA.Q1>H5 SA.Q1>H6 SA.Q1>H7 SA.Q1>H8 SA.Q1>H9 SA.Q5>H1 SA.Q5>H2 SA.Q5>H3 SA.Q5>H4 SA.Q5>H5 SA.Q5>H6 SA.Q5>H7 SA.Q5>H8 SA.Q5>H9
A 0.427 1.423 0.246 0.989 0.700 0.191 0.556 0.119 1.009 0.328 0.547 0.203 0.567 0.334 0.095 0.522 0.318 0.098
B 0.298 1.927 0.369 1.529 0.828 0.190 0.761 0.336 0.986 0.536 0.647 0.033 0.589 0.354 0.089 0.425 0.593 0.408
SA.Q2>H1 SA.Q2>H2 SA.Q2>H3 SA.Q2>H4 SA.Q2>H5 SA.Q2>H6 SA.Q2>H7 SA.Q2>H8 SA.Q2>H9 SA.Q6>H1 SA.Q6>H2 SA.Q6>H3 SA.Q6>H4 SA.Q6>H5 SA.Q6>H6 SA.Q6>H7 SA.Q6>H8 SA.Q6>H9
A 0.275 1.163 0.067 1.114 0.024 0.224 0.323 0.049 0.786 0.398 0.194 0.395 0.437 0.421 0.113 0.180 0.095 0.523
B 0.455 1.206 0.092 1.352 0.023 0.236 0.427 0.137 0.956 0.609 0.536 0.545 0.498 0.475 0.111 0.250 0.278 0.712
SA.Q4>H1 SA.Q4>H2 SA.Q4>H3 SA.Q4>H4 SA.Q4>H5 SA.Q4>H6 SA.Q4>H7 SA.Q4>H8 SA.Q4>H9 SA.Q7>H1 SA.Q7>H2 SA.Q7>H3 SA.Q7>H4 SA.Q7>H5 SA.Q7>H6 SA.Q7>H7 SA.Q7>H8 SA.Q7>H9
A 0.635 1.531 0.002 0.564 0.550 0.127 1.023 0.343 1.009 0.306 0.286 0.032 1.505 0.079 0.081 0.207 0.375 1.684
B 0.759 1.300 0.013 0.658 0.685 0.125 1.033 0.348 0.629 0.260 0.165 0.044 1.499 0.186 0.085 0.208 0.356 1.919
SA.Q8>H1 SA.Q8>H2 SA.Q8>H3 SA.Q8>H4 SA.Q8>H5 SA.Q8>H6 SA.Q8>H7 SA.Q8>H8 SA.Q8>H9 SA.Q11>H1 SA.Q11>H2 SA.Q11>H3 SA.Q11>H4 SA.Q11>H5 SA.Q11>H6 SA.Q11>H7 SA.Q11>H8 SA.Q11>H9 TP.Q3>H1 TP.Q3>H2 TP.Q3>H3 TP.Q3>H4 TP.Q3>H5 TP.Q3>H6 TP.Q3>H7 TP.Q3>H8 TP.Q3>H9 TP.Q6>H1 TP.Q6>H2 TP.Q6>H3 TP.Q6>H4 TP.Q6>H5 TP.Q6>H6 TP.Q6>H7 TP.Q6>H8 TP.Q6>H9
A 0.283 0.309 0.284 0.330 0.553 0.229 0.343 0.375 2.203 0.652 0.340 0.779 0.664 0.045 0.041 0.751 0.524 0.152 0.451 0.034 0.010 1.416 0.318 0.254 0.013 0.065 1.342 0.340 0.700 0.056 0.493 0.287 0.073 0.552 0.426 0.792
B 0.414 0.119 0.482 0.493 0.569 0.229 0.328 0.527 2.079 0.759 0.334 0.873 0.454 0.108 0.043 0.821 0.633 1.156 0.465 0.489 0.106 1.476 0.323 0.251 0.053 0.147 0.837 0.211 0.710 0.088 0.732 0.178 0.082 0.470 0.365 0.683
SA.Q9>H1 SA.Q9>H2 SA.Q9>H3 SA.Q9>H4 SA.Q9>H5 SA.Q9>H6 SA.Q9>H7 SA.Q9>H8 SA.Q9>H9 TP.Q1>H1 TP.Q1>H2 TP.Q1>H3 TP.Q1>H4 TP.Q1>H5 TP.Q1>H6 TP.Q1>H7 TP.Q1>H8 TP.Q1>H9 TP.Q4>H1 TP.Q4>H2 TP.Q4>H3 TP.Q4>H4 TP.Q4>H5 TP.Q4>H6 TP.Q4>H7 TP.Q4>H8 TP.Q4>H9 TP.Q7>H1 TP.Q7>H2 TP.Q7>H3 TP.Q7>H4 TP.Q7>H5 TP.Q7>H6 TP.Q7>H7 TP.Q7>H8 TP.Q7>H9
A 0.188 1.142 0.028 0.377 0.365 0.020 0.474 0.395 2.537 0.346 0.730 0.146 0.387 0.237 0.018 0.477 0.113 0.666 0.149 1.266 0.539 0.531 0.133 0.282 0.522 0.178 0.096 0.744 1.357 0.444 0.322 0.326 0.159 0.271 0.313 0.594
B 0.371 1.366 0.081 0.079 0.383 0.031 0.497 0.550 3.100 0.363 0.818 0.117 0.100 0.189 0.026 0.710 0.408 0.232 0.031 1.652 0.491 0.799 0.227 0.278 0.620 0.085 0.642 1.015 1.890 0.546 1.059 0.175 0.159 0.201 0.481 0.655
SA.Q10>H1 SA.Q10>H2 SA.Q10>H3 SA.Q10>H4 SA.Q10>H5 SA.Q10>H6 SA.Q10>H7 SA.Q10>H8 SA.Q10>H9 TP.Q2>H1 TP.Q2>H2 TP.Q2>H3 TP.Q2>H4 TP.Q2>H5 TP.Q2>H6 TP.Q2>H7 TP.Q2>H8 TP.Q2>H9 TP.Q5>H1 TP.Q5>H2 TP.Q5>H3 TP.Q5>H4 TP.Q5>H5 TP.Q5>H6 TP.Q5>H7 TP.Q5>H8 TP.Q5>H9 TP.Q8>H1 TP.Q8>H2 TP.Q8>H3 TP.Q8>H4 TP.Q8>H5 TP.Q8>H6 TP.Q8>H7 TP.Q8>H8 TP.Q8>H9
A 0.347 0.537 0.281 0.918 0.292 0.242 0.338 0.469 1.203 0.097 0.245 0.461 0.771 0.097 0.228 0.076 0.120 1.789 0.107 0.275 0.377 0.505 0.082 0.157 0.318 0.091 0.091 0.188 0.217 0.194 1.100 0.519 0.004 0.385 0.203 0.455
B 0.520 0.972 0.523 0.700 0.419 0.026 0.415 0.808 1.832 0.374 0.489 0.495 0.613 0.128 0.231 0.157 0.063 1.787 0.263 0.499 0.445 0.529 0.035 0.167 0.464 0.331 0.651 0.267 0.569 0.306 0.613 0.396 0.015 0.394 0.463 0.583
TP.Q9>H1 TP.Q9>H2 TP.Q9>H3 TP.Q9>H4 TP.Q9>H5 TP.Q9>H6 TP.Q9>H7 TP.Q9>H8 TP.Q9>H9 TP.Q11>H1 TP.Q11>H2 TP.Q11>H3 TP.Q11>H4 TP.Q11>H5 TP.Q11>H6 TP.Q11>H7 TP.Q11>H8 TP.Q11>H9 WL.Time>H1 WL.Time>H2 WL.Time>H3 WL.Time>H4 WL.Time>H5 WL.Time>H6 WL.Time>H7 WL.Time>H8 WL.Time>H9 WL.Stress>H1 WL.Stress>H2 WL.Stress>H3 WL.Stress>H4 WL.Stress>H5 WL.Stress>H6 WL.Stress>H7 WL.Stress>H8 WL.Stress>H9
A 0.096 0.828 0.157 2.057 0.666 0.213 0.455 0.388 0.546 0.084 0.245 0.047 1.324 0.652 0.045 0.302 0.820 0.966 0.778 0.003 0.150 0.021 0.342 0.192 0.277 0.404 0.139 0.011 0.421 0.225 0.850 0.456 0.206 0.407 0.027 1.794
B 0.100 1.007 0.331 2.039 0.515 0.202 0.240 0.451 0.903 0.066 0.454 0.131 1.881 0.829 0.044 0.473 0.968 0.850 0.900 0.314 0.086 0.101 0.461 0.192 0.306 0.721 0.446 0.057 0.572 0.300 0.739 0.423 0.203 0.429 0.020 2.240
TP.Q10>H1 TP.Q10>H2 TP.Q10>H3 TP.Q10>H4 TP.Q10>H5 TP.Q10>H6 TP.Q10>H7 TP.Q10>H8 TP.Q10>H9 TP.Q12>H1 TP.Q12>H2 TP.Q12>H3 TP.Q12>H4 TP.Q12>H5 TP.Q12>H6 TP.Q12>H7 TP.Q12>H8 TP.Q12>H9 WL.Effort>H1 WL.Effort>H2 WL.Effort>H3 WL.Effort>H4 WL.Effort>H5 WL.Effort>H6 WL.Effort>H7 WL.Effort>H8 WL.Effort>H9 H1>P H2>P H3>P H4>P H5>P H6>P H7>P H8>P H9>P
A 0.304 0.980 0.220 0.576 0.423 0.113 0.552 0.184 0.339 0.291 2.012 0.221 0.429 0.936 0.085 0.406 0.646 0.896 0.337 0.643 0.092 0.734 0.658 0.148 0.798 0.380 1.459 1.558 3.454 1.161 3.506 1.705 0.006 2.121 1.594 4.536
B 0.232 1.162 0.438 0.528 0.601 0.098 0.646 0.438 0.607 0.451 1.940 0.026 0.903 1.093 0.085 0.467 0.901 1.340 0.334 0.708 0.045 0.738 0.585 0.156 0.848 0.462 1.684 1.876 3.984 1.449 3.892 1.794 0.142 2.187 2.203 5.432
Appendix L List of Publications The following is a list of publications that are directly related to the thesis: 1. Y. Gatsoulis, I. Chochlidakis, and G. S. Virk. Design toolset for realising robotic systems. In Proc. of CLAWAR 2004, 7th International Conference on Climbing and Walking Robots and the Support Technologies for Mobile Machines, Madrid, 2004. 2. Y. Gatsoulis, I. Chochlidakis, and G. S. Virk. A software framework for the design and support of mass market CLAWAR machines. In Proc. of IEEE International Conference on Mechatronics and Robotics (MECHROB04), Aachen, 2004. 3. Y. Gatsoulis and G. S. Virk. Modular situational awareness for CLAWAR robots. In Proc. of CLAWAR 2005, 8th International Conference on Climbing and Walking Robots and the Support Technologies for Mobile Machines, London, 2005. 4. Y. Gatsoulis, G. S. Virk, M. Parack, and A. Kherada. “Whats going on?” An alternative approach into investigating human-robot interactions. In Proc. of CLAWAR 2006, 9th International Conference on Climbing and Walking Robots and the Support Technologies for Mobile Machines, Brussels, 2006. 5. Y. Gatsoulis and G. S. Virk. Performance metrices for improving humanrobot interaction. In Proc. of CLAWAR 2007, 9th International Conference on Climbing and Walking Robots and the Support Technologies for Mobile Machines, Singapore, 2007. 6. Y. Gatsoulis, G. S. Virk and A. Dehghani. The influence of human factors on task performance: A linear approach. In Proc. of CLAWAR 2008, 10th
International Conference on Climbing and Walking Robots and the Support Technologies for Mobile Machines, Coimbra, 2008. The following is a list of publications that work from the thesis has been included: 1. I. Chochlidakis, Y. Gatsoulis and G. S. Virk. Module-level generic design tool for robotic systems. In Proc. of CLAWAR 2004, 7th International Conference on Climbing and Walking Robots and the Support Technologies for Mobile Machines, Madrid, 2004. 2. Y. Gatsoulis and G. S. Virk. Situation awareness for search and rescue robots. Poster presented in 1st Summer School on Perception and Sensor Fusion in Mobile Robotics (PSFMR 2005), Ancona, 2005. 3. M. Parack, G. S. Virk, S. Dogramadzi and Y. Gatsoulis. Adaptable mobile platform for rough terrain locomotion. In Proc. of CLAWAR 2006, 9th International Conference on Climbing and Walking Robots and the Support Technologies for Mobile Machines, Brussels, 2006. 4. A. Y. Kherada, G. S. Virk, S. Dogramadzi, D. R. Harvey, Y. Gatsoulis. Active indoor localisation of mobile robots using infra-red. In Proc. of CLAWAR 2006, 9th International Conference on Climbing and Walking Robots and the Support Technologies for Mobile Machines, Brussels, 2006. 5. G. S. Virk, Y. Gatsoulis, M. Parack and A. Kherada. Mobile robotic issues for urban search and rescue. In Proc. of the 17th International Federation of Automatic Control (IFAC) World Congress, Seoul, 2008.