Performance Modeling of Multi-tiered Web Applications with Varying Service Demands Ajay Kattepur, Manoj Nambiar
To cite this version: Ajay Kattepur, Manoj Nambiar. Performance Modeling of Multi-tiered Web Applications with Varying Service Demands. IPDPS 2015 Workshops, May 2015, Hyderabad, India. pp.10, IPDPS 2015 Workshops.
HAL Id: hal-01118352 https://hal.archives-ouvertes.fr/hal-01118352 Submitted on 18 Feb 2015
HAL is a multi-disciplinary open access archive for the deposit and dissemination of scientific research documents, whether they are published or not. The documents may come from teaching and research institutions in France or abroad, or from public or private research centers.
L’archive ouverte pluridisciplinaire HAL, est destin´ee au d´epˆot et `a la diffusion de documents scientifiques de niveau recherche, publi´es ou non, ´emanant des ´etablissements d’enseignement et de recherche fran¸cais ou ´etrangers, des laboratoires publics ou priv´es.
Performance Modeling of Multi-tiered Web Applications with Varying Service Demands Ajay Kattepur Performance Engineering Research Center Tata Consultancy Services Mumbai, India. Email:
[email protected]
Abstract—Multi-tiered transactional web applications are frequently used in enterprise based systems. Due to their inherent distributed nature, predeployment testing for high-availability and varying concurrency are important for post-deployment performance. Accurate performance modeling of such applications can help estimate values for future deployment variations as well as validate experimental results. In order to theoretically model performance of multitiered applications, we use queuing networks and Mean Value Analysis (MVA) models. While MVA has been shown to work well with closed queuing networks, there are particular limitations in cases where the service demands vary with concurrency. This is further contrived by the use of multi-server queues in multi-core CPUs, that are not traditionally captured in MVA. We compare performance of a multi-server MVA model alongside actual performance testing measurements and demonstrate this deviation. Using spline interpolation of collected service demands, we show that a modified version of the MVA algorithm (called MVASD) that accepts an array of service demands, can provide superior estimates of maximum throughput and response time. Results are demonstrated over multi-tier vehicle insurance registration and e-commerce web applications. The mean deviations of predicted throughput and response time are shown to be less the 3% and 9%, respectively. Additionally, we analyze the effect of spline interpolation of service demands as a function of throughput on the prediction results. Keywords-Performance Modeling, Queuing Networks, Mean Value Analysis, Spline Interpolation, Multi-tier Applications.
I. Introduction Web based applications deployed by most enterprises make use of multi-tiered architectures. Each tier provides a particular functionality required for end-to-end transactions. Most web applications consist of a front end (PHP/Python/Perl) Web server for HTTP request processing, a middle-tier (Apache) Application server the implements the enterprise application functionality and a back end (SQL) Database server that stores user and transaction data. The advantages of employing multitiered architectures include: scalability – each tier can be scaled in order to handle superior loads; performance –
Manoj Nambiar Performance Engineering Research Center Tata Consultancy Services Mumbai, India. Email:
[email protected]
due to data caching at one tier, load is reduced on other tiers leading to better performance. Once such a multi-tiered web application has been developed and the software design and implementation frozen, performance testing is performed before deployment. Some of the recent crashes of high-concurrency based web applications (eg. http://www.healtcare.gov “ObamaCare” website crash [1]) highlight the need for accurate predeployment analysis of loads and bottlenecks. For realistic test outputs, the hardware and software platforms should be configured close to production environments. The workload is simulated according to expected concurrency and the response time and throughput values are examined. There are several industry level load testing softwares developed such as HP’s Loadrunner [2] and IBM’s Rational Performance Tester [3]. Tools for performance prediction using fewer load testing samples such as Perfext [4] and TeamQuest [5] have also been developed. This is then reflected in Service Level Agreements (SLAs) for the application. For instance, with 100 users concurrently accessing, the response time should be less than 1 second per page; the maximum CPU utilization with 500 concurrent users should be less than 50%. Accurate theoretical modeling of performance under varying load is a useful basis for comparison with measured load testing data. Moreover, it can also help predict future performance indexes under changes in hardware or assumptions on concurrency. By modeling multi-tiered systems with Queuing Networks, we develop an analytical model for performance analysis. In our work, we make use of Mean Value Analysis (MVA) to analyze these closed queuing networks. MVA is a recursive solution technique to predict performance of closed networks at higher concurrency [6]. While MVA has been applied with considerable success in cases with consistent service demands, we demonstrate that varying service demands (as a function of concurrency) produce considerable deviations in predicted outputs. Varying service demands are pathological in nature for muti-tier systems where the utilization of the CPU|Disk|Network resources of multi-tiered applications do not scale proportionally with higher concurrency. This is further contrived by the fact that multi-processor CPUs
make use of multi-server queues rather than the singleserver queues used in MVA. Inclusion of this variation in service demands into a multi-server variant MVA algorithm, in order to reduce predicted deviations, is the principal problem tackled in this paper. Analysis of changes in service demand has had limited study within the performance modeling community. In most cases, it is either considered constant or averaged out over measurements taken with varying workloads. We propose a solution using an array of service demand collected over varying concurrent loads as an input, called MVASD. By interpolating the service demands using cubic splines [7], we demonstrate prediction of throughput and response time at bottleneck values. This is combined with the multi-server queuing model for MVA proposed in [8]. By updating the slope of estimated throughput and response time values as a function of the service demand slope, predicted results are shown to be close to measured load testing outputs. MVASD is analyzed over vehicle insurance (VINS) and e-commerce (JPetStore) applications that are deployed over multi-tier architectures. Predicted throughput values show less than 3% mean deviation and the cycle times show less than 9% mean deviation. Additional analysis of modeling service demand interpolations using throughput is also studied. This model may be useful for open systems where throughput can be modified much easier rather than increasing the concurrency. Core contributions of this paper are: 1) Demonstrating limitations of multi-server MVA with varying application service demands with workloads 2) Incorporating spline interpolated service demands to generate a new algorithm, MVASD, that accepts an array of service demands 3) Applying MVASD to multi-tiered web applications for superior performance prediction with increasing workloads 4) Analyzing service demands interpolated vs. throughput and concurrency for various samples The rest of the paper is organized as follows: Section II presents an overview of the related work in this area. In Section III, we introduce operational analysis and laws required for performance modeling of multi-tiered systems. Performance testing, monitoring utilization and a brief description of web applications of interest are described in IV. In Section V, we study traditional single-server and multi-server MVA models; the limitations of these models are demonstrated. The upgraded MVASD model which can accept an array of service demands is introduced in Section VI along with detailed analysis of prediction accuracy. The analysis of spline interpolation and models for service demands in presented in Section VII. This is followed by conclusions and future work in Section VIII. II. Related Work Performance load testing [9] has typically been employed post-integration by a dedicated team in most
enterprises. By utilizing tools such as HP’s Loadrunner [2] and IBM’s Rational Performance Tester [3], load and stress tests of applications are run in order to examine performance under varying workloads. Open source alternatives such as The Grinder [10] allow testing for large concurrency without added licensing costs. Analytical models such as queuing networks have been employed by Urgaonkar et al. in [11] to study multitiered web applications. By accurately modeling the cache performance in the queuing network model, they generate more realistic load testing outputs. Impediments to accurate analysis in multi-tiered applications are analyzed in [12]. High-level modeling of 3-tiered web services as queuing networks and subsequent performance analysis is performed in [13]. These include modeling system activity under heavy loads, multiprocessor effects and dependent database queries. The analysis of large-scale J2EE applications in terms of queuing networks and their implications for throughput and response time predictions has been studied in [14]. The demonstration of increase in prediction errors with higher concurrent load is also shown. In [4], Dattagupta et al. makes use of curve fitting to extrapolate measured throughput and response time values in order to predict values at higher concurrencies. Using linear regression for linearly increasing throughput and sigmoid curves for saturation, the extrapolation technique is shown to work well against measured values. The predictor provided by Teamquest [5] provides options to substitute or improve server capacity to improve performance at higher loads. While think times are traditionally set as constants during tests, these have been modeled with realistic user wait time stochastic values in [15]. Mean value analysis (MVA) [6] has been proposed as a recursive technique to estimate performance with incremental increase of loads in closed networks. However, it requires accurate measurements of service demands as inputs to the algorithm. In [16], Luthi et al. propose an extension that can incorporate histograms of values to make up for variabilities in workloads. Rather than using single mean values as inputs, linear and interval splitting techniques are incorporated within the algorithm to generate histograms of outputs. Tools such as [17] allow users to simulate exact and approximate versions of MVA under various constraints. While MVA analysis typically consider single server queuing models, specially for tightly coupled multi-core processors, this has to be modified. Upgrading the approximate MVA algorithm [18] with multi-server factors is studied in [19] and [20]. Modeling service demands to explore unknown intermediate values, using non-linear constrained optimization, is studied in [21]. However, utilizing the measured values to augment prediction techniques has not been analyzed. In our work, we begin with analysis of utilization values with varying concurrent loads. While research has traditionally gone into analysis of workload in a single tier (for instance, web servers in [22]), we study an end-to-end model that
incorporates multiple tiers of software architecture. By making use of the service demand law [6], the service demands are extracted for CPU|Disk|Network utilization of various servers in our analysis. The exact MVA model is also upgraded to handle multi-server queues as proposed in [8]. Keeping this as inputs to the mean value analysis, we demonstrate that improved prediction of performance is possible compared to traditional MVA models. The new MVASD technique is applied to two web applications and is shown to predict throughput and response times within 3% and 9% deviation, respectively. A closely related work is [23], where the MAQ-PRO process is proposed that incorporate analytical modeling to multi-tiered system performance analysis. A modified version of the MVA is proposed that handles errors in MVA inputs by incorporating an “overall service demand” as a function of utilization. Further, MAQ-PRO utilizes an approximation of multi-server MVA [19], which affects prediction accuracy at higher concurrency. In our work, we consider throughput and concurrency to be the input metrics affecting service demand, rather than utilization. These collected service demands are interpolated via splines (as a function of concurrency|throughput) in our model. While Layered Queuing Networks (LQN) have been employed for accurate performance modeling of multi-tiered web applications in [24][25], it does not handle such variations in service demands. We rely on exact MVA and concentrate on the effect of service demands on the throughputs and response times predicted. Similarly, the use of software bottlenecks [26] such as synchronization locks and connection pools have not been considered in our model. It is assumed that an increase in hardware resources results in a scale-up in application performance. III. Operational Analysis In order to perform operational analysis of web applications, we specify the notations in Table I. In our analysis, we consider closed queuing networks with a single class of customers. Here “resources” refer to queuing centers in the system under test that may be hardware (CPU, disk, network) or software (locks, connection pools) based.
We briefly review them; an interested reader is referred to [27] and [6] for further details. • Utilization Law: Utilization is the fraction of time the resource is busy. Devices with high utilization cause bottlenecks. Ui = Xi × Si •
Forced Flow Law: This states that the flows (throughputs) in the system should be proportional. Xi = V i × X
•
(1)
(2)
Service Demand Law: Total average service time required by a customer at resource i, denoted Di . Ui (3) X Little’s Law: A powerful law stated in [28] that relates the number of users in a system with throughput and response times. If there are N users in the system, each with think times Z (time waiting between interactions with the system) and the software application processes at the throughput rate X producing a wait time R, the following relationship applies: Di = Vi × Si =
•
N = X(R + Z)
(4)
We make use of the service demand law and Little’s law in deriving service demands required in proceeding sections. IV. Performance Testing Performance load testing of a web application [9] consists of multiple steps: requirements gathering, script generation, hardware-software test environment setup, test firing, monitoring and analysis. There are some industry standard protocols to be followed such as setting the testing environment within 50% of the deployment environment; realistic think times; long enough test runs to capture steady states; sufficient datapools of users to prevent caching behavior. A. The Grinder Load Tests
For our work we make use of The Grinder [10]: a Java load testing framework capable of running distributed Average number of times customer visits resource i tests using many load injector machines. In The Grinder, Vi worker processes are deployed on individual machines Si Mean service time per customer at resource i (agents); each of these worker processes can deploy worker Ui Utilization of resource i threads that simulate concurrent users. The number of Xi Throughput of resource i simulated users is equal to number of worker threads × X Throughput of the system number of worker processes × number of agents. Scripts Di Service demand of resource i written in python or clojure are controlled during the N Average number of customers in the system run using The Grinder properties file with the following R Average response time of the system typical parameters: grinder.processIncrement is the Z Mean think time of a terminal user interval in milliseconds at which the agent starts new TABLE I worker processes; grinder.runs is the number of runs Notations for Operational Analysis. each worker process will perform. In general, we study in Fundamental laws applicable to queuing networks have steady state performance analysis of the system. So, the been proposed using the operational metrics in Table I. tests are run for sufficiently long time (≈10-15 minutes)
in order to remove transient behavior. The output of The Grinder load test provides the throughput, measured as number of pages served per second by the application and response times, measured as the mean number of seconds taken to load a page, with respect to the number of concurrent users. B. Monitoring Utilization An important aspect to monitor in load tests are utilization levels of CPU|Disk|Network among servers. As we consider LAMP based web applications, the linux based load injecting/web/application/database servers are monitored for the following metrics: • CPU Usage: The vmstat command reports virtual memory statistics regarding process, virtual memory, disk, trap, and CPU activity. • Disk Usage: The iostat iteratively reports terminal, disk, and tape I/O activity. • Network Usage: netstat displays the contents of network-related data structures in various formats, depending on the specified options. We make use of a central network switch and measure the data packets transmitted (Tx) and received (Rx) over the network. Over a monitored period t, assuming a 1 GBps network connection between servers, the utilization is calculated as: # packets Tx|Rx over t × packet size × 100 Util.% = t × network bandwidth (5) In this work, we treat memory usage as an orthogonal metric that can be increased sufficiently as a function of CPU utilization, to prevent it becoming a bottleneck. Also note that we include load injecting servers, that are typically outside the system of interest, in our analysis model. This is to study all aspects of service demands that contribute to end-to-end response times. Most load tests monitor the load generating server to prevent it from becoming the bottleneck in the analysis. C. Vehicle Insurance Application (VINS) VINS is a web application developed in house at the Performance Engineering Research Center, Tata Consultancy Services for registration of vehicle insurance. The VINS application consists of four workflows: 1) Registration - The customer is able to register his/her personal and vehicle details for insurance. 2) New Policy - A new policy is generated with respect to a registered vehicle. 3) Renew Policy - A policy can be renewed after it expires; the current value, sum and premium is generated based on a formula. 4) Read Policy Details - The customer can view his/her personal, vehicle and policy details. In our work, we concentrate on the Renew Policy workflow of the VINS application which consists of 7 individual pages included in each performance test. In order to
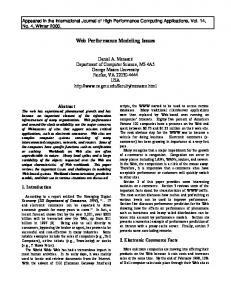
generate generate large amount of virtual data need to be loaded in databases for VINS, an in house data generator is used: it generates 10 GB (13,000,000 customers) of data within 50 minutes. D. e-Commerce Application (JPetStore) JPetStore [29] is an open source version of Sun’s Pet Store application that has been routinely used for performance benchmarking. It can be deployed on a multi-tiered architecture using Apache web/application front-end and an SQL back-end. This e-commerce application for buying pets has multiple pages in its workflow, where customers may login, browse categories (birds, fishes, reptiles, cats, dogs), choose pets, update them to the cart and checkout payments. For our study, we populate 2, 000, 000 items into the database for viewing and selection by customers. V. Mean Value Analysis In order to model the load testing scenario as a closed queuing network, we make use of Fig. 1. Each of the load generating, web/application and database servers have individual queues for CPU|Disk|Network as described in Section IV and are modeled to be product-form [6]. The think time adds delay in between successive calls to the servers from populated concurrent users. Though load testing servers are typically not a part of the environment under test, we include utilization of these servers in order to analyze end-to-end service demands during load tests. Note that we only consider hardware resources in our modeling. Software bottlenecks [26] such as those caused by synchronization locks or limited connection pools within the application are assumed to be tuned prior to performance analysis. Load Injecting Server
Multi-core CPU
Disk
Network Rx
Network Tx
Web/Application Server
Think Time
Multi-core CPU
Disk
Network Rx
Network Tx
Database Server
Multi-core CPU
Fig. 1.
Disk
Network Rx
Network Tx
Queuing Network Model for Performance Testing.
A. Single-Server Exact MVA Mean value analysis (MVA) [6] has been applied with considerable success in the case of closed queuing networks in order to predict performance at higher work loads. We make use of single class models wherein the customers are assumed to be indistinguishable from one another. The exact MVA algorithm [6] starts with an empty network; it
then increases the number of customers by 1 at each iteration until there are the required number (N ) of customers in the system. For each queuing station k = 1, ..., K, the waiting time Rk is computed using the static input service demands Sk and the number of jobs in the queue Qk as: Rk = Sk (1 + Qk )
(6)
The system throughput is then computed using the sum of waiting times at each node and Little’s law (eq. 4). Finally, Little’s law is applied to each queue to compute the updated mean queue lengths for k = 1, ..., K. Another popular implementation is Schweitzer’s approximation of MVA [18] estimates the average number of jobs at node k to be: N −1 n −1 Qk (7) QN ≈ k N which produces faster results compared to exact MVA, especially at higher concurrency N . B. Multi-Server Exact MVA Both exact and approximate MVA consider queues with a single server – this requires modification in case of multiserver queues, such as those found in tightly coupled multicore CPU processors. Heuristically, this has been done by normalizing the service demand by the number of CPU cores employed; however, this approximation can lead to modeling errors, especially at higher concurrency [6]. In the work done by [19] and [20], a correction factor is proposed that incorporates the number of servers Ck at each queuing station k. These are incorporated into Schweitzer’s approximation of MVA [18] to model multiserver queues. However, as this is based on the approximate version of MVA, errors in prediction compounded with variation in service demands can lead to inaccurate outputs. As we intend to use the exact version of MVA, we make use of the correction factor proposed in [8]: Rk =
Ck X Sk (1 + Qk + (Ck − j)pk (j)) Ck j=1
(8)
where pk (j) represents the marginal queue size probabilities that are recursively updated for each multi-server queue, Ck represents the number of servers in the multiserver queue. Marginal probabilities give the probability values of random variables in the subset without reference to probability values of other variables. This is incorporated with exact MVA in Algorithm 1. Notice that for Ck = 1 (single-server), this reduces to eq. 6. The updated values calculates the utilization of each server (core in CPU context) and updates the probability of the queue being empty. For the rest of the paper, we refer to this algorithm as exact multi-server MVA. C. Performance Modeling with Multi-Server MVA In order to compare the predicted output of the MVA algorithm and the actual performance of the VINS application, a set of load tests were performed to collect
Algorithm 1: Exact Mean Value Analysis (MVA) Algorithm with Multi-Server Queues [8]. Input: Set of queuing stations k ∈ K each with number of servers Ck ; Corresponding Service demands Sk , Visit counts Vk ; Number of concurrent users N ; Think time Z; Output: Throughput Xn with increasing concurrency n ∈ N ; Response time Rn with increasing concurrency n ∈ N ; for k ← 1 to K do Initialize queue at each station: Qk ← 0 Initialize multi-server marginal probabilities: pk (1) ← 1 for j ← 2 to Ck do pk (j) ← 0 for n ← 1 to N do for k ← 1 to K do Multi-server PCk queue correction factor: Fk ← j=1 (Ck − j)pk (j) Response time at each station: Sk Rk ← C (1 + Qk + Fk ) k Total response times using visit counts: PK Rn ← k=1 Vk Rk n Throughput with Little’s Law: Xn ← n R +Z for k ← 1 to K do Update queues at each station: Qk ← Xn Vk Rk Update multi-server marginal PCk probabilities: pk (1) ← 1 − C1k (Xn Sk + j=2 pk (j)) for j ← 2 to Ck do pk (j) ← 1j Xn Sk pk (j − 1) return Xn , Rn
response time and throughput values at varying levels of concurrency. The application was deployed on 16 - core CPU machines, 10 GB of data on the database, with datapool of 200,000 users and think times of 1 second. The Grinder tests were run with concurrency varying from 1 to 1500 users (varying number of processes and threads) for 100 runs on the Renew Policy workflow (7 pages). In Table II, the utilization values are used in conjunction with the service demand law (eq. 3) to extract the service demands at individual queuing stations. We assume that the mean throughput levels X can be estimated either through historic access logs or monitoring visit counts at CPU|Disk|Network access points. As seen, with increased concurrency, the load injecting server disk and the database server disk reach near-saturation (in red). Collected throughput and service demand values are utilized as inputs to Algorithm 1. In Fig. 2 compared to the measured values from The Grinder, there are significant deviations in outputs provided by Algorithm 1. Here, the
Users 1 20 105 203 504 1001 1204 1503
CPU 0.648 0.95 2.14 3.46 7.95 15.55 17.485 21.566
Load Server Disk Net-Tx 0.032 0.004 0.565 0.058 2.74 0.281 11.365 0.545 35.13 1.38 71.1 2.75 74.85 3.29 88.76 4.08
Net-Rx 0.003 0.032 0.131 0.256 0.639 1.29 1.56 1.95
CPU 0.278 0.37 0.69 1.32 2 3.55 4.12 5.66
Application Server Disk Net-Tx Net-Rx 0.052 0.0024 0.0038 0.015 0.043 0.077 0.015 0.226 0.405 0.095 0.438 0.783 1.08 0.956 1.783 0.024 1.692 3.241 0.03 1.983 3.807 0.037 2.33 4.12
CPU 0.75 3.47 8.92 13.15 19.625 36.23 33.67 34.98
Database Server Disk Net-Tx 0.44 0.0014 8.22 0.026 19.92 0.136 25.9 0.263 36.43 0.455 71.9 0.568 67.61 0.598 92.75 0.543
Net-Rx 0.0009 0.021 0.109 0.21 0.372 0.485 0.518 0.65
TABLE II Utilization % observed during Load Testing of the VINS application.
While there are improvements when service demands are taken at higher concurrency levels, it would mean testing until near-saturation to generate inputs for the algorithm. As this model fails to meet expected outputs, we explore the possibility of using an extended version of MVA that accepts an interpolated array of service demands in the next section. VI. MVASD: Multi-Server MVA with Varying Service Demands
Fig. 2. Throughput and Response Time model outputs generated by Algorithm 1 in the VINS application.
label MVA i refers to outputs produced by the algorithm when input with service demands measured at concurrency level i (for instance, MVA 203 refers to inputing service demands S203 collected with concurrency 203 as input to k Algorithm 1). Note that even for single user tests, the sum of collected service demands do not exactly add up to the response time provided in The Grinder. This further demonstrates the overheads that might occur internally at the CPU, disk or network level, which complicates accurate modeling of these applications.
Fig. 3.
Service Demands for the VINS Database Server.
As service demands Sk are the key inputs needed for MVA, we plotted the observed service demands for the database server in Fig. 3. Due to variations in individual service demands at changing concurrency, the outputs produced at each run of Algorithm 1 considerably varies.
In case of variable service demands that change as a function of concurrent users N , incorporating an array of service demands into the MVA in crucial. Indeed, in papers such as [23] and [16], this issue has been identified with heuristic models. We propose Algorithm 2 that incorporates service demands collected at unique points: this algorithm is referred to as MVASD. Typically this can be done using statistical analysis of log access files to check utilization levels of CPU|Disk|Network at various queuing nodes. While the measured service demands {Sik1 , ..., SikM } is measured at only M points, these are interpolated in order to generate values over each interval n. The set of service demands SSnk (using Service Demand Law, eq. 3), represent the changes in demand with increasing concurrency. The updated response time iterative update model is: Rk =
Ck X SSnk (1 + Qk + (Ck − j)pk (j)) Ck j=1
(9)
The changes in Algorithm 2 with respect to Algorithm 1 have been highlighted in red. For the function h used to generate the array of service demands in Algorithm 2, we interpolate using splines. In spline interpolation [7], if (xi , yi ) are modeled such that x1 , x2 , ..., xn are a sequence of observations with the relation yi = h(xi ). The ˆ of the function h is defined smoothing spline estimate h to be the minimizer: Z xn n X ˆ i ))2 + λ ˆ 00 (x)2 dx (yi − h(x h (10) i=1
x1
where, λ ≥ 0 is a smoothing parameter, controlling the trade-off between fidelity to the data and roughness of the function estimate.
Algorithm 2: Exact Mean Value Analysis Algorithm with Multi-Server Queues, Varying Service Demands (MVASD). Input: Set of queuing stations k ∈ K each with number of servers Ck ; Corresponding Service demands Sk , Visit counts Vk ; Number of concurrent users N ; Think time Z; Interpolation function h; Output: Throughput Xn with increasing concurrency n ∈ N ; Response time Rn with increasing concurrency n ∈ N ; for k ← 1 to K do Initialize queue at each station: Qk ← 0 Initialize multi-server marginal probabilities: pk (1) ← 1 for j ← 2 to Ck do pk (j) ← 0 for n ← 1 to N do for k ← 1 to K do Multi-server PCk queue correction factor: Fk ← j=1 (Ck − j)pk (j) Array of Abscessa at which service demands have been collected: ak ← {i1 , ..., iM } Array of Service demands for each station: bk ← {Ski1 , ..., SikM } Interpolated Service demands generated with interval n: SSnk ← h(ak , bk , n) Responsentime at each station: SS Rk ← Ckk (1 + Qk + Fk ) Total response times using visit counts: PK Rn ← k=1 Vk Rk n Throughput with Little’s Law: Xn ← n R +Z for k ← 1 to K do Update queues at each station: Qk ← Xn Vk Rk Update multi-server marginal PCprobabilities: k pk (1) ← 1 − C1k (Xn SSnk + j=2 pk (j)) for j ← 2 to Ck do pk (j) ← 1j Xn SSnk pk (j − 1) return Xn , Rn
Specifically, we make use of the interp() function in Scilab [30] that generates a continuous and derivable piecewise function h(X) defined over [x1 , xn ]. It consists of a set of cubic polynomials, each one qm (X) being defined on [xm , xm+1 ] and connected in values and slopes to both its neighbours. Thus, over [xm , xm+1 ] we have h(X) = qm (X) and h(xi ) = yi . The interp() function evaluates h(X) and subsequent derivatives h0 (X), h00 (X), h000 (X): yqi = h(xqi ); yqi2 = h00 (xqi );
yqi1 = h0 (xqi ); yqi3 = h000 (xqi )
(11)
Further, we specify that outside the sampled [x1 , xn ], the extrapolation model follows: xqi < x1 ⇒ yqi = y1 xqi > xn ⇒ yqi = yn
(12)
which pegs the boundary interpolated values to output extrapolation. The function h captures the variance in service demand generated with increasing concurrency. A. Performance Modeling with MVASD
Fig. 4. Throughput and Response Time model outputs generated by Algorithms 1 and 2 in the VINS application.
We continue the prediction model for the VINS application as specified in Section V-C, where multi-server MVA does not predict accurately (Fig. 2). We input the generated array of service demands (using Table II) into Algorithm 2. As shown in Fig. 4, when the array of collected service demands were input to MVASD, the outputs of spline interpolated service demand produce predictions close to measured values. The outputs are clearly superior to those developed with Algorithm 1 (chosen with varying concurrency MVA i), as we control the slope of the throughput curves, using the interpolated service demands. In order to re-test the performance of the algorithms, the JPetStore application [29], consisting of 14 pages was used. For this, 16 - core CPU machines, 1 GB initial data in the data server, datapool 125,000 users and think time of 1 second were employed. Table III shows the utilization percentages observed with increasing concurrency. Due to the large size of entries (2,000,000) generated for the load test, we notice saturation of CPU and disk with ≈ 140 users (shown in red). In Fig. 5, we compare performance of exact MVA singleserver [6] using normalized service demands for multiserver CPUs (dividing the service demand by the number
Users 1 14 28 70 140 168 210
CPU 0.07 0.27 0.68 1.24 0.58 0.352 0.476
Load Disk 0.003 0.0036 0.003 0.0032 0.004 0.0024 0.0032
Server Net-Tx 0.0014 0.0114 0.025 0.021 0.037 0.0343 0.036
Net-Rx 0.0076 0.067 0.18 0.115 0.21 0.23 0.2
CPU 0.07 0.62 1.05 1.596 2.12 1.55 1.63
Application Server Disk Net-Tx Net-Rx 0.0045 0.051 0.058 0.0064 0.684 0.77 0.004 1.22 1.38 0.0052 1.83 1.99 0.005 2.466 2.75 0.0028 1.895 2.01 0.0075 2.128 2.31
CPU 6.0 41.5 69.5 79.0 89.25 89.0 86.25
Database Server Disk Net-Tx Net-Rx 4.0 0.0054 0.0516 16.0 0.0677 0.686 31.0 0.12 1.214 75.0 0.172 1.83 95.0 0.251 2.64 96.0 0.172 1.857 96.0 0.201 2.147
TABLE III Utilization % observed during Load Testing in the JPetStore application.
of CPU cores). This is a version of exact MVA (eq. 6) that uses normalized service demands rather than the probabilities introduced in Algorithm 1. The interpolation of these service demands used in Algorithm 2 is maintained, hence referred to as MVASD: Single Server (multi-server queues normalized as a single server). We notice deterioration in predicted performance with both throughout and response time deviations greater than those produced by Algorithm 2. This is specially crucial when the bottleneck in the performance is due to CPU utilization, as it is in the case of this example. This demonstrates the need for accurate multi-server MVA models (as proposed in [8]), that can have significant impact on performance prediction. Fig. 5 demonstrates the outputs of Algorithms 1 and MVASD (2) on the JPetStore application. As expected, MVASD performs well and is even able to pick up the deviation in throughput between 140 and 168 users. The exact multi-server MVA does not offer this level of precision even with inputs of service demands collected at higher concurrency. Depending on the concurrency level at which service demands are collected, Algorithm 1 varies in efficacy of outputs. As utilization data is an important factor in determining the hardware bottleneck among available resources, we analyze the predicted outputs for the database server performance with measured utilization in Fig. 6. As expected from Table III, we see the CPU and disk utilization reach saturation levels at > 140 users. We notice that the predicted utilization curves from MVASD follow measured values closely, as a consequence of the spline interpolation of service demands.
Fig. 5. Throughput and Response Time model outputs generated by Algorithms 1 and 2 in the JPetStore application.
B. Prediction Accuracy Table IV and V display the mean deviations seen for throughput (pages/second) and Response Time (cycle time R + Z) generated by various models. The mean % deviation after considering M measured observations is defined as: PM |Predicted(m)−Measured(m)| × 100 m=0 Measured(m) %Deviation = M (13) The lowest deviations are seen by the MVASD outputs; with Algorithm 1, there are considerable deviations seen when service demand collected at varying concurrency i is input into MVA i. This shows the importance
Fig. 6. Utilization of the Database Server for the JPetStore application predicted via MVASD Algorithm 2.
of studying the underlying service demand as a function of concurrency and incorporating this into MVA. As varying service demands are pathologically seen in multi-tiered systems, it is a critical aspect that is often overlooked in performance modeling. Similarly, we ob-
serve that MVASD:Single-Server models under perform in prediction; thus, incorporating a multi-server model that closely follows multi-core CPU performance is also necessary for accurate analysis. Metric Throughput (Pages/second)
Response Time (Cycle Time) R+Z
Model MVASD MVA 203 MVA 1001 MVA 1204 MVASD MVA 203 MVA 1001 MVA 1204
Deviation (%) 2.298 24.62 2.885 2.81 8.61 100.83 6.046 10.73
TABLE IV Mean Deviation in Modeling the VINS application. Metric Throughput (Pages/second)
Response Time (Cycle Time) R+Z
Model MVASD: Single-Server MVASD MVA 28 MVA 70 MVA 140 MVA 210 MVASD: Single-Server MVASD MVA 28 MVA 70 MVA 140 MVA 210
Deviation (%) 10.42 0.558 18.94 5.44 7.79 4.03 7.283 1.2 21.12 6.76 8.59 2.37
TABLE V Mean Deviation in Modeling the JPetStore application.
VII. Modeling Service Demands with Splines
increased workload: caching of resources at CPU|Disk to improve efficient processing, batch processing at CPU|Disk and superior branch prediction at CPU. We also examined the effect of service demand vs. throughput rather than against concurrency. Typically, service demand has been modeled as a function of concurrency and think time. However, generating splines with respect to increasing throughput can lead to more tractable models when using open systems, where throughput can be easier measured. It was noted that the general trend of service demands was similar to Fig. 7; however, the predicted outputs for throughput and response times (JPetStore) showed higher deviation: 6.68% for throughput and 6.9% for response time. Accurately quantifying the service demand as a function of concurrency, think time and throughput is a useful input for most prediction models. In Fig. 8, we analyze the variation in interpolated service demands in Scilab generated for the Database Server in JPetStore. As seen, with just 3 samples (concurrency 1, 14, 28), the deviation in generated interpolation is more than for 5 samples (concurrency 1, 14, 28, 70, 140) and 7 samples (concurrency 1, 14, 28, 70, 140, 168, 210). Essentially, this demonstrates that higher the spread of collected service demands, better the interpolation and consequently closer the predicted outputs. As the service demand evolves with concurrency – finding a general representation of this with a few samples is a challenge and will be explored in future work. Although both VINS and JPetStore applications were deployed on the same hardware specifications, from Fig. 7 and Fig. 8, we notice considerable changes in Database service demand splines. This shows that a general profiling of the underlying hardware does not help in estimating service demand variations. Application specific performance modeling through utilization of CPU|Disk|Network resources and throughput and varying concurrency, is necessary for accurate performance profiling.
Fig. 7. Spline Interpolated Service Demands for the Database Server in the VINS application.
In order to implement MVASD, the collected service demands were interpolated with splines. Fig. 7 demonstrates the interpolated service demands produced via spline interpolation in Scilab on the VINS Database Server service demands. We notice that the polynomial splines generated overlap with the measured points and interpolates values that are not sampled. In general, the trend of the curves show that service demand decreases with increase in workload. Possible explanations that suggest making up for increased contention of hardware resources with
Fig. 8. Splines generated for the Database Server with various Samples for the JPetStore application.
VIII. Conclusions Mean Value Analysis (MVA), while successful for extrapolation of throughput and response time values in closed queuing networks, suffers under varying service demands. As this problem is pathological in multi-tiered systems, where utilization of CPU|Disk|Network varies with increasing concurrency, improvements in traditional MVA techniques are needed. In this paper, we have analyzed the use of an alternative version of the MVA algorithm that can accept an array of service demands. By employing the classic service demand and Little’s laws, inputs needed to estimate throughput and response time under higher concurrent loads are generated. Utilizing spline interpolation of service demands, we generate an array of values that provide superior estimates, and refer to this technique as MVASD. Modeling vehicle insurance and e-commerce web applications, MVASD yields accurate performance models within 3% and 9% deviation for throughput and response time, respectively. This prediction technique can handle multi-server, multi-tier queues along with service demands collected over varied horizons of concurrency. Further, we have analyzed spline interpolated service demands as a function of throughput, which can be applied to open systems. Our future work includes the analysis of minimum number of service demand points traded-off against accuracy, for performance prediction. Service demand interpolation can also be implemented with other performance models such as Layered Queuing Networks to test for improved prediction results. Acknowledgment The authors would like to thank Dr. Rajesh Mansharamani for the invaluable discussions and feedback for improvements of this paper. Additional thanks to Mr. Rupinder Virk for help in setting up the experimental test-beds. References [1] Ed Payne, Matt Smith and Tom Cohen, “Report: Healthcare website failed test ahead of rollout”, CNN, October 23, 2013. [2] Loadrunner, Hewlett-Packard, http://www8.hp.com/in/en/ software-solutions/loadrunner-load-testing/, 2014. [3] Rational Performance Tester, IBM, http://www-03.ibm.com/ software/products/en/performance, 2014. [4] Subhasri Duttagupta and Rajesh Mansharamani , “Extrapolation tool for load testing results,” Intl. Symp. on Performance Evaluation of Computer & Telecommunication Systems (SPECTS), 2011. [5] Performance Predictor, TeamQuest, http://www.teamquest. com/, 2014. [6] Edward D. Lazowska, John Zahorjan, G. Scott Graham and Kenneth C. Sevcik, “Quantitative System Performance: Computer System Analysis Using Queuing Network Models,” Prentice-Hall, 1984. [7] Carl de Boor, “A Practical Guide to Splines,” Springer Applied Mathematical Sciences, vol. 27, 2001. [8] M. Reiser and S. S. Lavenberg, “Mean-Value Analysis of Closed Multichain Queuing Networks,” Journal of ACM, vol. 27, no. 2, pp. 313–322, 1980. [9] Daniel A. Menasce, “Load Testing of Web Sites,” IEEE Internet Computing, pp. 70-74, 2002.
[10] P. Aston and C. Fitzgerald, The Grinder, http://grinder. sourceforge.net/, 2013. [11] B. Urgaonkar, G. Pacifici, P. Shenoy, M. Spreitzer and A. Tantawi, “An Analytical Model for Multi-tier Internet Services and Its Applications,” Proc. of ACM SIGMETRICS International Conference on Measurement and Modeling of Computer Systems, 2005. [12] N. Roy, A. Gokhale and L. Dowdy, “Impediments to Analytical Modeling of Multi-Tiered Web Applications,” IEEE Intl. Symp. on Modeling, Analysis and Simulation of Computer and Telecommunication Systems (MASCOTS), pp. 441–443, 2010. [13] X. Liu, J. Heo and L. Sha, “Sha Modeling 3-tiered Web applications,” IEEE Intl. Symp. on Modeling, Analysis, and Simulation of Computer and Telecommunication Systems, 2005. [14] S. Kounev and A. Buchmann, “Performance Modeling and Evaluation of Large-Scale J2EE Applications,” 29th Intl. Conf. of the Computer Measurement Group (CMG), Dallas, TX, 2003. [15] D. Draheim, John Grundy, J. Hosking, C. Lutteroth and G. Weber, “Realistic load testing of Web applications,” Proc. of 10th Intl. Conf. on Software Maintenance and Reengineering, 2006. [16] J. Luthi, S. Majumdar and G. Haring, “Mean Value Analysis for Computer Systems with Variabilities in Workloads”, Proc. of IEEE Intl. Symp. Computer Performance and Dependability Symposium, 1996. [17] M. Bertoli, G. Casale and G. Serazzi, “JMT: performance engineering tools for system modeling,” ACM SIGMETRICS Performance Evaluation Review, vol. 36, no. 4, 2009. [18] P. Schweitzer, “Approximate analysis of multiclass closed networks of queues,” Proc. of Intl. Conf. on Stochastic Control and Optimization, 1979. [19] Rajan Suri, Sushanta Sahu and Mary Vernon, “Approximate Mean Value Analysis for Closed Queuing Networks with Multiple-Server Stations,” Proc. of the Industrial Engineering Research Conference, 2007. [20] Yuki Nakamizo, Hiroshi Koide, Kazumi Yoshinaga, Dirceu Cavendish and Yuji Oie, “MVA Modeling of Multi-core Server Distributed Systems,” 3rd Intl. Conf. on Intelligent Networking and Collaborative Systems, 2011. [21] Daniel A. Menasce, “Computing Missing Service Demand Parameters for Performance Models,” Proc. of the Computer Measurement Group (CMG) Conf., Las Vegas, NV, 2008. [22] John Dilley, Rich Friedrich, Tai Jin and Jerome A. Rolia, “Measurement Tools and Modeling Techniques for Evaluating Web Server Performance,” Proc. of the 9th Intl. Conf. on Computer Performance Evaluation: Modeling Techniques and Tools, 1997. [23] N. Roy, A. Dubey, A. Gokhale and L. Dowdy, “A Capacity Planning Process for Performance Assurance of Component-based Distributed Systems,” Proc. of 2nd ACM/SPEC International Conference on Performance Engineering, 2011. [24] Yasir Shoaib and Olivia Das, “Web Application Performance Modeling Using Layered Queuing Networks”, Fifth Intl. Wksp. on the Practical Application of Stochastic Modeling (PASM), 2011. [25] C. M. Woodside, J. E. Neilson, D. C. Petriu and S. Majumdar, “The Stochastic Rendezvous Network Model for Performance of Synchronous Client-Server-Like Distributed Software”, IEEE Transactions on Computers, vol. 44, no. 1, pp. 20–34, 1995. [26] Daniel A. Menasce, “Simple analytic modeling of software contention,” ACM SIGMETRICS Performance Evaluation Review, vol. 29, no. 4, pp. 24–30, 2002. [27] Peter J. Denning and Jeffrey P. Buzen, “The Operational Analysis of Queuing Network Models,” ACM Computing Surveys, vol. 10, no. 3, 1978. [28] John D. C. Little, “A Proof for the Queuing Formula: L = λW ,” Operations Research, vol. 9, no. 3, pp. 383-387, 1961. [29] JPetStore, iBATIS, http://sourceforge.net/projects/ ibatisjpetstore/, 2013. [30] Scilab, Scilab Enterprises, http://www.scilab.org/, 2014.