Performance Monitoring and Visualization of Grid Scientific Workflows in ASKALON ⋆ Peter Brunner, Hong-Linh Truong ⋆⋆ and Thomas Fahringer Institute of Computer Science, University of Innsbruck {brunner, truong, tf}@dps.uibk.ac.at
Abstract. The execution of scientific workflows in Grids can imply complex interactions among various Grid applications and resources spanning multiple organizations. Failures and performance problems can easily occur during the execution. However, online monitoring and detecting failures and performance problems of scientific workflows in Grids is a nontrivial task. So far little effort has been spent on supporting performance monitoring and visualization of scientific workflows for the Grid. In this paper we present an online workflow performance monitoring and visualization tool for Grid scientific workflows that is capable to monitor the performance and to detect failures of Grid workflows. We also support sophisticated visualization of monitoring and performance result. Performance monitoring is conducted online and Grid infrastructure monitoring is integrated with workflow monitoring, thus fostering the chance to detect performance problems and being able to correlate performance metrics from different sources.
1 Introduction Scientific workflows commonly compose several scientific tools and applications to perform complex experiments. The execution of scientific workflows in Grids frequently implies large amounts of complex interactions among various, diverse Grid applications and resources spanning multiple organizations. Due to the complexity and the diversity of both Grid workflows and resources, failures and performance problems can easily occur during runtime of Grid workflows. To monitor and detect failures and performance problems as early as possible at runtime is a key requirement from the scientific workflows community in the Grid. However, until now performance monitoring and analysis tools for Grid scientific workflows are not well supported. Most research effort is dedicated to developing workflow languages and execution engines, as shown in [1]. Many existing Grid monitoring tools [2] do not support Grid scientific workflows. In this paper we present an online performance monitoring and visualization tool for Grid scientific workflows. The tool can monitor performance, detect failure of Grid scientific workflows, and present the monitoring and performance result through a sophisticated, but easy to use, visualization. Performance monitoring is conducted online, during the execution of the Grid ⋆
The work described in this paper is supported by the European Union through the IST-2002511385 project K-WfGrid. ⋆⋆ Corresponding author. Email:
[email protected]
workflows, and infrastructure monitoring is also integrated. The user can observe the performance of workflows as well as the Grid resources the workflow consumes by requesting and analyzing monitoring data of Grid infrastructure in parallel with application monitoring and analysis. As a result, the tool increases the probability to detect performance problems. Moreover it can correlate performance metrics from different sources. A prototype of this tool has been integrated into ASKALON environment [3] for developing scientific workflows in the Grid. The rest of this paper is organized as follows: Section 2 outlines the ASKALON workflow system. In Section 3 we describe the architecture of our performance monitoring and visualization tool. Section 4 details techniques and features for performance monitoring, instrumentation and visualization of Grid scientific workflows. We illustrate experiments in Section 5. Related work is discussed in Section 6. Section 7 summarizes the paper and gives an outlook to the future work.
2 The ASKALON Environment Our work on performance monitoring and visualization of scientific workflows in Grids is conducted in the framework of the ASKALON environment. ASKALON [3] is a Grid application development and computing environment which provides services for composing, scheduling and executing scientific workflows in the Grid. The main services in ASKALON are the Resource Manager, which is responsible for negotiation, reservation, allocation of resources and automatic deployment of services; the Scheduler, which determines effective mappings of workflows onto the Grid; and the distributed Execution Engine (EE), which is responsible for the reliable and fault tolerant execution of workflows. All ASKALON middleware services implement WSRF [4] by using Globus Toolkit 4.0 [5]. In ASKALON a user can compose Grid workflow applications using a UML-based workflow composition or can describe workflows using the XML-based Abstract Grid Workflow Language (AGWL). After the composition, the workflow is executed by the execution engine. By using ASKALON a user designs a workflow, submits the workflow and observes the execution of the workflow on selected Grid sites. Performance bottlenecks and failures can occur at any time during the execution. A performance monitoring and visualization tool for scientific workflows enriches ASKALON by allowing users to monitor their running activities on selected Grid sites and to detect failure and abnormal behavior in Grid middleware.
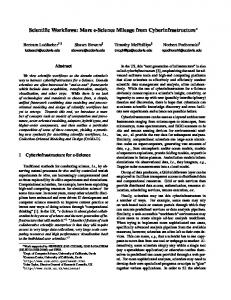
3 Architecture of Workflow Performance Monitoring and Visualization Tool Figure 1 depicts the architecture of the performance monitoring and visualization tool for Grid workflows within ASKALON. The performance monitoring and visualization tool relies on the SCALEA-G monitoring middleware [6] for collecting Grid infrastructure and application monitoring data. SCALEA-G services use peer-to-peer technology to communicate with each other and they can retrieve and store multiple types of monitoring data from diverse sensors.
At the client side, the main GUI of the performance tool is integrated with the ASKALON IDE. From the IDE the user can compose workflows, submit them to the EE, and perform the performance monitoring and analysis of the workflows. Within distributed EEs, we have sensors capturing execution status of workflows. The sensors send monitoring data to SCALEA-G services which propagate the monitoring data to the main component (PerfMonVis) of the performance tool via subscription/query mechanism. On Grid sites where scheduled workflows are executed, sensors are also used to monitor Grid resources; these sensors provide the infrastructure information (e.g., machine and networks) of Grid sites. At the client side, monitoring data of Grid workflows and resources are received through data subscription and query. Monitoring data is analyzed and the performance results and failures are then visualized in the GUI.
Fig. 1. Architecture of workflow performance monitoring and visualization tool
4 Online Performance Monitoring and Visualization 4.1 Instrumentation and Monitoring Data The execution of a Grid workflow is controlled by the EE under the guidance of the scheduler. However, invoked applications which perform the real work specified in workflow activities will be executed on distributed Grid sites by local Grid resource allocation and management (GRAM). To monitor the performance of Grid workflows, it is necessary to collect monitoring data not only within EEs but also at Grid sites. To obtain workflow monitoring data we statically instrument EEs, which control job and data submissions to different Grid sites. Through the instrumentation, sensors
are manually inserted into EEs to capture all the events associated with the workflow. These events are then sent to the SCALEA-G middleware. Based on that they can be retrieved by the performance tool or any services or clients which are interested in obtaining workflow events. For instrumentation and monitoring at Grid sites, currently we have infrastructure sensors deployed in Grid sites. These sensors are used to monitor Grid resources and middleware services, e.g., capturing machine information, network bandwidth, and availability of GRAM and GridFTP. However, our previous work on instrumentation of Grid applications [7] has not been integrated into ASKALON. We use a generic schema to describe various types of events. Basically, an event has an event name and an event time indicating the time at which the event occurs. Every event has event attributes that hold detailed monitoring data associated with the event. Event attribute can be used to store any interesting data, for example computational nodes on which an invoked application is executed, the source and the destination of a file transfer between activities, etc. Table 1 presents a few events captured in our system and Table 2 presents examples of event attributes. Event Name Description initialized the activity has been initialized queued the activity gets in the EE queue submitted the activity has been submitted to the Grid site active the activity is active suspended the activity is suspended completed the activity is completed failed the activity is failed canceled the activity is canceled Table 1. Examples of workflow events
Attribute Name Description ACTIVITY-NAME original name of the activity ACTIVITY-INSTANCE-ID name of the activity instance ACTIVITY-TYPE type of activity ACTIVITY-PARENT-NAME parent name of the activity instance COMPUTATIONALNODE machine on which the activity is running SOURCE-ID source activity of a file transfer DESTINATION-ID destination activity of a file transfer Table 2. Examples of event attributes
Currently, all monitoring data collected is represented in XML form. Figure 2 presents examples of real events captured. In Figure 2(a) is an initialized event of a computational activity; the event consists of activity instance ID, the type of activity, the name of the parent instance. In Figure 2(b) is a completed event of a file transfer between two activity instances named first-4 and second-75. 4.2 Online Monitoring and Visualization Monitoring data collected from different sources, such as distributed EEs and Grid sites, is published into the SCALEA-G middleware. Each type of monitoring data is identified
activity_initialized activity_completed 1142499781204 1142499880862 ACTIVITY_NAME ACTIVITY_INSTANCE_ID first first/fVns1142499878780 ACTIVITY_INSTANCE_ID first_4 SOURCE_ID first_4 ACTIVITY_TYPE ControflowController DESTINATION_ID second_75 ACTIVITY_PARENT_NAME ACTIVITY_TYPE FileTransfer whileBody_0_3
(a)
(b)
Fig. 2. Examples of representation of events: (a) computational activity, (b) data transfer
by a tuple (dataTypeID, resourceID), for example in case of workflow events the tuple (wf.pma, 0c08d950-9979-11da-88a8-9ac1d10ab445) indicates all events associated with the workflow whose UUID is 0c08d950-9979-11da-88a8-9ac1 d10ab445. The workflow performance monitoring and visualization tool can subscribe and/or query any monitoring data type of interest. In our tool, during the execution of a workflow, when the user starts to conduct the performance monitoring and analysis, the performance tool will subscribe all workflow events associated with the workflow. The tool will analyze events received and visualize performance results as well as failure detected in its GUI. Depending on the resulting analysis, the tool can subscribe/query other data types in order to find sources of problems. For example, if a workflow activity cannot be submitted to a Grid site, the user can query the monitoring data about the availability of local resource management on that Grid site. The performance monitoring and visualization tool analyzes large amounts of diverse monitoring data and presents the result in an understandable way to the user. In ASKALON, our performance tool provides the following functionalities for online monitoring and visualization of Grid workflows: – Monitoring of execution phases of Grid workflows. The user can monitor and analyze execution phases, e.g., queuing and processing, of Grid workflows during runtime. Detailed execution information of every single activities can be analyzed. – Monitoring of data transfer between Grid sites. Monitoring of data transfer between Grid sites is an important feature. The user can observe the data transfer between activity instances through the visualization. Moreover, a specific data transfer can also be selected for analysis, for example to examine transfer time.
– Interactive analysis of different activities. The user can compare the execution of different running activities, for example examining different performance metrics of the selected activities, load imbalances or overheads. This feature is particularly useful for analyzing parallel regions in scientific workflows. – Analysis and comparison of activity distribution and allocation for Grid sites. How activities distributed to Grid sites as well as the utilization of Grid sites can be analyzed and compared. Allowing the user to select Grid sites that the user wants to analyze is a useful feature because if there are hundreds of Grid sites involved in execution of the workflow, the user can observe which sites are slower and find out why they are slow by using infrastructure monitoring. – Interactive querying of infrastructure monitoring during execution. Infrastructure monitoring data, such as CPU load or network bandwidth between Grid sites can also be provided during the monitoring and analysis of Grid workflows. Grid workflows and resources consumed are analyzed in an integrated environment. The monitoring and visualization tool can also help to develop the ASKALON middleware services. For example, performance results are used by the performance prediction service to provide estimated execution times of Grid workflows to support the scheduler. In ASKALON, the scheduling service can subscribe events indicating abnormal behaviors of Grid middleware and workflows so that it can reschedule the workflow. Figure 3 shows the main GUI of the workflow performance tool. The top window (Execution Trace) visualizes the workflow representation together with detailed monitoring information. In the top-left pane is the static representation of the workflow, showing the hierarchical view of workflows. The hierarchical view explicitly defines, in detail, concepts and properties of workflows, including workflow, workflow regions and workflow activities, and their relationships based on the workflow performance ontology [8]. In the top-right pane is the execution trace of the workflow. The activities are sorted sequentially by the time they have been initialized. The example trace is for a workflow named Wien2K, which will be described in Section 5.1. We can monitor and visualize activities, workflow regions, data transfers, etc. By clicking an activity in the top-left pane, instances of that activity will be highlighted in the top-right pane. In the bottom-left pane is a tree representing performance information about the current selected activity, for example, the name of the activity, the parent activity of this activity, the machine where the activity is executed, queueing time, processing time, transfer time, source and destination of file transfers, etc. Detailed performance information such as average execution times per Grid sites and job distribution to Grid sites are also visualized.
5 Experiments We have implemented a prototype of our workflow performance monitoring and visualization, and integrated it into ASKALON. Currently the prototype is based on Java 1.5, and JGraph [9] is employed for the visualization of the activities and of the workflow. In this section, we present experiments illustrating the performance monitoring and visualization of real world Grid scientific workflows named Wien2K and Invmod. Our experiments are conducted within the Austrian Grid infrastructure [10], which connects
several national Austrian Grid sites. For our experiments we selected two altix machines, including altix1.uibk.ac.at which is an altix 16 CPUs machine at the University of Innsbruck and altix1.jku.austriangrid.at which is an altix 64 CPUs machine at the University of Linz. In all our experiments, we just specified the two Grid sites but the number of CPUs used for executing workflows is decided by the ASKALON scheduler. 5.1 Wien2K
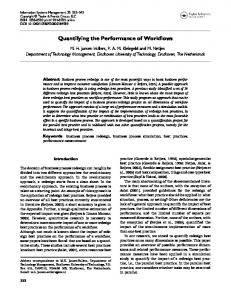
Fig. 3. Wien2K workflow experiment
Wien2K [11] is a program package for performing electronic structure calculations of solids using density functional theory, based on the full-potential (linearized) augmented planewave ((L)APW) and local orbital (lo) method. The problem size is 5.5 specifying the number of planewaves used, and the number of parallel k-points is 650. With this problem size, the two parallel sections - pforLAPW1 and pforLAPW2- have 65 parallel iterations. This workflow has only one primary workflow region, named pforLAPW1, which takes a long time to finish. The rest of the workflow activities are not time-consuming. Through the trace execution in Figure 3, we observed that activities executed on altix1.uibk machine in Innsbruck are completed much faster than activities on altix1.jku machine in Linz. The window second shows performance information for activity second. The pane Mean Execution Time shows various average timing metrics (per number of instances) for activity second on different Grid sites whereas the pane Job distribution displays how instances of activity second
are distributed on different Grid sites. Overall, timing metrics on altix1.uibk are better than that on altix.jku. Out of 65 parallel instances of activity second, the scheduler distributed 16 instances to altix1.uibk, which fully loads this 16-CPU machine. The remaining, 49 instances, are mapped to 64-CPU altix1.jku because the ASKALON performance prediction service indicates that an instance could be completed faster on altix1.uibk than on altix1.jku. During our experimental work with Wien2K, we detected some errors made by the execution engine. For example, in one case, we did not get any failed event from the execution engine, but we observed in our visualization tool that one activity had been reinitialized. After analyzing the case, we found that the missing failed event was due to a bug in the execution engine. 5.2 Invmod Invmod [12] is a hydrological application for river modelling which has been designed for inverse modelling calibration of the WaSiM-ETH program. Invmod has two levels of parallelism, one for the calibration of parameters that is calculated separately for each starting value using parallel random runs, the second for each optimization step represented by an inner loop iteration. In this experiment, the number of the parallel random runs is 7 and the parameter of the optimization step is 3.
Fig. 4. Invmod workflow experiment
As shown in Figure 4, the Invmod workflow is more complex than Wien2K workflow. There are more parallel regions and data transfers, and a larger number of activities is executed in parallel. We observed the execution engine sends all the jobs, using GridFTP, from altix1.jku to itself, which is a performance overhead because this transfer is unnecessary as altix1.jku has a NFS (Network File System).
In its current implementation, if a file must be sent to many activities which have different parameters, the execution engine just sends the file to every activity using GridFTP, without considering the underlying file system. By selecting data types in the tree in the bottom-left pane of Figure 4, infrastructure monitoring can also be invoked. For example, the window Forecast Bandwidth shows the network bandwidth between altix1.jku and altix1.uibk whereas the window Service Availability displays the availability of GRAM service on altix1.jku.
6 Related Work While many tools support performance monitoring and visualization for scientific parallel applications, there is a lack of similar tools for Grid scientific workflows. P-GRADE [13] is a performance monitoring and visualization for Grid workflows. In contrast to our tool, P-GRADE does not support cyclic workflows. P-GRADE is based on Globus Toolkit 2 while our tool is based on advanced WSRF-based architecture using Globus Toolkit 4. Taverna Workbench [14] allows users to monitor the status of activities within Grid workflows, but visualizes information in a form of a simple table. Moreover, detailed execution phases are available only after the execution of the workflow. Our performance tool is more advanced because it can analyze monitoring data in detail at runtime, and dynamic calling relationship among activity instances can be examined online as well. A few tools are developed for performance monitoring and visualization of Web services. Web Service Navigator [15], for example, provides good visualization techniques for Web service based applications. BEA WebLogic Integration Studio [16] supports the automation of business processes. It can also visualize the monitoring of a workflow. However, such tools are not developed for Grid scientific workflows which are quite different from business workflows. None of above-mentioned tools integrates a monitoring system for Grid resources, networks and middleware services with Grid workflow monitoring. Our workflow tool can also correlate performance of Grid infrastructure to Grid workflows in a single framework. In our previous work, we have demonstrated Grid services for dynamically instrumenting and measuring Grid-based applications of DAG-based workflows [7]. Our tool presented in this paper extends our previous work by covering scientific workflows with complex structures such as loop and parallel regions and by supporting Grid workflows composed and executed by an advanced WSRF-based middleware.
7 Conclusion and Future Work Scientific workflows in Grids are complex and their execution commonly implies distributed, sophisticated interactions among various types of Grid applications and resources. We need performance monitoring and visualization tools that are capable to assist the user in monitoring these complex interactions and in detecting failures occurring during runtime. The contribution of this paper is a workflow performance monitoring and visualization tool that not only allows users to observe and analyze complex
interactions during the execution of Grid workflows but also supports the correlation between the performance of Grid workflows and the underlying Grid infrastructure. We are currently enhancing our tool with performance monitoring and visualization features that cover also invoked applications within workflow activities and code regions, according to our workflow performance ontology [8]. Moreover, we are integrating our tool into the K-WfGrid workflow system [17].
References 1. Yu, J., Buyya, R.: A taxonomy of scientific workflow systems for grid computing. SIGMOD Rec. 34 (2005) 44–49 2. Gerndt, M., Wismueller, R., Balaton, Z., Gombas, G., Kacsuk, P., Nemeth, Z., Podhorszki, N., Truong, H.L., Fahringer, T., Bubak, M., Laure, E., Margalef, T.: Performance Tools for the Grid: State of the Art and Future. Volume 30 of Research Report Series, Lehrstuhl fuer Rechnertechnik und Rechnerorganisation (LRR-TUM) Technische Universitaet Muenchen. Shaker Verlag (2004) ISBN 3-8322-2413-0. 3. Fahringer, T., Prodan, R., Duan, R., Nerieri, F., Podlipnig, S., Qin, J., Siddiqui, M., Truong, H.L., Villazon, A., Wieczorek, M.: ASKALON: A Grid Application Development and Computing Environment. In: 6th International Workshop on Grid Computing (Grid 2005), Seattle, USA, IEEE Computer Society Press (2005) 4. OASIS Web Services Resource Framework (WSRF) TC: http://www.oasisopen.org/committees/tc home.php?wg abbrev=wsrf (2006) 5. Globus Project: http://www.globus.org (2006) 6. Truong, H.L., Fahringer, T.: SCALEA-G: a Unified Monitoring and Performance Analysis System for the Grid. Scientific Programming 12 (2004) 225–237 IOS Press. 7. Truong, H.L., Fahringer, T., Dustdar, S.: Dynamic Instrumentation, Performance Monitoring and Analysis of Grid Scientific Workflows. Journal of Grid Computing 3 (2005) 1–18 8. Truong, H.L., Fahringer, T., Nerieri, F., Dustdar, S.: Performance Metrics and Ontology for Describing Performance Data of Grid Workflows. In: Proceedings of IEEE International Symposium on Cluster Computing and Grid 2005, 1st International Workshop on Grid Performability, Cardiff, UK, IEEE Computer Society Press (2005) 9. JGraph: http://www.jgraph.com/ (2006) 10. AustrianGrid: http://www.austriangrid.at/ (2006) 11. Blaha, P., Schwarz, K., Luitz, J.: WIEN97: A Full Potential Linearized Augmented Plane Wave Package for Calculating Crystal Properties. Institute of Physical and Theoretical Chemistry (2000) 12. Jasper, K.: Hydrological Modelling of Alpine River Catchments Using Output Variables from Atmospheric Models (2001) 13. Lovas, R., Kacsuk, P., Horvath, A., Horanyi, A.: Application of P-Grade Development Environment in Meteorology, http://www.lpds.sztaki.hu/pgrade (2003) 14. taverna: http://taverna.sourceforge.net/ (2006) 15. Pauw, W.D., Lei, M., Pring, E., Villard, L., Arnold, M., Morar, J.F.: Web services navigator: Visualizing the execution of web services, ibm systems journal, http://www.research.ibm.com/journal/sj/444/depauw.html (2005) 16. BEA Systems: Monitoring workflows, http://e-docs.bea.com/wli/docs70/studio/ch10.htm (2002) 17. K-WF Grid Project: http://www.kwfgrid.net (2006)