Apr 23, 2012 - failure between minor number of stator winding turns may lead ... a Load-immune Classifier for Robust Identification of Minor Faults in Induction ...
IEEE Transactions on Dielectrics and Electrical Insulation
Vol. 21, No. 1; February 2014
33
Performance of a Load-immune Classifier for Robust Identification of Minor Faults in Induction Motor Stator Winding S. Das, P. Purkait, Haldia Institute of Technology Department of Electrical Engineering Haldia, WB 721657, India
C. Koley National Institute of Technology Department of Electrical Engineering Durgapur, WB 713209, India and S. Chakravorti Jadavpur University Department of Electrical Engineering Kolkata, WB 700032, India
ABSTRACT Reliable detection of induction motor stator winding insulation failure at its early stages is a challenging issue in modern industry. Insulation failure between small number of turns, involving less than 5% turns of phase winding are often indiscernible and detection becomes even more complicated when motor operates at varying load levels. In line-fed motors, supply voltage unbalance is another inadvertent issue which may tend to exhibit current signature similar to stator winding inter-turn insulation failure case. The proposed work presents a robust system, to identify severity of stator winding insulation faults when an induction motor with random wound stator winding works under such operating conditions. In the present work, various features obtained from time, frequency, timefrequency, and non-linear analysis of stator currents at various stator winding short circuit faults and supply voltage unbalance conditions for different load levels have been studied. A Support Vector Machine based Recursive Feature Elimination (SVM-RFE) algorithm is used to identify the features which can provide discrimination information related to severity of fault level, independent of supply voltage unbalance and immune to load level variations. Among the extracted features, features obtained through Detrended Fluctuation Analysis (DFA) are found to be most robust for this purpose. Finally a Support Vector Machine in Regression mode (SVR) has been formed to identify winding failures employing the optimum number of features selected through SVM-RFE technique. Index Terms — Induction motors, Stator inter-turn insulation failure, Load Immunity, Park’s Vector Modulus, Wavelet, Support Vector Regression, Detrended Fluctuation Analysis, Recursive Feature Elimination.
1 INTRODUCTION STATOR winding insulation failures constitute a significant percent of faults encountered during the lifetime of an induction motor [1]. Stator inter-turn insulation failure at its incipient stage, if remain undetected, could cause irreversible damage to stator. If a significant number of turns are involved, damage of Manuscript received on 23 April 2012, in final form 11 September 2013, accepted 11 September 2013.
the stator might not be avoided if the motor protection system is sluggish. In addition, unidentified less severe or insulation failure between minor number of stator winding turns may lead to premature failures of motor within a very short period of motor operating time [2]. The situation tends to become even worse in inverter fed induction motors with Variable Frequency Drives (VFDs). Voltage stress impressed by high frequency switching of power semiconductor devices present in VFD may lead to inter-turn insulation failure of stator winding [3].
DOI 10.1109/TDEI.2013.003549
34
S. Das et al.: Performance of a Load-immune Classifier for Robust Identification of Minor Faults in Induction Motor Stator Winding
Root causes for failure of stator insulation system have been summarized in [4-6]. Several diagnostic schemes have been proposed by many researchers to detect stator winding faults. From application point of view, non-invasive and nonintrusive fault diagnostic methods are always preferred. Pros and cons of off-line methods such as, Insulation Resistance (IR), Polarization Index (PI), and Surge test etc and several on-line methods based on current signature monitoring, temperature monitoring, sequence current monitoring, and vibration signature monitoring have been documented in [58]. To detect stator winding turn insulation failure, the accuracy of Motor Current Signature Analysis (MCSA) combined with wavelet, current envelope, neural network (NN) and Fuzzy neural network (FNN) has been reported in [7-8]. Short-time Fourier transforms (STFT), wavelet transforms and power spectral density (PSD) calculations have been introduced in [9] for fault detection in induction motors. As reported in [10], external factors such as unbalances in supply voltages, inherent motor asymmetries, and load level variations affect the effectiveness of majority of these techniques. Methods such as estimation of negative sequence current and impedance employing Power Decomposition Technique (PDT) [11], multiple reference frame theory [10], magnetic field pendulous oscillation [12], monitoring variation of high frequency resonance in winding [13] etc have been implemented recently in order to achieve high accuracy in stator winding fault diagnosis under supply voltage imbalance, load variation, and inherent machine asymmetry. As reported in [5, 8], the interpretation of such analysis is subjective and the least severity or least percentage shorted turns that has been detected by some newly developed method is found to be much significant in the context of minor incipient stator fault detection [7]. Such issues have inspired the researchers to implement MCSA based stator fault diagnostics schemes which can detect faults involving minor turns accurately and unambiguously i.e. without having problem in interpretation. Significant efforts have been dedicated in the last decade for stator winding fault diagnosis using Park’s Vector approach [14-15] and current Concordia pattern computations [16]. By analyzing two different components of current Park’s Vector with advanced signal and data processing tools in [17] has established competency of Park’s Vector approach to detect such minor incipient stator faults even in presence of supply voltage unbalance conditions at varying load levels. Two issues that complicate stator winding fault diagnosis are supply voltage unbalance and load level variations. Studies involving transient variations in supply voltage and load can be set aside for the time being, since, most stator fault diagnosis techniques are carried out while the motor is operating under steady state condition. Previous experience of the authors [17] have shown that induction motor fault diagnosis methods based on Park’s Vector analysis responds well under known load levels. However, in practical field, the problem becomes more complicated due to the fact that seldom there are devices fitted
to the motor for direct measurement of load. The loading level thus either remains unknown or can only be estimated from indirect measurements such as the value of motor supply current. The fault diagnosis problem becomes more confusing when the current signature due to supply voltage unbalance becomes apparently similar to that due to internal stator winding faults. In the present work, a series of experiments were performed to record motor supply currents at various operating conditions including internal stator winding short circuit faults and supply voltage unbalance under different load levels. Park’s vector modulus (PVM) [15] was obtained through Park’s transformation of three phase stator line currents in all the experiment cases. Several features were extracted through time domain, frequency domain, and time-frequency domain analysis of the PVM. Support Vector machine (SVM) based Recursive Feature Elimination (SVM-RFE) algorithm was used to select, rank and optimize the number of effective features to be used for classification. It is pertinent to mention here that two separate feature sets were constructed; one that included load level information while load level information was intentionally kept hidden from the second feature set. A Support Vector Regression (SVR) based classifier was then used to classify different stator winding fault conditions based on selected features. It was noticed that classifier performance was superior when load level information was included in the feature set than when load level information was kept hidden. To make the fault classification algorithm immune to varying load levels, Detrended Fluctuation Analysis (DFA) was used to extract two additional features from PVM. In place of providing load level information directly, these two new features were introduced in feature set. Selecting, ranking, and optimizing the number of suitable features from the cumulative feature database thus formed was undertaken once again with the SVM-RFE algorithm. Finally the SVR based classifier was found to be reasonably accurate in detecting and classifying motor internal faults, specifically, stator winding minor short circuit faults even under unknown load levels. Judicious selection of features also ensured that the load-immune classifier thus developed responds satisfactorily in differentiating supply voltage unbalance conditions from stator internal fault cases.
2 EXPERIMENTAL DETAILS In the present work, experimental studies have been conducted on a 2.5HP, 415V, 4 pole, 3-phase induction motor with a customized stator winding where several tappings from different coils were taken out. Star connected stator winding of the three phase induction motor under test has 6 coils and 360 turns per phase with enamel insulation between turns. One of the three phases of stator winding (R-phase in the present study) is customized to implement as many as twelve short circuit fault conditions (1, 2, 3, 4, 5, 6, 8, 9, 11, 12, 13 and 14 turns). Short circuiting any two of the taps externally emulates insulation failure between turns thereby creating short circuit fault in the stator phase winding. Minor inter-turn short circuit fault conditions in stator winding are thus artificially created involving 0.28% (1 turn) to 3.89% (14
IEEE Transactions on Dielectrics and Electrical Insulation
Vol. 21, No. 1; February 2014
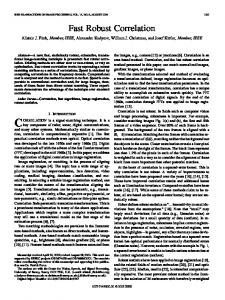
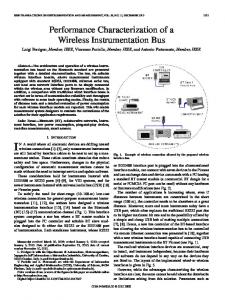
turns) turns of phase winding. Even such a minor fault makes the stator current asymmetrical, which is otherwise symmetrical in ideal healthy case. A DC generator has been directly coupled to the induction motor shaft. A group of lamps are connected to the DC generator output terminals with provision of loading the generator with different combinations. Varying the generator output electrical load thus in turn mechanically loads the induction motor to different levels. Schematic circuit diagram of the experimental set-up is shown in Figure 1. By adjusting 3 single-phase variable auto-transformers, rated three phase balanced supply is fed to the motor under healthy as well as under inter-turn short circuit fault conditions of R-phase stator winding. Experiments for each of the winding fault cases were repeated at no-load (NL) and under five different load levels, namely 20% load (1L), 40% load (2L), 60% load (3L), 80% load (4L) and full-load (5L) of the motor. In each case, current signals are captured after the motor has been run for considerable duration at a given load so that motor temperature can attain a steady value. During the tests, motor temperature is closely monitored by a thermal imager. A sample of such captured image is presented in the inset of Figure 2. Current through short circuit links in each fault case has also been monitored and recorded as presented in Table 1. It has been noticed that even at 1 turn fault current through short circuiting link is well above the rated current value (3.5 A) of the motor. A photograph of experimental setup of the proposed scheme is shown in Figure 2. Data acquisition has been carried out by employing YOKOGAWA (Model no. WT230) 3-phase digital power meter interfaced with PC through serial communication link. It is a high accuracy and wide-bandwidth power meter which can measure DC and AC signals from 0.5 Hz to 100 kHz with a fundamental accuracy of 0.1%. Flexibility is also available to set sampling frequencies up-to 20 kHz. Further details about data acquisition process can be found in [17]. Since noise can always interfere with the fault signatures, the same experiment was repeated several times in order to reach reliable conclusions. Therefore, for each fault condition, in fact, five different data sets were recorded at different points of time for analysis. It may be pointed out here that all the experiments have been performed with the motor being exclusively driven by a sinusoidal source. Thus, unlike in PWM fed induction motors, effect of high frequency components is not expected in the current signature.
35
Another series of experiments have been performed on the motor with unbalanced supply voltages while keeping the motor internally healthy. To impose unbalanced supply voltages of varying amounts, three separate single-phase autotransformers capable of supplying up-to 110% of motor rated voltage have been employed. Amounts of supply voltage unbalance were so selected that resulting unbalance motor currents appear to be identical to motor currents that were caused due to stator winding insulation failures involving 1, 2, 3, 4, 5 and 6 turns respectively. This was intentionally done to pose the classifier with the problem of separating motor internal faults from external voltage unbalances when corresponding current signatures appear to be similar. All the above sets of experiments under varying degrees of supply voltage unbalance conditions were performed at all aforesaid load levels.
Figure 2. Photograph of test set-up Table 1. Current through short circuiting links. Number of Shorted turns 1 2 3
NL
1L
2L
3L
4L
5L
4.5 6.88 7.16
4.55 6.92 7.2
4.61 6.94 7.26
4.66 6.98 7.31
4.72 7.1 7.4
4.74 7.4 7.52
4 5
8.75 9.2
8.86 9.27
8.88 9.34
8.91 9.4
8.98 9.45
9.06 9.5
6 8 9
9.6 10.3 10.6
9.67 10.4 10.62
9.7 10.45 10.65
9.82 10.5 10.76
9.88 10.6 10.85
9.9 10.67 10.89
11 12 13 14
11.3 11.9 12 12.7
11.5 11.9 12.12 12.8
11.63 11.96 12.3 12.8
11.67 11.97 12.42 12.86
11.8 12 12.61 12.87
11.9 12.03 12.67 12.96
Current through shorted link (A) at different loads
3 EXTENDED PARK’S VECTOR APPROACH (EPVA)
Figure 1. Schematic circuit diagram of the experimental set-up.
In three-phase induction motors, the mains supply normally does not have neutral wire. Therefore, the line current fed to the motor has no homo-polar component. A suitable twodimensional (2-D) representation can then be used to describe three-phase induction motor performance. A commonly used
36
S. Das et al.: Performance of a Load-immune Classifier for Robust Identification of Minor Faults in Induction Motor Stator Winding
2-D representation is based on the Park’s transformation which has been successfully applied in the steady-state diagnosis of rotor faults, stator turn-to-turn insulation faults, unbalanced supply voltage conditions, and mechanical loadmisalignments [15]. The orthogonal Park’s vector components (Id, Iq) are function of mains three phase line currents (Ia, Ib, Ic) as mentioned in [17]. Instead of analyzing two different current components (Id and Iq), effort has been made to reduce the number of variables to be analyzed to one by calculating Park’s Vector Modulus (PVM) from Id and Iq. This approach known as Extended Park’s Vector Approach (EPVA) [15] thus sets a new challenge to fault diagnostic method which is to be implemented to identify faults by analyzing effectively only one system variable. Success in achieving desired fault identification performance of proposed method would confirm that estimated PVM actually inherits valuable information associated with operating condition of the motor from Id and Iq. Authors have adopted this approach by taking encouragement from their previous contribution in [17] where analyses were performed using the two separate components Id and Iq. Park’s Vector Modulus (PVM) is then computed as:
PVM I d I q 2
2
(1)
Under normal operating conditions i.e. when a healthy induction motor is fed from a balanced supply, the PVM only contains a dominant dc component. Magnitude of this dc component is found to be
6 I M [15]. Where, IM is 2
maximum value of the motor current. But, under abnormal operating conditions of the motor, due to asymmetries in the motor current signature, the magnitude of the Park’s Vector contains a frequency that is twice the fundamental frequency along with dominant dc component [15]. However, in the case of a practical healthy machine there will always be a small degree of unbalance due to intrinsic asymmetries, hence the PVM corresponding to healthy motor will not be free from ac component. Diagnosis technique proposed in this article is based on analyzing the Park’s vector modulus, corresponding to the motor current signatures under different inter-turn short circuit fault conditions of the stator winding under varying load levels. It is also to be noted that in this analysis, PVMs calculated for all operating conditions are divided by
4 FEATURE EXTRACTION FROM PARK’S VECTOR MODULUS (PVM) 4.1 TIME DOMAIN ANALYSIS From the time domain analysis it was observed that the PVMs consist of DC component (average value) with superimposed oscillating part i.e. AC component. The time domain signal for healthy motor with balanced as well as unbalanced supply voltage conditions along with some minor fault conditions at different load levels are shown in Figure 3. As pointed out earlier, PVMs calculated for all operating conditions have been divided by
6 I M , where IM is taken 2
as maximum value of healthy motor current under no-load. Thus the normalized values of PVMs as shown in Figure 3 are unit-less. Average value (DC component) of these normalized PVMs with different number of faulted turns and under different load levels are plotted in Figure 4. Y-axis of Figure 4 showing average values of normalized PVMs is also unit-less. Average values of normalized PVMs actually are indications of amounts of unbalance present in the line currents. From Figure 4 it can be observed that average values of PVMs are found to be higher in general with an increase in the number of shorted turns as well as with loading level. Whereas actual PVM plots (Figure 3) show substantial variations w.r.t number of faulted turns, their average values (DC component) do not show significant variations up to 4 turns (Figure 4). This may be due to the fact that faults involving such minor number of turns (up to 4 turns) create so less unbalance in the winding impedance that effects of those are hardly discernible on the average values of PVMs.
6 IM 2
and IM is taken as maximum value of healthy motor current under no-load. This manipulation does not change any characteristics of PVM signals excepting magnitude. Thus all PVMs are converted from ampere (A) scale to only relative amplitude which is unit-less. This normalization method allows obtaining unity amplitude of PVM when a healthy motor without any internal asymmetry is fed from balanced supply under no-load. It also suitably scales PVM amplitude corresponding to any operating condition irrespective of motor no-load current magnitude and effectively facilitates to compare PVMs obtained from different operating conditions of motor. So, through out this analysis normalized amplitudes of PVMs have been used.
Figure 3.Time domain plot of normalized Park’s Vector Modulus (PVM), (A) Healthy condition at no-load, (B) 6 turns short at no-load, (C) 8 turns short at no-load, (D)13 turns short at no-load, (E) 3 turns short with 40% load, (F) supply voltage unbalance causing unbalance in motor currents identical to 3 turns short at 40% load, (G) 12 turns short at 80% load, (H) 12 turns short at full- load, (I) 14 turns short at full- load.
Oscillating parts (AC component) of the normalized PVMs as shown in Figure 5, were extracted after eliminating the DC component from the normalized PVM signals i.e. AC part of normalized PVM = normalized PVM-average of normalized PVM. As for Figure 3 and Figure 4, the Y-axis of Figure 5 is also unit less. On first visual, the figure seems more like noise
IEEE Transactions on Dielectrics and Electrical Insulation
Vol. 21, No. 1; February 2014
superimposed on each other. However, this very nature of the plots, which indicate definite variations in the AC components of PVMs w.r.t number of shorted turns and load, encouraged the authors to extract several properties from these plots. Properties that were extracted from AC component of the PVMs include rms value, Standard Deviation, Median, Skewness and Kurtosis [18].
Figure 4. Plot of average values of normalized PVMs w.r.t faulted turns at different loading levels: (NL) No-load, (1L) 20% load, (2L) 40% load, (3L) 60% load, (4L) 80% load, (5L) full load.
37
present in the FFT can be attributed to winding faults, supply unbalance, and flux distortion. From Figure 6, it can be observed that the major peaks, occurring around 100, 200, 300 and 400Hz have certain definite variations with respect to different observation cases A, B, C, and D. It is pertinent to mention here that a symmetrical, healthy stator winding picks up only those harmonics present in the rotor MMF whose pole pair numbers match with those which the stator winding itself can produce. Abnormal harmonics, which appear in a stator current, are functions of a number of variables due to MMF distribution and the permeance wave representation of the air gap. Number of rotor slots or bars, pole pair, slip, and skew in stator and rotor also affects those frequencies and magnitudes [19-20]. With an inter-turn short circuit, shorted portion of the winding acts as a pick-up coil for some specific harmonics. These harmonics will be induced in healthy portion of the winding [21]. Due to dependence on these various parameters as mentioned, harmonic components as present in FFT may not be at exactly integral multiples of supply frequency fundamental. It can also be observed that the amplitudes of the peaks are different for different number of faulted turns. Say for example, the amplitude of the peak around 300 Hz for 2 and 6 turns are in decreasing order whereas around 100 Hz it is in increasing order. Similar observations can also be made for supply voltage unbalance conditions. Features such as peak values of the FFT coefficient around 100, 200, 300 and 400Hz are obtained. In addition to these, exact frequencies of peaks around 100, 200 and 300 Hz are also included in the feature set.
Figure 5. Time Domain plot of extracted AC parts of the normalized PVMs: (A) Healthy at no-load, (B) 4 turns shorted at no-load, (C) 8 turns shorted at no-load, (D) 11 turns with 40% load, (E) 11 turns shorted at full-load.
4.2 FREQUENCY DOMAIN ANALYSIS Several frequency domain based features were extracted to study the variations of harmonic components of PVM so that fault severity can be identified independent of the load and supply voltage unbalanced condition. Thus the extracted AC parts of PVMs were first normalized w.r.t the standard deviation (i.e. normalized value of AC part of PVM = AC part of PVM / Standard deviation of respective AC part of PVM) and then Fast Fourier Transform (FFT) was performed. Figure 6 shows the plot of absolute value of the FFT coefficients vs. frequency of PVM patterns under different fault severity and supply voltage unbalance conditions at no-load. Around 400 data samples (at 20 kHz sampling frequency) have been used to obtain FFT. It can be highlighted here that scale of the vertical axis in Figure 6 is not expressed in terms of ampere; rather it indicates a scale where FFT amplitudes only (unit less) have been plotted. This is because of the fact that FFT was performed basically on the AC parts of the PVMs after normalizing those w.r.t standard deviation. Thus the input signal being fed to FFT is not in terms of ampere, but rather it is a unit less quantity which results in a unit less quantity again in FFT coefficients. Harmonic frequency components
Figure 6. FFT at different fault levels and supply voltage unbalance conditions, (A) 2 turns short, (B) supply voltage unbalance causing unbalance in motor current equivalent to 2 turns short, (C) 6 turns short, and (D) supply voltage unbalance causing unbalance in motor current equivalent to 6 turns short.
Analysis of FFT coefficients up to 1 kHz, revealed that power in higher frequency band (0.5-1 kHz) increases with the severity of the fault. It was also observed that power in this high frequency band remain low in healthy motor as well as during voltage unbalance conditions when compared to faulty motor conditions. In the context of present work, this analysis suggests that stator winding fault due to inter-turn insulation failure, introduces more harmonics in PVM profile than that due to supply voltage unbalance conditions. This is further confirmed by estimating power of AC parts of PVM signals using Power Spectral Density (PSD) calculation with Welch's overlapped segment method (available in MATLAB) employing Gaussian window function. For example, high frequency range PSD at no-load for healthy motor, motor with
38
S. Das et al.: Performance of a Load-immune Classifier for Robust Identification of Minor Faults in Induction Motor Stator Winding
six turn fault, and voltage unbalance causing supply currents equivalent to those due to six turn fault are -78.4 dB, -75.1 dB, and -77.3 dB respectively. In this context, it would be pertinent to mention that PVM values under healthy condition and balanced supply voltage would have been ideally 1 when normalized, as can be anticipated from Figure 3. This can be taken as the reference value of PSD corresponding to 0 dB. In the analysis presented in the manuscript, PSD values were estimated for PVAC (AC parts of PVMs) which are very small in magnitude, even less than 1, as found in Figure 5. Thus, even the relatively high magnitudes of estimated PSD values in the low frequency range of this analysis were found to be around 60 dB. It has been further observed that with increasing frequency, the estimated PSD values were decreasing. PSD values beyond -80 dB were considered to be noise and have been discarded from further analysis. Several additional features such as power of the signal in the frequency band of 100±25, 200±25 and 300±25 Hz, and from these basic features, other derived features such as ratio of the power, and ratio of sum of the first three odd harmonics power to total power, ratio of the remaining harmonics power to total power, power in high frequency band (500-1000 Hz) and ratio of it to power in low frequency band (0-500 Hz) were calculated. 4.3 TIME-FREQUENCY DOMAIN ANALYSIS Due to non-stationary behavior of the PVMs, and to analyze how the harmonic contents vary with respect to time at different level of fault severity, load level and voltage unbalanced condition, Continuous Wavelet Transform (CWT) [22-23] of the PVMs (extracted AC part) was obtained. The plots of CWT coefficients under different operating conditions of the motor are shown in Figure 7. CWT generally will produce a 3-dimensional plot with X-axis showing time (translation), Y-axis showing frequency (scale) and Z-axis showing the CWT coefficients. Accordingly in Figure 7, horizontal axis of each figure indicates translation along data number, vertical axis indicates scale, and CWT coefficients are drawn with different color shades indicating its magnitude value. Color bar on the right side of Figure 7 indicates magnitude of CWT coefficients. In each plot, the maximum CWT coefficient value, along with its corresponding translation and scale values have been observed to be varying with fault types and fault severity. One such CWT maximum peak has been circled for example in the Figure 7(a).
In this analysis it has been found that use of “Morlet” wavelet as a mother wavelet is providing better discriminating information when PVMs of different fault severity are presented. The analysis revealed that CWT coefficient of major peak, its position in ‘time’ (translation) and ‘scale’ axes vary with respect to number of faulted turns.
5 NON-LINEAR ANALYSIS (DFA) The motivation behind use of non-linear analysis came from the fact that most of the earlier features as discussed are sensitive to load level variations. To build a robust fault severity identification system, it is thus necessary to look for the additional features which are less affected by the changes in load level and have large variations due to change in winding fault severity. Extracted non-linear features from the chaotic nature of signals similar to PVM in present study have shown effectiveness in various fields of engineering [24]. A closer look at Figure 4 reveals that the general wave shape of extracted AC parts of PVM for winding fault involving given number of turns do not vary much with changes in load level, except amplitude variation; whereas the wave shapes change radically when fault severity levels change. In search of a method that responses to changes in wave shape, the Detrended Fluctuation Analysis (DFA) which is one kind of Fractal analysis has been found to be suitable. Since its introduction, the DFA has been effectively used as a tool for detection of correlations and fluctuations in different time series. Its applications include long time geological patterns [25], sea clutter radar data sets [26] and even, heart rate dynamics [27]. 5.1 BRIEF THEORY OF DFA Detailed theoretical formulations of DFA can be found in [25]. Summary of important features of DFA is presented here for ready reference. Let v ( n ) represent any PVM in time domain, where n=1, 2,…, K and K is the total number of points present in the PVM. For the DFA, first an integrated series z ( n ) is obtained by K
z( n )
{ v ( n ) v ( n )} , where v ( n ) represent the average n 1
value of v ( n ) . Then the entire sequence is divided into N equal windows by discarding any remainder, so that each window has c=integer_part( K /N) number of points. Now for the wth window a semi-local trend was obtained by performing a least square fit of z ( n ) with the help of straight line z w (n) . The rms fluctuation S(c) from the semilocal trends in N windows can be calculated as: 2 wc 1 N z (n) z w (n) (2) S (c ) Nc w1 n( w1)c1
Figure 7. Plot of CWT Coefficients Vs. Time and Scale, (a) healthy motor at no-load , where the major peak is circled (b) voltage unbalance at no-load without any internal fault, (c) 4 turns short at no-load, and (d) 4 turns short at 40% load.
Since DFA considers only the fluctuations from the semilocal trends, it is insensitive to spurious correlations introduced by slowly varying external trends [28]. It is apparent that S(c) will increase with increasing window size
IEEE Transactions on Dielectrics and Electrical Insulation
Vol. 21, No. 1; February 2014
c, since the deviations from the fits will become larger for larger segments. The variation of S(c) due to the variation of window size c indicates the power law relationship ( S(c) c ) where α indicates the nature of fluctuation in the PVMs. The exponent α can thus be estimated as the slope of plot between ln[S(c)] and ln[c]. In general, this exponent becomes 0.5 for uncorrelated white noise [28] and α >0.5 indicate that correlations in the signal are persistent (i.e., an increment is very likely to be followed by an increment, and vice versa). The exponents estimated by DFA lie between 0 and 2 [28]. α
5.2 APPLICATION OF DFA In DFA, smaller windows focus on the fast varying components whereas larger window sizes focus on the slowly varying trends. The scaling exponents αs and αL can be considered to distinguish the scaling behaviour of the fluctuation function on small and large time scales (high frequency and low frequency) respectively in order to find out the nature of short-range or long-range correlations. Short range (high frequency) correlation in the time series data is indicated by value of α (αS) greater than 0.5 on smaller scales (window size). Value of α (αL) larger than 0.5 in large scale indicates long range (low frequency) correlation. The value of αs corresponds to the slope of ln[ S(c) ] as a function of ln[c] in Table 2. List of Extracted Features. Label Description F1 Average value of the Parks Vector F2 RMS value of the extracted AC part F3 Standard Deviation of the AC part Time domain F4 Median value of the AC part analysis F5 Mode value of the AC part F6 Skewness of the AC part F7 kurtosis of the AC part F8, F9, F10 Peak values of the FFT coefficient around and F11 100, 200, 300 and 400 Hz respectively F12, F13 Exact frequency of the maximum FFT and F14 coefficient around 100, 200 and 300 Hz F15, F16, Power of the signal in the frequency band of F17 and 100 , 200±25, 300 ±25 and 400 ±25 respectively F18 Frequency domain analysis F19, F20, F21, F22 Ratio of the F15/F16, F15/F17, F15/F18, and F23 F16/F17 and F17/F18 respectively
39
captured per input supply cycle (20ms). This part of the analysis has been carried out by varying the data samples per window from 100 (window size = 4) to 8 (window size=50). In order to understand more clearly how these two exponents αs and αL vary when fault severity and load level change, a scatter plot between αs and αL at different fault and load levels over multiple experiments are shown in Figure 8. For example, scatter points corresponding to healthy (H) case of the motor at six different load levels and at all the five test runs are marked with darker dots. Similar scatter points have been obtained for different turn faults as well as voltage unbalance conditions at different loads and at different test runs. Figure 8 clearly displays the clusters formed at different winding fault levels. Clusters at different winding fault severity levels are almost mutually exclusive with limited instances of overlap. The most important observation from Figure 8 however, is that the effect of load level variation is almost absent. Irrespective of load level, the scatter points corresponding to a given winding fault condition lie within a reasonably close cluster. It is interesting to note from Figure 8 that clusters corresponding to healthy (H), and voltage unbalance (VU), conditions are located at different position from clusters correspond to internal winding faults of different severity.
Features from
Time-frequency domain analysis Loading value DFA
F24 and F25 F26 and F27
Ratio of sum of the first three odd harmonic power to total power and remaining power Power in High frequency band (500-1000 Hz) and ratio of it to the low frequency band (0-
F28, F29 and F30 F31 F32 F33
Scale, Translation and Coefficient values of the Major Peak Load Level αs αL
the short range 6 c 22 and the αL for the long range of 24 c 36 samples. These two ranges were determined by searching max[ S L 2 ] with variable window size in
between 4 to 50. The basis of varying the window size depends upon the number of data samples acquired per input supply current cycle. In this work, 400 data samples were
Figure 8. Plot of αs vs. αL at different faults and load levels over multiple experiments. [1, 2, 3,…14 in the Fig. indicate faulted turns; VU indicates supply voltage unbalance cases; H indicate healthy case].
Closeness and few instances of overlap of the clusters reveal that only αs and αL are not enough, but can work as effective features when added to the existing feature set (time, frequency and time frequency domain features) for accurate fault detection with acceptable degree of load-immunity.
6 SVR AND SVM-RFE BASED FAULT CLASSIFICATION 6.1 DESIGN OF FEATURE DATABASE A total of 33 features extracted following the procedure described in sections 4 and 5 are described in Table 2. In order to design a suitable classifier that can satisfy the primary aim of identifying minor inter-turn short circuit faults due to insulation failure under varying load and unbalance
40
S. Das et al.: Performance of a Load-immune Classifier for Robust Identification of Minor Faults in Induction Motor Stator Winding
supply voltage conditions, an SVM based classifier in regression mode (SVR) was employed. For training, testing and performance evaluation of the classifier, the input feature matrix (Table 1) and one class level or target matrix were used. In the present work, a total of 19 cases (one healthy with balanced supply voltage, 6 healthy with unbalanced supply voltage, and 12 inter-turn short circuit faults) have been emulated at six different motor load levels (including noload) and the same experiment has been repeated for five times. Based on this fact, features are arranged in matrix form according to experiment number, load level and fault condition. Among the five set of data obtained from five experiments, one set of data were kept aside for independent testing of the SVR on unseen data. The single column target matrix contains a number according to the % of turns in the phase winding involved in inter-turn fault. This target matrix does not differ with load level, supply voltage unbalance and experiment number. The target (t) values were obtained by choosing a linear function (t=mx+c) of % of winding under fault condition (x), where m was 0.22 and c was 0.1. These two typical values of m and c were chosen to keep the target range in between 0.1 and 1. The value c=0.1 was considered to set the target value for healthy motor (with or without supply voltage unbalance) to 0.1 (above ‘0’ value). Classification performance of a regression model depends primarily, on the selection of good features, i.e., features that represent maximal correlation with the target function. So, in order to eliminate irrelevant and redundant features, an SVM based Recursive Feature Elimination (SVM-RFE) algorithm has been used. This is a popular and fast technique for feature selection, used in natural language processing and remote sensing [29]. The motivation behind using SVM as a classifier is the fact that most of the previous works of multi-class classifications in high dimensional feature space pointed out the superiority of SVM classifiers over traditional statistical and neural classifiers [23]. 6.2 THEORY OF SVR AND SVM-RFE Let for each of the d-dimensional training feature vector ( χ k R d ) = { 1 , 2 ,... K } , a target value ( y k ) was assigned, with k 1,2,...K , where K corresponds to size of the target data. The idea of regression problem is to determine a function from the training data set {(χ1 , y 1 ),(χ 2 , y 2 ),...(χ K , y K )} , that can approximate future target values accurately. Then from the K number of training features one needs to iteratively find weight matrix (w) of ddimension and bias b so that yk w. k b, for k 1,2,...K (3) If the features are not linearly related, then they are mapped into a higher dimensional space, called kernel space () with the help of a kernel function κ ( k , ) so that each coordinates of the kernel space correspond to one feature in the feature set. In that kernel space, a variety of methods can be used in general to find relationships between data items. Use of kernel functions allows the SVM representation to be
independent of dimensionality of the input space. Different kernel functions such as linear, RBF, hybrid, polynomial, logarithmic etc. [30] can be used to provide the SVM to model complicated separating hyperplanes between feature data sets. Finding regression function from the training set in this case thus becomes estimation of w and b so that from [29]: y k f ( ) w.Θ(χ k ) b, for k 1,2,...K (4) The optimal regression function is given by the minimum of the risk function, K 1 2 (5) ( w k ) w k C k Lk (y K ,i ) 2 i 1 where, Lk (y K ,i ) are the allowable tolerance values
introduced to represent boundary constraints on the outputs of the system, and the user specified constant Ck is a regularization parameter, that allows control of boundary when out of boundary data are present [29]. High values of Ck will indicate a more optimized solution whereas a low value results in a more generalized solution. Minimization of the risk function (5) can be achieved with the -insensitive loss function L k taking the form [31] Lk =
Lk (y K ,i ) , where
i
0 when, fk ( ) yk,i εk Lk (yk,i ) otherwise fk ( ) yk,i εk
(6) where, k is the user specified error level. The regression risk given by (5) and the loss function given by (6) have been minimized by solving quadratic optimization problem, whose solution provide possible values of Lagrange Multipliers L , L [32]. RFE technique, in its basic form, selects a subset of most discriminative features with certain pre-defined interrelationship. This selection is performed through a sequential backward elimination procedure following a margin maximization principle [32]. The idea of RFE is to start training the SVM classifier with all the features that least decreases the margin using some mathematical or heuristic rules. This process of feature elimination is repeated till some stopping criteria are met. When a particular feature q is to be removed from the feature subspace F during a certain iteration, then a measure of predictive ability of the SVM regression need to be calculated after leaving out the feature q from F. This measure of predictive ability is defined as: w 2q ( L ,L )
K
K
( L
i
Li )( x iq , x j q )
(7)
i 1 j1
Where, x iq denotes the ith training point in the feature space F without the feature q. The ranking score given by r q w 2 (L , L w 2q (L , L ) for each iteration is computed.
The feature q with smallest ranking score is eliminated from feature subspace F. For large original input spaces, to speed up the computational process, the authors in [33] suggested that more than one feature should be removed at a time. This
IEEE Transactions on Dielectrics and Electrical Insulation
Vol. 21, No. 1; February 2014
simplifies the search procedure but may lead to sub-optimal solutions, so in the present work only one feature was removed at each level of iteration. 6.3 LOAD IMMUNE FAULT CLASSIFICATION To evaluate the effectiveness of DFA analysis on PVMs for identification of fault severity in the presence of load variation and supply voltage unbalance condition, three set of identification models were created for comparison of the performances; these are as follows: Model 1: Consider all the features from F1 to F31, i.e. with known load level and without DFA features. Model 2: Consider only the features from F1 to F30, i.e. without DFA and without load level features. Model 3: Consider all the features except load level i.e. F31. This model was chosen to purposefully make the classifier blind to load levels, and still check how it performs. As was observed in Figure 8, that the plot between DFA features αs and αL generated reasonably close cluster of scatter points corresponding to a given winding fault condition irrespective of load level. This interesting finding prompted the authors to replace load level feature (F 31) from the feature vector by αs and αL, to make the proposed SVR based system robust i.e. immune to variations of load and voltage unbalance conditions. For each of the three models, three separate SVR models were considered. For each of these models, first selection of reduced set of best features were performed through SVMRFE. Then optimization of the respective SVR model parameters like error level (ε), kernel function and the tolerance values Ck were performed to improve respective model performance through iterative process of grid search. In the iterative process, these parameters were varied over some predefined range iteratively (i.e. one parameter at one time). For each of the iteration, performance was evaluated in terms of accuracy (AC), which was calculated as AC = (100 - % error), where, Actual faulted turns Predicted faulted turns error Actual faulted turns It was pointed out in [30] that there is no general theoretical tool to predict which kernel can give best results for a given data set. Thus experimenting with different kernels is only way to choose the best one. In the present work, for each of the models, Gaussian RBF kernel function was found to provide better performance when compared to linear and polynomial (up to 2nd order) kernels. The Gaussian RBF kernel was tuned to set the SVR parameters (C, γ, and ε) to get optimum regression performance. The optimum parameters values for each of the models are listed in Table 3. Finally, the respective model accuracies were obtained on seen and unseen data with the help of respective best set of features and optimized SVR models. First step i.e. feature selection involves ranking of the features during training on the basis of rq values in each run (as discussed in previous section), and then searching best reduced set of features by observing the improvement in performance of the model. Subsequently training and testing
41
are performed with the set of features thus obtained. For each of the three models along with their performance with rank wise cumulative features in the feature vector are presented in Table 4. For training and testing in all the cases k-fold Cross Validation (CV) procedure [34] was adopted. In this process, the SVR was trained with randomly chosen (k-1) number of sub-sets and then tested with the remaining sub-set. Adequate care was taken, however, to ensure that during training process; at least one feature vector from each class (fault condition and load level) is present in the training data set. Next step involves optimization of the SVR models by varying ε, kernel function (specifically the γ parameter), and Ck as described before, for the respective reduced set of best features as obtained from the first step. Table 3. SVR Optimum Parameters Values. Parameter C γ ε
Model 1 45 0.58 0.1
Model 2 120 0.44 0.1
Model 3 55 0.88 0.1
Table 4. Ranking and Performance (Accuracy in %) of the SVR Model for Three Experiments. (FN stand for Feature Name and AC is Accuracy in %). Rank Model 1 Model 2 Model 3 FN AC FN AC FN AC 1 F1 62.5 F27 58.1 F32 68.7 2 F31 75.3 F23 65.1 F33 73.2 3 F2 83.2 F25 69.7 F27 81.3 4 F27 88.7 F17 71.4 F25 87.3 5 F3 89.5 F1 74.3 F23 89.6 6 F26 90.8 F22 75.7 F22 91.7 7 F17 91.7 F3 75.9 F1 92.3 8 F23 92.5 F26 76.4 F17 92.5 9 F25 93.9 F24 77.4 F26 92.6 10 F30 93.7 F2 78.8 F1 92 11 F24 94.4 F11 78.9 F3 92.1 12 F28 94.2 F30 80.1 F30 92.6
The last step involves validation of the proposed model, i.e. to identify fault severity through testing on unseen data. To judge performance of the classifier critically, all features of a particular fault number/class were removed from training data set, but was included in the testing data set. This posed a challenge to the classifier to identify a fault condition for which it was not trained. A flow chart summarizing the entire process of fault classification is presented in Figure 9.
7 RESULT AND DISCUSSION Results obtained from feature selection process for the three models as shown in Table 2 indicate that none of the features is best over the three models. From the ranking of Model 1 and Model 2 it can be observed that ranking of the features change completely when load level information is not provided. The top ranked feature F1 in Model 1, which contained average value of PVM’s, is ranked at much lower position when the load level information is not provided i.e. in Model 2. This drop in rank of F1 from 1st to 5th position is due to the fact that its value depends heavily on the load level as
42
S. Das et al.: Performance of a Load-immune Classifier for Robust Identification of Minor Faults in Induction Motor Stator Winding
shown in Fig. 3. Similar explanations can be sought for other features taking up their respective ranking positions both with and without load level information. It can be also observed that when load level information is not presented, then the features F27, F23 and F25, which are basically ratios, get higher ranks. For Model 3, i.e. when DFA features are added with the features of Model 2, the rank of the DFA features (F32 & F33) are 1st and 2nd as expected. The feature F27, i.e. the ratio of power in high frequency band to low frequency band is found to be another effective feature, which occupy 1st rank in the case of Model 2 and 3rd rank (after DFA) for Model 3. This fact indicates that when winding fault occurs, significant amount high frequency components are injected in the stator winding compared to the voltage unbalanced conditions.
Figure 9. Flow chart of the proposed scheme.
Variation of the DFA features with fault conditions also point out the same fact, that with the fault severity the long rage correlation i.e. αL decreases and short range correlation i.e. αs increases and the DFA features are able to extract this piece of information more effectively. On the other hand the values of the αL and αs depends on the wave shape and it was observed that the change in basic wave shape of PVMs are more significant compared to the changes in the load level and voltage unbalance conditions. The improvement in performance with rank wise cumulative inclusion of one feature at a time for the Model 1, 2 and 3 as shown in Figure 10, indicate that inclusion of more than 11, 12 and 9 features for Models 1, 2 and 3 respectively do not improve the performance significantly. From the
performance of Model 1, as presented in Table 2, it can be observed that the best feature is F1. F1 alone is able to provide fault identification accuracy of 62.5% and the inclusion of F31 i.e. load level information increase the performance to 75.3%, even though the feature F31 does not contain any fault related information. It is also interesting to see that the SVM-RFE has placed F2 in 3rd rank whose variation with fault and load level is similar to F1. This proves once again, the ability of SVM-RFE to eliminate redundant features and find the best set of complementary features. The performance of Model 3 with top ranked feature i.e. F32 is 68.7%. This is much higher than Model 1 with its top ranked feature F1. This indicates that F32 is more effective feature than F1, but whenever the F31 is added to the Model 1 its performance increases dramatically and becomes higher than that of Model 3 after addition of F33. With the addition of other features i.e. top 11, 12 and 9 features for Models 1, 2 and 3 respectively, their performances can be improved up to 94.4%, 80.1% and 92.6%. The performance of Model 2, which does not contain load level information and DFA features have lowest performance. After finding the reduced best set of features for each of the SVR models, the individual SVR model parameters was tuned as discussed in earlier section. With the properly tuned SVR models, the performance was improved to 95.3%, 82.7% and 93.2% for Models 1, 2 and 3 respectively. These are average accuracy obtained from k-fold CV test. When unseen data was presented to each of the optimized and properly trained respective models, the performances were found to be 95.1%, 80.8% and 92.7% respectively. At the first glance it may seem that performance of Model 1 is superior to other models. However, it is to be pointed out here that Model 1 is presented with the load level information, while Model 2 and Model 3 are blind to load level information. It is pertinent to highlight that Model 3, even without load level information, provides acceptable range of accuracy when compared to Model 1. This is a major contribution of the present study that use of DFA (in Model 3) has made the load-immune classifier perform reasonably close to Model 1 where the load information is known. Comparative performance of the classifier with and without DFA can be better visualized using the plots shown in Figure 10. From Figure 10, it is clear that when DFA is used (Model 3), the classifier gives reasonably good performance even when it is blind to load level changes. As expected, Model 2, without DFA and without load level information has worst performance out of the three.
8 CONCLUSION Detecting minor level short circuit faults involving less number of turns in stator winding of induction motor has always been a challenging issue for researchers. The problem gets complicated under varying load levels, especially when the loading information is unknown. Attempt of this article has been to identify suitable features from Park’s vector modulus of motor line currents under different fault severity. Contribution of this research work has been Development of an experimental set up that emulates inter turn short circuit faults in stator winding of an induction
IEEE Transactions on Dielectrics and Electrical Insulation
Vol. 21, No. 1; February 2014
motor at varying load levels and also under supply voltage unbalance conditions. Using EPVA to process the line current signals to extract AC components of PVMs that are found contain fault signatures. Normalization procedure adopted on PVM throughout this work actually makes the features independent of actual value of current magnitude. It is thus expected that the proposed classification model will perform with comparable accuracy for more powerful industrial grade machines of similar configuration. The extracted AC part of PVM are then processed with time, frequency, and time-frequency (CWT) domain signal processing tools, and fractal technique (DFA) for fault feature extraction. Design of a classifier that could identify stator winding minor faults of different severity with reasonable accuracy even when the loading level is unknown. The scheme also takes care of situations where unbalanced supply voltages can cause current variations similar to internal fault cases. Such robust load immune fault classification could imply more acceptability of the proposed method in practical applications. Future directions of research in this area can be listed as: Probing into possible application of the proposed scheme for fault identification in industrial grade motors with different configuration. For delta coupling and on faulty motor, harmonic currents may flow in the coupling. These currents may affect the results of this study based on line current measurements. Incorporation of such results will require more extensive studies with different types of coupling. Future plan of research includes studies on effects of coupling current, bearing current and shaft current on classifier performance. 90
[5]
[6]
[7]
[8]
[9]
[10]
[11]
[12]
[13]
[14]
Model 3
80 Performance (%)
[4]
[15]
Model 1
100
[3]
[16]
70
Model 2
60 50
[17]
40 30 20
[18]
10
[19]
0 0
5
10
15 20 Number of Features
25
30
35
[20]
Figure 10. Performance vs. cumulated number of features used in classification. [21]
REFERENCES [1]
[2]
A. Siddique, G. S. Yadava, and B. Singh, “A review of stator fault monitoring techniques of induction motors”, IEEE Trans. Energy Conversion, Vol. 20, No. 1, pp. 106 -114, 2005. A. Stavrou, H. G. Sedding, and J. Penman, “Current monitoring for detecting inter-turn short circuits in induction motors”, IEEE Trans Energy Conversion, Vol. 16, No. 1, pp. 32 – 37, 2001.
[22]
[23]
43
C. Hudon, N. Amyot, T. Lebey, P. Castelan, and N. Kandev, “Testing of Low-voltage Motor Turn Insulation Intended for Pulse-width Modulated Applications”, IEEE Trans. Dielectr. Electr. Insul,, Vol. 7, No. 6, pp. 783-789, 2000. A. H. Bonnett and G. C. Soukup, "Cause and Analysis of Stator and Rotor Failures in Three-phase Squirrel-Cage Induction Motors", IEEE Trans. Ind. Appl., Vol. 28, No. 4, pp. 921-937, 1992. S. Grubic, J. M. Aller, B. Lu, and T. G. Habetler, “A survey on testing and monitoring methods for stator insulation systems of low-voltage induction machines focusing on turn insulation problems”, IEEE Trans. Ind. Electron., Vol. 55, No.12 , pp. 4127–4136, 2008. P. Zhang, Y. Du, T. G. Habetler, and B. Lu, “A survey of condition monitoring and protection methods for medium-voltage induction motors”, IEEE Trans. Ind Appl., Vol. 47, No. 1, pp. 34–46, 2011 A. Gandhi, T. Corrigan, and L. Parsa, “Recent advances in modeling and online detection of stator inter turn faults in electrical motors”, IEEE Trans. Ind. Electron., Vol. 58, No. 5, pp.1564–1575, 2011. R. M. Tallam, S. B. Lee, G. C. Stone, G.B. Kliman, J. Yoo, T. G. Habetler, and R. G. Harley, “A Survey of Methods for Detection of Stator-Related Faults in Induction Machines”, IEEE Trans. Ind Appl., Vol. 43, No. 4, pp. 920–933, 2007. J. Cusido, L. Romeral, J. A. Ortega, J. A. Rosero and A. Garcıa Espinosa, “Fault detection in induction machines using power spectral density in wavelet decomposition,” IEEE Trans. Ind. Electron., Vol. 55, No. 2, pp.633–643, 2008. S. Cruz and A. Cardoso, “Multiple reference frames theory: A new method for the diagnosis of stator faults in three-phase induction motors,” IEEE Trans. Energy Convers., Vol. 20, No. 3, pp. 611–619, 2005. M. Arkan, D. K. Perovic, and P. Unsworth, “Online stator fault diagnosis in induction motors”, IEE Proc-Electr. Power Appl., Vol. 148, No. 6, pp. 537-547, 2001. B. Mirafzal, R. J. Povinelli, and N. A. O. Demerdash, "Interturn Fault Diagnosis in Induction Motors Using the Pendulous Oscillation Phenomenon", IEEE Trans. Energy Convers., vol. 21, no. 4, pp. 871882, 2006. F. Perisse, P. Werynski, and D. Roger, " A New Method for AC Machine Turn Insulation Diagnostic Based on High Frequency Resonances”, IEEE Trans. Dielectr. Electr. Insul., Vol. 14, No.5, pp.1308-1315, 2007. H. Nejjari and M. E. H. Benbouzid, “Monitoring and diagnosis of induction motors electrical faults using a current Park’s vector pattern learning approach”, IEEE Trans. Ind Appl., Vol. 36, pp. 730–735, 2000. S. M. A. Cruz and A. J. Marques Cardoso, “Stator Winding Fault Diagnosis in Three-Phase Synchronous and Asynchronous Motors by the Extended Park’s Vector Approach”, IEEE Trans. Ind. Appl., Vol. 37, pp. 1227-1233, 2001. F. Zidani, M. E. Benbouzid, D. Diallo, and M. S. aïd Naït-Saïd, “Induction Motor Stator Faults Diagnosis by a Current Concordia Pattern-Based Fuzzy Decision System”, IEEE Trans. Energy Convers., Vol. 18, No. 4, pp. 469 -475, 2003. S.Das, P.Purkait, D. Dey, and S. Chakravorti, “Monitoring of Inter-Turn Insulation Failure in Induction Motor using Advanced Signal and Data Processing Tools”, IEEE Trans. Dielectr. Elect. Insulation, Vol. 18, No. 5, pp.1599–1608, 2011. K. Fukunaga, Introduction to Statistical Pattern Recognition, Academic Press, 1990. W. T. Thomson and M. Fenger, "Current signature analysis to detect induction motor faults," IEEE Industry Applications Mag., Vol. 7, No. 4, pp. 26-34, 2001. J.H. Jung, J.-. Lee, and B.H. Kwon, "Online Diagnosis of Induction Motors Using MCSA”, IEEE Trans. Ind. Electron. Vol. 53, No. 6, pp. 1842-1852, 2006. I. Albizu, I. Zamora, A. J. Mazon, J. R. Saenz, and A. Tapia, "On-line stator fault diagnosis in low voltage induction motors," presented at 39th Int’l. Universities Power Eng. Conf., Vol. 1, pp. 504-508 2004. P. Purkait and S. Chakravorti, “Time and frequency domain analyzes based expert system for impulse fault diagnosis in transformers,” IEEE Trans. Dielect. Electr. Insul., Vol. 9, pp. 433–445, 2002. C. Koley, P. Purkait and S. Chakravorti, “Wavelet-Aided SVM Tool for Impulse Fault Identification in Transformers”, IEEE Trans. Power Delivery, Vol. 21, No.3, pp. 1283 -1290, 2006.
44
S. Das et al.: Performance of a Load-immune Classifier for Robust Identification of Minor Faults in Induction Motor Stator Winding
[24] P. A. Absil, R. Sepulchre, A. Bilge, and P. G´erard, “Nonlinear analysis of cardiac rhythm fluctuations using DFA method,” Physica A, Vol. 272, pp. 235–244, 1999. [25] P. Talkner and R. O. Weber, “Power spectrum and detrended fluctuation analysis: Application to daily temperatures,” Phys. Rev. E, Stat.Phys. Plasmas Fluids Relat. Interdiscip.Top., Vol. 62, pp. 150–160, 2000. [26] J. Hu, J. B. Gao, F. L. Posner, Y. Zheng, and W. W. Tung, “Target detection within sea clutter: A comparative study by fractal scaling analyses”, Fractals, Vol. 14, pp. 187–204, 2006. [27] R. C. Hwa and T. C. Ferree, “Scaling properties of fluctuations in the human electroencephalogram,” Phys. Rev. E, Stat. Phys. Plasmas Fluids Relat.Interdiscip.Top., Vol. 66, pp. 021901-1–021901-8, 2002. [28] K. Hu, P. Ch. Ivanov, Z. Chen, P. Carpena, and H. E. Stanley, “Effect of trends on detrended fluctuation analysis,” Phys. Rev. E, Stat. Phys.Plasmas Fluids Relat.Interdiscip.Top., Vol. 64, pp. 011114-1– 011114-19, 2001. [29] Y.Bazi, and F.Melgani, “Toward an optimal SVM classification system for hyperspectral remote sensing images,” IEEE Trans. on Geoscience and Remote Sensing, Vol. 44, No. 11, pp. 3374-3385, Nov. 2006. [30] D. Boolchandani, and Vineet Sahula, “Exploring Efficient Kernel Functions for Support Vector Machine Based Feasibility Models for Analog Circuits”, Int’l. J. Design, Analysis and Tools for Circuits and Systems, Vol. 1, no. 1, pp. 1-8, 2011. [31] I. Seo, S.Yim, H.Kim, B.Ha, and O.Hyun, “Empirical modeling of superconducting fault current limiter using Support vector regression”, IEEE Trans. Applied Superconductivity, Vol. 20, No. 3, pp. 1254-1258, 2010. [32] N. Cristianini and J. Shawe-Taylor, Support Vector Machines, Cambridge University Press, 2000. [33] I. Guyon, J. Weston, S. Barnhill, and V. Vapnik, “Gene selection for cancerclassification using support vector machines,” Mach. Learn., Vol. 46, No. 1–3, pp. 389–422, 2002. [34] M. Stone, “Cross-validatory choice and assessment of statistical predictions,” J. Roy. Statistical Soc., series B, Vol. 36, No. 1, pp. 111– 147, 1974.
Santanu Das (M’05) was born in Arambagh, Hooghly, India, in 1977. He obtained his B.E.E and M.E.E. degrees from Bengal Engineering and Science University, Howrah, India in 1998 and 2001, respectively. He has recently submitted his thesis for the Ph.D. degree in Electrical Engineering at Jadavpur University, Kolkata, India. He worked at Asansol Engineering College, India as a Lecturer. Presently he holds the post of Associate Professor and Head, Electrical Engineering Department, Haldia Institute of Technology, Haldia, India. His research interests include Motor condition monitoring, PLC based motion control, Power Electronics and Drives.
Prithwiraj Purkait (M '97, SM’09) was born in Kolkata, India in 1973. He obtained his B.E.E., M.E.E. and PhD degrees from Jadavpur University, Kolkata, India in 1996, 1999 and 2002, respectively. He worked with M/s Crompton Greaves Ltd, Mumbai, India as a Design Engineer for one year. He was involved in post-doctoral research in the University of Queensland, Australia during 2002-2003. Presently he holds the post of Professor, Department of Electrical Engineering, Haldia Institute of Technology, Haldia, India. His current research includes transformer insulation condition assessment techniques, motor fault diagnosis techniques and advanced signal processing applications in High Voltage Engineering. Chiranjib Koley (M’03) was born in Tarakeswar, Hooghly, India in 1978. He obtained his B.Tech, M.Tech, and Ph.D. degrees in 2000, 2002 and 2007, respectively. Presently he holds the post of Associate Professor in the Department of Electrical Engineering, National Institute of Technology, Durgapur, India. He has published more than 20 research papers and developed an online course. His current research includes condition monitoring of electrical equipment, signal processing, machine learning, instrumentation and control. Dr. Sivaji Chakravorti (M'89, SM'00) received his BEE, MEE and Ph.D. degrees from Jadavpur University, Kolkata, India, in 1983, 1985 and 1993, respectively. Since 1985 he has been a full-time faculty member of Electrical Engineering Department of Jadavpur University, where he is currently a Professor in Electrical Engineering. In 1984 he worked at the Indian Institute of Science Bangalore as Indian National Science Academy Visiting Fellow. He worked at the Technical University Munich as Humboldt Research Fellow in 1995-96, 1999 and 2007, respectively. He served as Development Engineer in Siemens AG in Berlin in 1998. He has also worked as Humboldt Research Fellow in ABB Corporate Research at Ladenburg, Germany, in 2002. He worked as US-NSF guest scientist at the Virginia Tech, USA, in 2003. He is Fellow of Indian National Academy of Engineering, Fellow of National academy of Sciences India and distinguished lecturer of IEEE Power Engineering Society. He has published about 140 research papers, has authored a book and developed three online courses. His current fields of interest are numerical field computation, condition monitoring of electrical equipment and lifelong learning techniques.