IEEE TRANSACTIONS ON AUTOMATION SCIENCE AND ENGINEERING, VOL. 11, NO. 3, JULY 2014
775
A Robust Surface Coding Method for Optically Challenging Objects Using Structured Light Chi Zhang, Jing Xu, Ning Xi, Fellow, IEEE, Jianguo Zhao, and Quan Shi
Abstract—Though the structured light measurement system has been successfully applied to the profile measurement of diffuse objects, it is still a challenge to measure shiny objects due to the mix of both specular and diffuse reflections. To this end, we propose a robust encoding and decoding method in this paper. First, the monochromatic stripe patterns are utilized to eliminate the effect of texture and color of objects. Second, an intensity mask, dynamically adjusting the intensity of a projected pattern, is applied to avoid overexposure without any pre-knowledge of the workpiece. Thus, it is more flexible and efficient, compared with the existing methods. Third, to solve the internal reflection of the shiny part, an extrapolation model, combined with the intensity mask, is developed to detect the stripe edge for pattern decoding, resulting in accurate and robust 3D reconstruction. Compared with traditional polarization based methods, it does not need to readjust for a new part. The experimental results show that the proposed method is capable of measuring various parts without surface pretreatment.
[1], [2] has made great strides and has been utilized in many applications [3], [4] , such as quality inspection, 3D profile reconstruction [5], and reverse engineering. Generally speaking, a structured light measurement system is composed of a projector and a camera. The encoded patterns, also called structured light, are illuminated onto a workpiece from the projector and recorded by the camera. With the aid of structured light, the camera and projector pixels sharing the same codeword are corresponded and triangulated to obtain the 3D coordinate of the test objects. The measured point cloud of workpiece, can be further compared with the Computer Aided Design (CAD) model to evaluate the manufacturing quality.
Note to Practitioners—In the manufacturing industry, there is a demand to measure workpiece for quality control. A Coordinate Measurement Machine (CMM) is usually used. However, its pointwise measurement makes the inspection time consuming and cannot do 100% inspection for all the parts. Vision-based 3D reconstruction method could measure the parts quickly. But the method is weak against optically challenging objects. To this end, this paper proposed a robust surface coding method to measure the optically challenging object via a vision-based method.
Although some commercial structured light systems, which require a clearly detected pattern by the camera, have been successfully utilized in quality inspection, the technology still needs to conquer several challenges to extend its further applications. One of these challenges arises from the fact that many real-world objects have surface properties unideal for optical sensors, such as optically challenging objects. Optically challenging objects are objects with the undesired optical surfaces accounting for unclear patterns or invisible patterns in the imaging sensor, such as painted parts with different colors, materials with nonuniform reflection coefficients, and shiny metal work pieces. The texture and color of objects could influence the color-based structured light pattern. The nonuniform reflection coefficient could result in an under/overexposure problem; that is, it brings out a dilemma of the camera aperture: a bright area requires a small aperture, but a dark area needs a big aperture. The shiny workpiece induces the internal reflection phenomenon that a reflection light involves not only its directly reflected incident light of the illuminating source but also double bounced reflected incident lights in the neighborhood; therefore, a low illuminated area could be lighted up by a neighboring bright area, leading to a wrong codeword. Optically challenging objects have to be pretreated to diffuse reflection surface before 3D measurement. Aiming to solve these problems aforementioned, we developed an encoding and decoding method of structured light measurement system, which is capable of sampling dense 3D point clouds from optically challenging objects. The developed measurement system is expected to simultaneously have the following properties. 1) A color invariance encoding and decoding algorithm.
Index Terms—Encoding and decoding, intensity mask, internal reflection, optically challenging objects, structured light.
I. INTRODUCTION
T
HE DEVELOPMENT of a rapid and accurate optical measurement system is an active research area. Among existing techniques, the structured light measurement system
Manuscript received May 06, 2013; revised August 13, 2013; accepted October 05, 2013. Date of publication January 09, 2014; date of current version June 30, 2014. This paper was recommended for publication by Associate Editor Q. Huang and Editor S. Sarma upon evaluation of the reviewers’ comments. (Corresponding author: C. Zhang.) C. Zhang, N. Xi, and J. Zhao are with the Department of Electrical and Computer Engineering, Michigan State University, East Lansing, MI 48824 USA (e-mail:
[email protected]). J. Xu was with the Department of Electrical and Computer Engineering, Michigan State University, East Lansing, MI 48824 USA. He is now with the State Key Laboratory of Tribology, Beijing Key Lab of Precision/Ultra-precision Manufacturing Equipment and Control, and the Department of Mechanical Engineering, Tsinghua University, Beijing 100084, China. Q. Shi is with the PEPC Research Group, PPG Industries, Inc., Cheswick, PA 15024 USA Color versions of one or more of the figures in this paper are available online at http://ieeexplore.ieee.org. Digital Object Identifier 10.1109/TASE.2013.2293576
A. Problem Statement
1545-5955 © 2013 IEEE. Personal use is permitted, but republication/redistribution requires IEEE permission. See http://www.ieee.org/publications_standards/publications/rights/index.html for more information.
776
IEEE TRANSACTIONS ON AUTOMATION SCIENCE AND ENGINEERING, VOL. 11, NO. 3, JULY 2014
2) Dynamic control of projector illumination to avoid under/ overexposure issue and shadow problem. 3) Robust decoding against internal reflections. B. Literature Review For a structured light measurement system, the encoding and decoding method is the most critical factor, which can affect all measurement performances such as accuracy, precision, point density, and efficiency. The existing encoding and decoding strategies can be categorized into two types in terms of the number of projected patterns: one-shot and multishot. One-shot based methods only acquire one image from the test object and thus obtain their biggest merit, the capability to measure a moving object. Color-based methods [6], [7] and spatial-neighborhood methods [8], [9] are two common encoding strategies for one-shot pattern. However, the color-based method cannot be directly applied to the object with different colors, and the spatial-neighborhood method is inappropriate for an object with internal reflection. Therefore, the one-shot pattern is not suitable for the optically challenging object without pretreatment. Multishot strategy is only applicable for stationary objects, but it is more robust against image noise than a one-shot method. For this technique, Gray Code [10] with Phase Shifting (GCPS) [11], Gray Code with Line Shifting (GCLS) [12] have been widely utilized for diffuse object measurement. It is noted that the binary pattern GCLS is much more reliable than GCPS at the cost of more patterns in our previous study [27], especially for optically challenging objects. Recently, attempts have been made for optically challenging objects. For examples, Nayar [14] first built upon a shape-fromintensity method and iteratively approximated the 3D shape of the test objects. However, the method can be only applied to objects with relatively simple geometry. Further, the existing coding methods for the optically challenging object can be approximately divided into three categories: color invariance, polarization, and adaptive pattern methods [23], [25] [26]. Color invariance, combined with binary patterns [15], [16] , has been proposed for shiny objects. This method is based on the hypothesis that the effects of internal reflection and ambient light could be eliminated via color invariants. The internal reflection was not preserved under bas-relief transformation. However, the captured color is determined by both the color of the incident light and the color of the surface; thus, this method could face difficulty for the object with complex textures. The polarization method employs the fact that polarized light will be scattered to depolarized light by a rough surface; whereas, the polarized light still keeps polarization through the specular reflection [15], [18] . In this case, a polarizing filter can be used to completely block the polarized light of internal reflections of a specular area such that the shiny part can be measured. However, the polarizer has to be carefully adjusted for the object without knowing its optical properties, and the exact number of internal reflections. Obviously, this method is not flexible and is time-consuming. The adaptive pattern method is a preferred solution, due to its capability to dynamically modify the pixel intensity of the projector according to the scene to improve performance. The function of structured light is to find out the correspondence (the
term “correspondence” refers to subpixels with the same codeword between the camera and projector, which is obtained by an interpolation for final 3D reconstruction with subpixel accuracy in this paper). The intensity of the projected pattern needs to be properly adjusted to avoid overexposure by the feedback of the camera with the point spread function [27] (the term “point spread function” is used to figure out where the suitable projection intensity in the projector should be adjusted to avoid overexposure in the camera. In this paper, it is obtained by extrapolation with pixel accuracy). Practically, the point spread function is specified by the projected pattern and also determines the readjusted projected pattern, as the chicken-and-egg paradox. The basic philosophy of the adaptive pattern method is to iteratively obtain the optimal illuminated pattern for accurate correspondence. The adaptive pattern method has been successfully applied to diffuse object measurement. For instance, to speed up the measurement and eliminate shadow for the online requirement, an inverse fringe pattern based on multiprojectors is developed. Therefore, the complicated and discontinuous objects can be measured [19]. An adaptive pattern with varied spatial pitch is proposed to obtain improved measurement coverage and accuracy with minimum number of patterns [20], [21] . To develop a robust pattern inversion, the measurement procedure is simplified into different inversion tasks. The unwanted image can be constricted by the camera model to improve measurement performance [22]. However, the preceding measurement of a mast object is required for a sample measurement. To this end, Koninckx et al. [23] proposed a scene adapted structured light system to avoid under/overexposure problems, where not only the reflection coefficient by scene was considered, but also the nonlinear responses for both imaging devices were simulated. However, the approximate shape of the measured object had to be pre-known. Without the foreknowledge, the method lacked the flexibility required for the measurement of different objects. To develop a measurement strategy without the pre-known shape, Sen [24] estimated the point spread function by turning on each projector pixel one by one. However, the measurement procedure took very long time, resulting in low efficiency. An adaptive corresponding algorithm was also developed [25], [26] to measure objects with strong internal reflection. For this technique, the captured areas are classified to certain areas and uncertain areas. The certain areas are iteratively extracted and the uncertain regions will be intensively illuminated to measure the objects with strong internal reflection without any geometrical pre-knowledge. The limitation of the method is that the number of iterations is not fixed. In other words, it might take hours to inspect a scene [25], [26] . In comparison with the polarization method, this method is more robust since no manual adjustment is required. In summary, a robust, flexible, and fast inspection system for optically challenging objects is scarce for quality inspection. To our best knowledge, such a system for optically challenging objects is still missing in the literature. Motivated by these facts, we propose such a measurement system for optically challenging objects in this study. Monochromatic white and black (WB) stripe patterns are applied to avoid the influence of texture and color of measured objects. Then, a scene-based intensity mask is utilized to adjust the projection illumination so that the under/overexposure problem can be solved. Further, an
ZHANG et al.: ROBUST SURFACE CODING METHOD FOR OPTICALLY CHALLENGING OBJECTS USING STRUCTURED LIGHT
777
Fig. 1. Traditional encoding and decoding.
extrapolation model is developed to estimate the stripe edges for the pattern decoding to speed up the measurement. Therefore, shiny objects could be rapidly measured in our measurement system. The major contributions of this paper are as follows. a) The intensity mask is calculated without pre-known geometry of the test objects. The adaptive projection pattern can be automatically updated for different parts. b) An extrapolation model combined with the intensity mask is developed to prevent overexposure and internal reflection issues. c) The designed system is capable of measuring black, dark, and shiny objects simultaneously. The organization of this paper is as follows. Section II explains the encoding and decoding strategy and the details of each process. The experimental configuration and results are given in Section III. At last, conclusions are presented in Section IV.
Fig. 2. (a) Decoding based on binary pattern. (b) Miscoding when part is too dark. (c) Miscoding when part is too bright.
Fig. 3. Dual binary pattern for bright part: The first image subtract the second one to decode.
II. ENCODING AND DECODING STRATEGY A. Conventional Binary Pattern and Its Limitation The encoding and decoding process in a structured light system is used to find the correspondence between the camera and projector. A traditional monochromatic binary pattern based coding method can be described, as shown in Fig. 1. A series of binary patterns with intensities of 0 and 255, whose corresponding codewords are 0 and 1, are projected onto a measured object over time, and the reflected patterns are recorded by camera and decoded into codewords 0 and 1 through a threshold. In this case, the pixels in the camera and projector with the same codeword over time are corresponded. The conventional method selects half of the dynamic range, 128 for an 8 bit camera, as the binarization criteria if if otherwise
(1)
in (2) is a predefined value used to reduce the ambiguity. The bigger is, the more confidence in binarizing, but the less pixels are included. Fig. 2(a)–(c) show three decoding cases when the binary pattern is shot onto normal reflecting, dark and white parts. The white stripe is on the right side and the black one is on the left side. Both stripes change into zigzag lines because of a certain level of random image noise. The dash dot line in the center is the chosen threshold 128. If the received intensity is higher than the threshold, it is decoded as 1, shown as solid zigzag line. If not, it is decoded as 0 and is shown as dashed zigzag line. This decoding strategy only works for a normal case in Fig. 2(a), and it fails when the part is too dark (b) or too bright (c).
Fig. 4. The subtraction fails in saturation case.
B. Dual Binary Pattern and Its Limitation The dual binary pattern based decoding method assign each pixel an individual threshold to solve the above problem. The binary pattern is first projected and then follows its inverse pattern. The second image serves as the threshold and replaces the fixed value 128 in (2). The binarization strategy can be expressed as if if otherwise
(2)
Fig. 2 shows an example how dual binary pattern is decoded on a bright part, in which case the traditional method fails. Although the dual binary pattern is more robust than the tradition one, it could still fail in some extreme cases. When a shiny part is measured, some bright pixels become saturated and erode the near dark pixels due to internal reflection, which is shown in Fig. 4. In the first received image, the white stripe pixels grow to the right and dark stripe pixels shirk. In the second image the white stripe pixel grow to the left and erode the left side dark stripe. The middle pixels cannot be decoded by comparing and . If the measured part is in black, the received image suffers from underexposure. The intensity difference between and is
778
IEEE TRANSACTIONS ON AUTOMATION SCIENCE AND ENGINEERING, VOL. 11, NO. 3, JULY 2014
Fig. 5. Dual binary pattern fails in the underexposure case.
smaller than . The subtraction decoding can still fail, as shown in Fig. 5. To avoid the above cases, the light shooting on the black part should be enhanced and the light shooting on the shiny part should be reduced. The projection pattern can update itself based on camera feedback and quickly create an adaptive system to be robust for all different parts, from black, dark, normal, bright, to shiny. No foreknowledge is needed during the measurement, therefore the system can be flexible to any unknown parts. C. The Novel Adaptive Dual Binary Pattern The intensity of a projected pattern needs to rapidly compensate the nonuniform reflection coefficients of optically challenging objects. To overcome this problem, the so-called intensity adjusted pattern is generated through the multiplication of binary GCLS pattern and an intensity mask
A proper projected intensity in the projector can be derived from the inverse camera response function, ensuring that the captured intensity of camera is a suitable value without overexposure. Hence, (4) specifies the magnitude of the adjusted intensity . The prerequisite of adjustment of projected intensity is to figure out the location in the projector frame, which can be mapped into the corresponding pixel location in the camera frame by (5) Equation (5) ensures that the radiance from the projector pixel goes into the camera pixel . Once these two functions and are specified from captured the intensity of the camera, the intensity mask can be derived such that the overexposure and internal reflection can be removed. Thus, considering the camera as a feedback receiver, these two tasks can be integrated into one formula by (6) In this study, by adjusting the intensity mask , we can normalize the projection and capture chain with the assumption that a projector intensity of 255 will result in camera intensity of 255 without overexposure; that is
(3) denotes the pixel coordinate in the projector frame. where The exposure time and aperture are properly set with a unique pattern with an intensity of 255, ensuring that all the intensities in the camera could achieve 255 in advance to prevent underexposure problem. can be considered as a weighted coefficient: if , the pixel is turned off; if , the intensity of the projection is reduced; if , the intensity of the pixel remains the same. Apparently, internal reflections can be greatly suppressed if the intensity of neighboring incident light is reduced; the camera could view the overexposure area with the reduced appropriate intensity mask. Therefore, the projected intensity mask works as a feedback function from the camera to the projector. The camera aperture and projector brightness are set to maximum, so the system can measure the black part. The intensity mask can reduce the light shooting to shiny one to make it measurable. In order to obtain the appropriate intensity mask for fine correspondence between the camera and projector, the camera response function [23], [28] of the camera and the point spread function from the projector to the camera should be determined, which are the two most important tasks, and are described in detail in the following section. The relation between the captured intensity of the camera and the projected intensity of the projector can be represented by (4) where
denotes the pixel coordinate in the camera frame.
(7) for each pixel is different due to the Apparently, the nonuniform reflection coefficients of an optically challenging object. Therefore, the intensity mask has to be dynamically adjusted according to the captured intensity . To this end, is first utilized to transfer the camera pixel location into the projector pixel location , and then, specifies a desired projection intensity with the captured intensity of 255. The ratio between the desired projection intensity and the traditional binary pattern intensity of 255 is the intensity mask. In fact, to rapidly and reliably measure an optically challenging objects without pre-known geometry, the point spread function has to be established first. To figure out the point spread function through the projected pattern, we have to determine an appropriate intensity mask to avoid overexposure and internal reflection. However, to determine appropriate intensity mask, we should know the point spread function in the aforementioned section. Obviously, this is a paradoxical problem. To this end, the philosophy of the proposed strategy is elaborated as follows. 1) Initial projection of a pattern with uniform intensity to determine the camera response function , the initial guess of the point spread function and the intensity mask , with assumption that the measured object is a flat plane. 2) Advanced projection of the adjusted pattern to modify the point spread function and update the intensity mask .
ZHANG et al.: ROBUST SURFACE CODING METHOD FOR OPTICALLY CHALLENGING OBJECTS USING STRUCTURED LIGHT
779
albedo may cause the camera imaging problem. In this case, a proper feedback algorithm is required to simultaneously capture a clear projected pattern regardless of albedo. A camera response function reflects the radiometric chain from the projector to the camera by (8) and are constant coefficients during the where measurement process for each camera pixel. In this study, the inverse camera response function is used as the feedback function to eliminate scene albedo effects. To this end, and should be specified by projecting several uniform patterns. In order to obtain the camera response function in (8), we need two things. a) The coefficients and to find out the suitable projection intensity for a camera pixel without overexposure. b) The point spread function between projector pixel and camera pixel to find out where the suitable projection intensity should be located in the projector. Basically, the former one answers what the projection intensity is, and the latter one answers where this intensity should be located. Since it is difficult to realize both tasks simultaneously, task (a) is first addressed by a projected pattern with a single intensity. Thus, the point spread function can be ignored with such a pattern. Equation (8) can be rewritten by (9)
Fig. 6. The flow chart of the encoding and decoding strategy.
3) Project the updated pattern and evaluate the received images. Over/underexposed pixels are viewed as unqualified pixels. If the percentage of unqualified pixel exceeds the predefined threshold, step 2) will be repeated to update the point spread function and intensity mask. 4) Once enough valid pixels are collected, or the maximum iteration number is reached, the interpolation model will be applied to get subpixel accuracy correspondence and then calculate the 3D point cloud. The flow chart of the measurement procedure is as shown in Fig. 6. The details of the operation procedure are presented in the following sections. D. Derivation of the Camera Response Function High albedo could saturate the camera, that is, some highly saturated pixels spill over and affect neighbor pixel intensities, resulting in a shiny spot in a picture. On the other hand, low
The patterns with uniform intensities of 0, 50, 100, 150, 200, and 250 are projected to the measured objects to determine the coefficients and . Since projector’s gamma effect is not calibrated in the current study, so only intensities 50, 100, 150 are used in regressing the coefficients. To demonstrate the effect of photo the response function, Fig. 7(a) gives an example of a projected pattern with intensity of 100. Three points (marked from , , and ) with different photo response functions are selected in the camera to observe the captured intensity variations with respect to varied projected intensities, as shown in Fig. 7(b), where axis is the projected intensity of the projector, and axis represents the captured intensity of the camera. Three photo response curves are given for three different points , , and in the scene. is a point on a black object, so its captured intensity is always very low. Even with a projected intensity of 255, the captured intensity of point is still a little less than 90. To obtain the exact correspondence by GCLS pattern, the big camera response function is preferred. The solution is to increase the projector brightness, widen camera aperture, or extend the exposure time. can be viewed as a diffuse point, and the captured intensity is neither too shiny nor too dark. In this case, it is easy to find out the exact correspondence by GCLS pattern.
780
IEEE TRANSACTIONS ON AUTOMATION SCIENCE AND ENGINEERING, VOL. 11, NO. 3, JULY 2014
E. Initial Guess of the Point Spread Function The camera response function only solves the magnitude of the projected intensity of the projector; however, it cannot answer where appropriate projected intensity should be located. In other words, we have to determine the point spread function to assign the appropriate intensity to the correct location in the projector. In this study, the initial guess of the point spread function assumes the measured object is a flat surface plane. The point spread function between the camera and projector becomes a homography mapping by (10)
is the 3 3 homography matrix from the camera to where the projector, which can be calibrated through the measurement table in advance. In this case, for each pixel of the camera, we can get the initial corresponding pixel of the projector by homography matrix. It should be pointed out that the initial point spread function is not correct, and it will be corrected by the following strategy. F. Advanced Projection Pattern Generation Fig. 7. (a) The captured image of an pattern with intensity of 100. (b) Photo response functions for three points in the image.
Combining the initial guess of the point spread function and the camera response function, the initial intensity mask as shown in Fig. 9(a) can be derived via (7). However, the point spread function is not exactly the final correspondence. In this case, let the possibility of the real location be a Gaussian distribution around pixel , then the intensity mask is dilated by a certain radius as shown in Fig. 9(b). A GCLS pattern filtered with the intensity mask is shown in Fig. 9(c). G. Interpolation or Extrapolation Models in Image Binarization
Fig. 8. The proper projected intensities in the camera frame.
is a shiny point, and the captured intensity is prone to be saturated, resulting in overexposure. The way is to reduce the projection intensity by intensity mask. The parameters and can be regressed after the projected intensities and received intensities are substituted into the (9). The result of the proper projected intensity in the camera frame is given in Fig. 8. Similar to the film of a camera, the higher the intensity that the camera receives, the lower the projected intensity is.
The approximate point spread function for the intensity mask and the accurate correspondence for final surface reconstruction both require decoding of the captured image of the camera. However, the accuracies for these two tasks are different. In other words, the decoding accuracy for the intensity mask perhaps is at a pixel level to control the illumination; whereas, that for final surface reconstruction is at a sub-pixel level to establish the accurate correspondence between the camera and projector. In this study, the point spread function with pixel accuracy is used to adjust the illuminated pattern, resulting in an improved illumination condition; and then the correspondence with subpixel is realized. To this end, an extrapolation model for the point spread function and an interpolation model for final correspondence are both proposed. To be specific, the extrapolation model is able to rapidly specify the point spread function with pixel accuracy, even for internal reflection, while the interpolation model is needed to determine the final correspondence with subpixel accuracy. For the GCLS pattern, the decoding algorithm is achieved by the binarization method, which converts the captured images into codewords 1 and 0. Thus, a robust binarization method is
ZHANG et al.: ROBUST SURFACE CODING METHOD FOR OPTICALLY CHALLENGING OBJECTS USING STRUCTURED LIGHT
781
Fig. 9. (a) The initial intensity mask. (b) Dilated intensity mask. (c) One example of a projection pattern.
function, the location tensities , , , and
of the edge can be interpolated by inof projected and inverse patterns by (11)
Fig. 10. (a) A received image of projected pattern. (b) Received image for the inverse pattern. (c) Interpolation of the edge location. (d) Estimation of the edge location in a strong illumination condition.
critical for 3D measurement, especially for the optically challenging object. Binarization methods can be roughly classified into three categories. (1) Naive binarization with a fixed intensity threshold. (2) Adaptive binarization with different thresholds for different pixels. (3) Dual projection binarization method with an extra inverse pattern [11], [26] . Method (3) is the most robust against image noise, at a cost of double patterns. In this study, a modified dual projections binarization method is used. The edges of a stripe instead of the stripe itself is employed for line shifting. The blue lines in Fig. 10(a) and (b) denote the stripe edges. The subpixel interpolation of the edge location, as shown in Fig. 10(c), can be realized to improve the final correspondence accuracy, further leading to accurate 3D measurement. The appropriate intensity mask ensures that the WB stripes are clearly imaged in the camera without saturation, such that the edge falls within a camera pixel. In this case, a subpixel interpolation is capable of improving the measurement performance. In Fig. 10(c), axis is the coordinate of the captured image in one direction; and axis indicates the captured image intensity. The red line is the projected pattern and the blue line means the inverse pattern. Assuming that the intensity variation within two neighboring pixels and is a linear
It is noted that the interpolation constrains the error within one pixel. In the other side, the extrapolation of the edge location, as shown in Fig. 10(d), is used to specify the point spread function when overexposure internal reflection happen. If the overexposure and internal reflection appear, edge location detection has to be converted into extrapolation. For overexposure, the intensity of the captured white stripes is larger than 255. In this case, the blue line raises from point and reaches the maximum intensity 255 before point . The red line also drops from dashed line into the solid line. Consequently, point changes into and moves into such that and will not intersect with each other until their extensions merge. If internal reflection happens simultaneously, things become more complicated. Point could illuminate its neighborhood by internal reflection, with the result that line move backwards to . Similarly, Point illuminates the point and makes the line move forwards to . Therefore, the distance between point and is bigger than 1 pixel, that is, the white stripe erodes the dark stripe in the captured image such that the white stripe becomes wider than the dark stripe. Assuming that the intensity variations can still be simulated by linear functions, the stripe edge can be derived via extrapolation (12) It should be pointed out that the extrapolation requires a stronger assumption that the linear variation is not only within one pixel, but also within several pixels. In this case, the image noise will cause a big error, perhaps more than one pixel. This is also the reason why extrapolation is only used to approximately determine the point spread function rather than final correspondence. Fig. 11 shows the intensity mask with the derived point spread function. The intensity mask could perfectly control the projected pattern to avoid overexposure. It could also minimize the internal reflection by reducing the intensity of projected pattern
782
IEEE TRANSACTIONS ON AUTOMATION SCIENCE AND ENGINEERING, VOL. 11, NO. 3, JULY 2014
TABLE I ASSUMPTION ERROR (MM) VERSUS PIXEL DEVIATION
radius, the initial projection mask will contain an error. Based on system calibration information, a simulation is conducted to derive the relation between pixel deviation and assumption error in Table I. In current implementation, image dilation of 5 pixels is applied in the initial guess. When the initial assumption exceeds 20 mm from the real case, image dilation will not cover this error. The extrapolation model in Section II-G is designed to conquer errors left in the initial guess. The edge between the white stripe and black stripe is estimated by linear approximation. The accuracy of the edge in (12) is determined by the magnitude of random noise and the pixel distance . In an ideal case, and are 255 in an 8-bit camera. and both equal . The calculated edge is . In the simulation, we assume that both and contain percentage of image noise
Fig. 11. The final intensity mask.
(13) (14) The error in the edge estimation is:
Fig. 12. The correspondence pixel
changes according to the
.
in the shiny area. From the figure, we also see a lot of noise in the occlusion areas in the intensity mask, such as zoomed parts (a) and (b). The reason is that the projector cannot illuminate these locations or the camera cannot view the projected patterns. To solve this problem, we can move the structured light measurement system to different viewpoints. H. The Tolerance of Initial Guess and Extrapolation Model The tolerance of the initial guess and extrapolation model is critical in regressing the point spread function within a few iterations. In the initial guess of the spread function in sub section , the test object is assumed flat. Of course, the real measured object is different from the initial guess and the corresponding pixel of the projector will not be exactly located at but its neighbor pixel, as shown in Fig. 12. If the real surface is higher or lower than the assumed plane , the real location will be or , respectively, instead of . This pixel deviation or depends on the error in the assumption. The larger assumption error is, the bigger the pixel deviation is. Image dilation with a certain pixels is done to compensate for pixel deviation. If the pixel deviation exceeds the dilation
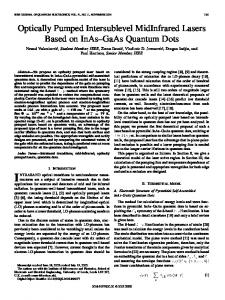
(15) The simulation results are shown in Fig. 13. If the image contains 10% noise, the extrapolation model can cover more than 20 pixels without inducing 1 pixel error. If there is 20% noise, the extrapolation model can still cover 12 pixels without inducing 1 pixel error. If the initial guess has more than 12 pixels error, more than one iteration is needed. III. EXPERIMENTS AND RESULTS The developed structured light measurement system is illustrated in Fig. 14. A CMOS camera (CSB4000F-10) and a LCD projector (Hitachi-CP-X253) are configured on an aluminium frame. The work pieces are put on the measurement table underneath. The measurement volume is 1000 750 400 . The resolutions of the camera and projector are 2044 2002 and 1024 768, respectively. In order to view the dark object, the brightness and the contrast of the projector are set to maximum; the aperture and exposure time are also set to a high value. Therefore, the measurement system can simultaneously measure black, dark, and shiny objects. As shown in Fig. 7(a), three work pieces (one black part, one dark part, and one shiny part) are used to test the proposed method. Five experimental results are given and discussed in this section: a) the intensity mask verification; b) the verification of interpolation and extrapolation models; c) measurement completeness evaluation; d) measurement accuracy validation; and e) comparisons.
ZHANG et al.: ROBUST SURFACE CODING METHOD FOR OPTICALLY CHALLENGING OBJECTS USING STRUCTURED LIGHT
783
Fig. 14. The structured light system configuration.
can be exactly found and the 3D measurement can be accomplished. Fig. 13. (a) The edge pixel error, if Image noise is 10%. (b) The edge pixel error, when Image noise is 20%.
A. Intensity Mask Verification In this study, a dynamic scene based intensity mask for adjustment of projected patterns is proposed for optically challenging objects. In order to validate the performance of the intensity mask, the captured images without and with the intensity mask are compared in Fig. 15. Fig. 15(a) is the captured image without the intensity mask, where overexposure and internal reflection exist in several areas. Many pixels suffer from saturation. Fig. 15(b) is the captured image with initial intensity mask. With the assumption of a flat object, the intensity mask generated by homography mapping could adjust the projected pattern. However, we can still see some shiny areas. The reason is that the height of the shiny region is much higher or lower than the flat plane such that the initial intensity mask is inappropriate. In other words, Fig. 15(b) demonstrates the point spread function is not close to the final correspondence in these areas. Fig. 15(c) is the captured image with the final intensity mask formed by the extrapolation. All the projected pattern are properly dynamically adjusted, resulting in the absence of shiny phenomena and overexposure. In this case, the final correspondence
B. Verification of Interpolation and Extrapolation Models Fig. 15 has revealed the general performance of the intensity mask. In this section, we verify the performance of interpolation and extrapolation via real captured images. More details are given as follows. 1) Verification of the interpolation model for final correspondence with subpixel accuracy. The interpolation model employs the intersection point to find the intensity edges. 2) Demonstration of the extrapolation model for the overexposure and internal reflection with pixel accuracy. The real intensity distribution in the internal reflection region should prove the extrapolation model. 3) Verification of the result of the influence of the adaptive intensity mask on stripe edge detection, including interpolation and extrapolation models. First, a black part with low camera response function and internal reflection is used to demonstrate the interpolation model with subpixel accuracy, which is mainly applied to the final correspondence. Fig. 16(a) and (b) are two captured images of a black part projected by the stripe pattern and inverse stripe pattern without intensity mask, respectively. The 39-pixel width of W/B stripe is same as the that of B/W stripe . The highly illuminated stripe does not erode the darker stripe due to overexposure or having a internal reflection; thus, the surface can be regarded as diffuse reflection. The pixels along the
784
IEEE TRANSACTIONS ON AUTOMATION SCIENCE AND ENGINEERING, VOL. 11, NO. 3, JULY 2014
Fig. 16. (a) A selected detail view of the black part when projecting pattern without the mask. (b) The same view when projecting the inverse pattern. (c) The intensity curve around point / .
TABLE II PATTERN BINARIZATION WITHOUT INTENSITY MASK FOR A BLACK OBJECT
Fig. 17. (a) A selected detail view of the shiny part when projecting pattern without the mask. (b) The same view when projecting the inverse pattern. (c) The intensity curve around point / .
Fig. 15. (a) The received image without the intensity mask. (b) The received image with the initial mask. (c) The received image with the final mask.
vertical line in Fig. 16(a) and (b) are scanned. The binarization of the stripe width for the stripe pattern and inverse stripe pattern are given in Table II. The pixel intensity curve around point / along the vertical direction, as shown in Fig. 16(c), are used to verify the interpolation model. The red curve is the intensity distribution along red line in Fig. 16(a), and the blue curve is the intensity distribution along blue line in Fig. 16(b).
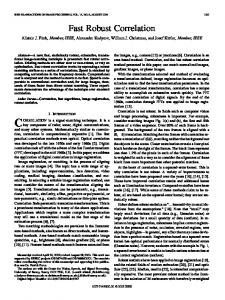
The intersection point is the detected edge between the white and black stripes. A pixel is decoded as 1, if the intensity of the stripe pattern is greater than that of intersection. The distribution of the real captured intensity is similar with the interpolation model developed in Fig. 10(c). The pixel intensities at pixel location 899 are 61 and 34, respectively; and the pixel intensities at location 900 are 29 and 64, respectively. The location of the intersection point is 899.4 by the interpolation model in (11). The interpolation model is verified by comparing intensity distributions in Fig. 16(c) and the curves in Fig. 10(c). In order to verify the extrapolation model, views of the shiny part are displayed in Fig. 17(a) and (b). Obviously, due to overexposure and internal reflection, the white stripe will erode the black stripe, resulting in the width of stripe is bigger than the stripe. The distance is 33 pixel, and the distance is 38 pixel. The width difference is the major problem from the overexposure and internal reflection. More clear information could be found in Fig. 17(c). Instead of an intersection point, the red curve and the blue curve share a common short line segment. The pixels within the common short line are always highly illuminated and can not be classified by traditional methods, leading to the failure of measurement of shiny regions. The extrapolation model in Fig. 10(d) can deal with such a situation. The intensity of the pixel 1292 and 1293 on the blue curve are 226 and 255, respectively; and the intensity of the pixel 1294 and 1295 on the red curve are 255 and 155, respectively. Applying extrapolation model in (12), the stripe edge could be estimated at location 1293.7. The distributions in Fig. 17(c) could verify the extrapolation model in Fig. 10(d). The extrapolation
ZHANG et al.: ROBUST SURFACE CODING METHOD FOR OPTICALLY CHALLENGING OBJECTS USING STRUCTURED LIGHT
785
Fig. 18. (a) A selected detail view of the black part when projecting pattern with the mask. (b) The same view when projecting the inverse pattern. (c) The intensity curve around point / .
Fig. 20. The 3D point clouds for the work pieces.
TABLE IV NUMBER OF THE POINT CLOUDS IN DIFFERENT EXPERIMENTS
Fig. 19. (a) A selected detail view of the shiny part when projecting pattern with the mask. (b) The same view when projecting the inverse pattern. (c) The intensity curve around point / .
TABLE III PATTERN BINARIZATION WITH INTENSITY MASK FOR A BLACK OBJECT
model result can successfully separate the high/low illuminated regions. Further more, to verify that the effect of illumination variation generated by the intensity mask on edge detection, the same views with intensity mask are captured, as shown in Figs. 18 and 19. Fig. 18 is used to verify that the intensity mask will not affect edge detection by interpolation in the diffuse reflection region, while Fig. 19 is employed to prove that the intensity mask is capable of reducing internal reflection in the shiny region. Fig. 18(a) and (b) are the two detailed views of the black part when the adaptive intensity mask is utilized. The stripe width still equals to with a value of 39 after applying the intensity mask filter. The binarization stripe width for the stripe pattern and inverse stripe pattern is shown in Table III. The result is almost the same as that in Table II. Fig. 18(c) shows the intensity curves around point / . The intensities at location 899 are 80 and 28, respectively; and the intensities at location 900 are 25 and 62, respectively. Applying interpolation model in (11) again, the edge location is 899.6. Compared to the results from Fig. 16, it could be concluded that the illumination variation generated by the intensity mask will not affect the decoding in the diffuse reflection region. Fig. 19(a) and (b) are two detailed views of the shiny part projected by a stripe pattern and an inverse stripe pattern with an intensity mask. The stripe widthes of W/B are same: . Compared to the results from Fig. 17, we could
conclude that internal reflection is eliminated. The same conclusion can be drawn from Fig. 19(c). After the projected pattern is filtered by the intensity mask, an intersection between two curves occurs. Instead of the extrapolation model, the interpolation model is utilized to locate the edge to improve the accuracy. The intensities at pixel 1293 are 133 and 80 respectively; and the intensities at pixel 1294 are 83 and 141 respectively. The edge can be located, 1293.5, by (11) for the final 3D correspondence. Compared with the location 1293.7 by the extrapolation, the location 1293.5 by the interpolation is much more reliable without overexposure and internal reflection. The difference “ ” also shows that extrapolation has acceptable accuracy. In summary, the illumination variation generated by the intensity mask will eliminate internal reflection in a shiny region without any negative effect on the diffuse region. C. Measurement Completeness Evaluation The output of a measurement system is a 3D point cloud. Thus, the evaluation of a point cloud is most important for system performance. Fig. 20 gives the point clouds of three work pieces by the developed measurement system. From the results, we can see that the system could measure the work pieces and provide dense point clouds regardless of optical property is: black, dark, and even shiny. Different from scene modeling results [26], the 3D point cloud will not contain any artificial interpolation or smoothness. The major advantage of the proposed method is to increase the completeness of the measurement results. The traditional measurement method cannot fully measure optically challenging objects without pretreatment. In order to evaluate the completeness, two additional experiments were conducted.
786
IEEE TRANSACTIONS ON AUTOMATION SCIENCE AND ENGINEERING, VOL. 11, NO. 3, JULY 2014
TABLE V COMPARISONS AMONG DIFFERENT METHODS
In the first experiment, the work pieces were sprayed with white powder. The camera and projector settings, such as camera aperture, projector and brightness contrast, were properly readjusted to avoid under/overexposure. The work pieces are measured by a traditional pattern without an intensity mask. The number of points in the point cloud is considered as a baseline. If any inspection result reached the same number of points, the inspection completeness is considered to be 100%. Our results and the first experimental results are compared to find out the completeness of our method. The second experiment is to measure the same work pieces by using the pattern without neither the intensity mask nor pretreatment. The patterns without the adaptive mask are projected. In this experiment, the camera aperture can not be adjusted perfectly because the black piece requires a large aperture, but the shiny piece needs a small aperture. The aperture is set around the middle: perfect for the dark piece, but too big to the shiny part and too small to the black part. Our results and the second experimental results are compared to find out the improvement degree of the proposed method. The results are listed in Table IV. The second column in Table IV is the result of the first experiment, and the number of points are considered as the baseline; thus, completeness is defined as . The third column in Table IV is the result by the traditional inspection method without intensity mask and without pre-treatment. We can see that more than half of the black workpiece cannot be reconstructed, and around one tenth of the other two work pieces cannot be rebuilt. The reason that the black piece had poor performance is that the aperture size is adjusted relatively small. Therefore, the measurement of the shiny part is relatively good but the black workpiece is very poor. The fourth column shows the completeness of our method: all the parts can be inspected over 97%. Around 50% of the completeness is improved for the black workpiece and around 7% of the completeness is improved for the other two. Because the intensity mask could dynamically adjust the illumination, the system could simultaneously inspect both the shiny part and the black part. D. Measurement Accuracy Validation A metal sheet is used to validate the measurement system accuracy. The procedure is described as follows: The metal sheet is first measured by a CMM, and the measurement result is considered as the ground truth. Then, this workpiece is re-measured by the proposed structured light system. The measurement procedure follows the flow chart in Fig. 6.
Fig. 21. The 3D point clouds for the work pieces.
Fig. 21 shows the measurement difference between the CMM and the developed system in this paper. The mean difference between these two point cloud is 0.1031 mm, the standard deviation is 0.0501 mm. It should be point out that system accuracy can be increased by a short measurement distance. E. Comparisons Comparisons with several methods developed for optically challenging objects in Table V are used to evaluate the proposed method. Appropriate indices should be selected to make a fair comparison, including capability, flexibility, cost, speed, and completeness. The first row shows three major methods developed for optically challenging objects. The second row lists the papers using those methods. The third row and the fourth row indicate the capability of the designed method. All the methods could measure the shiny objects. However, only adaptive projection-based methods could measure black parts, which can absorb the color information and whose reflection coefficients are much smaller than shiny parts. Thus, color invariance-based methods [16], [17] [15] fail to measure black parts. Method in [15] implemented two ways to measure shiny parts: both color based and polarizer-based methods, but they did not mention the inspection of black parts. The fifth and sixth rows show the flexibilities of the methods. Polarizer based methods and the method in [23] required pre-knowledge of the part. Polarizer based methods had to be readjusted if a new part is inspected. From the seventh row, we could see that the methods in [15] required additional devices: polarizers or color filters. The eighth row provides the inspection speeds. The method [25], [26] has
ZHANG et al.: ROBUST SURFACE CODING METHOD FOR OPTICALLY CHALLENGING OBJECTS USING STRUCTURED LIGHT
very good performance in all the categories: capability, flexibility, cost, and completeness. However, the method took up to 22 loops to finish inspection and the inspection time could be more than 2 hours. Our method is a little slower compared with the rest, but it can sample over 97% of points within 3 iteration, which is about 7 mins. The completeness of the point cloud is the most important parameter showing the validation of the method. Shiny parts and black parts could reduce the result completeness. However, very few papers listed this information: [25], [26] is around 95% and ours is more than 97%. In summary, our method has best overall performance, taking into account the capability, flexibility, cost, and completeness with fair inspection speed. IV. CONCLUSION AND DISCUSSIONS In this paper, we have developed a coding algorithm of structured light to measure optically challenging objects without pretreatment or any preinformation. The developed method is capable of measuring objects with different reflectance, including black, dark, and shiny surfaces. To increase the robustness, monochromatic WB patterns, instead of color patterns, are utilized. An adaptive intensity mask is adopted to dynamically adjust the pattern intensity to prevent overexposure in shiny regions. Point spread function and camera response function are calculated to derive the proposed intensity mask. Conventional methods either rely on pre-knowledge or utilize time-consuming iteration methods to estimate point spread function. The method we developed usually takes 3 iterations, 7–8 min, to quickly find the point spread functions. The initial point spread function is first approximated by assuming test object is flat, and then be refined in advanced projection process, in which extrapolation calculation is used to correct the assumption error. At last, binary patterns combined with final projection mask, are used to set up correspondence for 3D reconstruction. Furthermore, by comparing with different previous methods, the developed method is proved to be more robust and flexible, regardless of the per-known geometry and object reflectance. The experimental results also show that the proposed method is capable of eliminating the effect of scene albedo, avoiding overexposure and internal reflection, achieving sub-pixel accuracy of decoding, improving measurement completeness. The limitation of the method is: more iterations are need, when the test object is too far away from the initial assumption. REFERENCES [1] S. Kurada and C. Bradley, “A review of machine vision sensors for tool condition monitoring,” Comput. Industry, vol. 34, no. 1, pp. 55–72, 1997. [2] S. T. Newman and A. K. Jain, “A survey of automated visual inspection,” Comput. Vision Image Understanding, vol. 61, no. 2, pp. 231–262, 1995. [3] S. H. Dupont, J. Kastelik, and M. Pommeray, “Structured light fringe projection setup using optimized acousto-optic deflectors,” IEEE/ASME Trans. Mechatronics, vol. 4, no. 4, pp. 557–560, Aug. 2010.
787
[4] M. Rea, D. McRobbie, H. Elhawary, Z. T. H. Tse, M. Lamperth, and I. Young, “System for 3-D real-time tracking of MRI-compatible devices by image processing,” IEEE/ASME Trans. Mechatronics, vol. 13, no. 3, pp. 379–382, Jun. 2008. [5] Q. Shi, N. Xi, and H. Chen, “Calibration of robotic area sensing system for dimensional measurement of automotive part surfaces,” in Proc. IEEE/RSJ Int. Conf. Intell. Robot. Syst., 2005, pp. 1526–1531. [6] M. A. Tehrani, A. Saghaeian, and O. R. Mohajerani, “A new approach to 3D modeling using structured light pattern,” in Proc. 3rd Int. Conf. Inform. Commun. Technol. From Theory Appl., 2008, pp. A1–5. [7] P. Payeur and D. Desjardins, “Structured light stereoscopic imaging with dynamic pseudo-random patterns,” in Proc. IEEE Int. Conf. Robot. Autom., 2009, pp. 687–696. [8] C. Albitar, P. Gracbling, and C. Doignon, “Robust structured light coding for 3d reconstruction,” in Proc. IEEE Int. Conf. Comput. Vision, 2007, pp. 14–20. [9] J. Xu, N. Xi, C. Zhang, Q. Shi, and J. Gregory, “Real-time 3D shape inspection system of automotive parts based on structured light pattern,” Opt. Laser Technol., vol. 43, no. 1, pp. 1–8, 2010. [10] A. Inokuchi, K. Sato, and F. Matsuda, “Range imaging system for 3-D object recognition,” in Proc. Int. Conf. Pattern Recognit., 1984, pp. 806–808. [11] D. Scharstein and R. Szeliski, “High-accuracy stereo depth Maps using structured light,” in Proc. Int. Conf. Comput. Vision Pattern Recognit., 2003, pp. 195–202. [12] Q. Shi, N. Xi, and Y. Chen, “Recursive measurement process for improving accuracy of dimensional inspection of automotive body parts,” in Proc. IEEE Int. Conf. Robot. Autom., 2007, pp. 4764–4769. [13] J. Xu, N. Xi, C. Zhang, J. G. Zhao, B. T. Gao, and Q. Shi, “Rapid 3D surface profile measurement of industrial parts using two-level structured light patterns,” Opt.d Lasers Eng., vol. 49, no. 7, pp. 907–914, 2011. [14] S. Nayar, K. Ikeuchi, and T. Kanade, “Shape from inter-reflections,” in Proc. Int. Conf. Comput. Vision, 1990, pp. 2–11. [15] Q. Hu, K. G. Harding, X. Du, and D. Hamilton, “Shiny parts measurement using color separation,” in Proc. SPIE, Int. Soc. Optical Eng., 2005, vol. 6000, pp. 60000D–8, 1. [16] R. Benveniste and C. Ünsalan, “Binary and ternary coded structured light 3D scanner for shiny objects,” in Proc. 25th Int. Symp. Comput. Inform. Sci., 2010, pp. 241–244. [17] R. Benveniste and C. Ünsalan, “A color invariant based binary coded structured light range scanner for shiny objects,” in Proc. Int. Conf. Pattern Recognit., 2010, pp. 798–801. [18] J. Clark, E. Trucco, and L. Wolff, “Using light polarization in laser scanning,” Image Vision Comput., vol. 15, no. 2, pp. 107–117, 1997. [19] Y. Y. Cai and X. Y. Su, “Inverse projected-fringe technique based on multi projectors,” Opt Lasers Eng., vol. 45, no. 10, pp. 1028–1034, 2007. [20] T. Peng and S. K. Gupta, “Model and algorithms for point cloud construction using digital projection patterns,” Trans. ASME J. Comput. Inform. Sci. Eng., vol. 7, no. 4, pp. 372–381, 2007. [21] T. Peng and S. K. Gupta, “Algorithms for generating adaptive projection patterns for 3-D shape measurement,” ASME J. Comput. Inform. Sci. Eng., vol. 8, no. 3, pp. 265–277, 2008. [22] W. S. Li, T. Bothe, W. Osten, and M. Kalms, “Object adapted pattern projection—Part I: Generation of inverse patterns,” Opt. Lasers Eng., vol. 41, no. 1, pp. 31–50, 2004. [23] T. P. Koninckx, P. Peers, P. Dutré, and L. V. Gool, “Scene-adapted structured light,” in Proc. IEEE Comput. Soc. Conf. Comput. Vision Pattern Recognit., 2005, vol. 2, pp. 611–618. [24] P. Sen, B. Chen, G. Garg, S. Marschner, M. Horowitz, M. Levoy, and H. Lensch, “Dual photography,” in Proc. 32nd Int. Conf. Comput. Graph. Interactive Tech., 2005, pp. 745–755. [25] Y. Xu and D. G. Aliaga, “Robust pixel classification for 3D modeling with structured light,” in Proc. Graph. Interface 2007, 2010, pp. 233–240. [26] Y. Xu and D. G. Aliaga, “An adaptive correspondence algorithm for modeling scenes with strong interreflections,” IEEE Trans. Visualization Comput. Graph., pp. 465–480, May-Jun. 2009. [27] P. J. Shaw and D. J. Rawlins, “The point-spread function of a confocal microscope: Its measurement and use in deconvolution of 3-D data,” J. Microscopy, pp. 151–165, 1991. [28] S. Zhang and S. T. Yau, “Generic nonsinusoidal phase error correction for three-dimensional shape measurement using a digital video projector,” Appl. Opt., pp. 36–43, 2007.
788
IEEE TRANSACTIONS ON AUTOMATION SCIENCE AND ENGINEERING, VOL. 11, NO. 3, JULY 2014
Chi Zhang received the B.E. degree in electrical engineering from the Harbin Institute of Technology, Harbin, China, in 2003, the M.S. degree in electrical engineering from Helsinki University of Technology, Helsinki, Finland, in 2005, and the Ph.D. degree in electrical engineering from Michigan State University, East Lansing, MI, USA, in 2012. He is now a Computer Vision Engineer at Faro Technology. His research interests include 3D inspection based on machine vision, structured light encoding and decoding, image processing, system calibration, environmental reconstruction, 3D point cloud registration, and sensor fusion.
Jing Xu received the B.E. degree in mechanical engineering from the Harbin Institute of Technology, Harbin, China, in 2003 and the Ph.D. degree in mechanical engineering from Tsinghua University, Beijing, China, in 2008. He was a Postdoctor in the Department of Electrical and Computer Engineering, Michigan State University, East Lansing, MI, USA. Currently, he is an Associate Professor with the Department of Mechanical Engineering, Tsinghua University, Beijing, China. His research interests include vision-guided manufacturing, image processing, and medical robotics.
Ning Xi (S’89–M’95–F’07) received the B.S. degree in electrical engineering from the Beijing University of Aeronautics and Astronautics, Beijing, China, in 1982, the M.S. degree in computer science from Northeastern University, Boston, MA, USA, in 1988, and the D.Sc. degree in systems science and mathematics from Washington University, St. Louis, MO, USA, in 1993. Currently, he is a Professor with the Department of Electrical and Computer Engineering, Michigan State University, East Lansing, MI, USA. His research interests include robotics, manufacturing automation, intelligent control, and systems. Dr. Xi received the Best Paper Award from the IEEE/RSJ International Conference on Intelligent Robots and Systems in August 1995, and the Best Paper Award in the 1998 Japan-USA Symposium on Flexible Automation. He was awarded the First Early Academic Career Award by the IEEE Robotics and Automation Society in May 1999. In addition, he is also a recipient of the National Science Foundation CAREER Award.
Jianguo Zhao, photograph and biography not available at the time of publication.
Quan Shi, photograph and biography not available at the time of publication.