Hsieh et al. observed a maximum bandwidth of only 92 Mbits/sec ... software performance monitoring tools, we were able to evaluate and analyze the ...
Performance of High-Speed Network I/O Subsystems: Case Study of A Fibre Channel Network Mengjou Lin, Jenwei Hsieh, and David H.C. Du1 Computer Science Department University of Minnesota Minneapolis, MN 55455
James A. MacDonald1
Army High Performance Computing Research Center University of Minnesota Minneapolis, MN 55415
Abstract Emerging high-speed networks provide several hundred megabits per second to several gigabits per second of raw communication bandwidth. However, the maximum achievable throughput available to the end-user or application is quite limited. In order to fully utilize the network bandwidth and to improve the performance at the application level, a careful examination of I/O subsystems is essential. In this paper, we study one emerging high-speed network, the Fibre Channel network. The objectives of this study are : 1) to understand how the I/O subsystem relates to network operations, 2) to evaluate and analyze the performance of such a subsystem, and 3) to propose possible approaches for improving the maximum achievable bandwidth and reducing end-to-end communication latency. We will show (by simply modifying device driver code) a 75% maximum achievable bandwidth improvement and a 15.9% latency reduction for short packets. Other ways of improving network performance are also discussed.
Keywords: I/O Subsystem, Performance Evaluation, Fibre Channel, Host Interface.
To appear in Supercomputing'94 (November, 94).
This work was supported in part by the Army High Performance Computing Research Center, under the auspices of Army Research O�ce contract number DAAL02-89-C-0038 with the University of Minnesota. 1
1 Introduction The required communication between processors has long been the performance bottleneck of applications distributed across a network. Several factors a�ect communication performance, including: the host architecture (both hardware and software components), the network interface, and the network transmission speed. For emerging high-speed networks such as Asynchronous Transfer Mode (ATM), Fibre Channel, and HIgh Performance Parallel Interface (HIPPI), the transmission speed ranges from several hundred megabits per second to several gigabits per second. Combined with recent increases in processor speed and memory bandwidth, the communication performance between processors is expected to improve dramatically. However, the maximum achievable bandwidth at the application level is still very far behind the available \raw" network bandwidth. For the XUNET II ATM trial, an application level bandwidth of 40 megabits per second (Mbits/sec) has been reported [7]. The ATM network had a raw communication bandwidth of 160 Mbits/sec2 , so the application bandwidth was only one fourth of the available network bandwidth. Hsieh et al. observed a maximum bandwidth of only 92 Mbits/sec for an experimental 800 Mbits/sec HIPPI network [11]. The major cause of this poor performance was the interaction required between the host and the network interface for each network operation. We shall refer to the I/O subsystem related to network operations as the Network Subsystem. To improve application level performance and fully utilize the network capacity of emerging high-speed networks, it is important to carefully examine the network subsystem in detail. Network subsystems involve many components and can be categorized into three major areas: the hardware architecture of the host, the host software system, and the network interface. The hardware components in the host architecture includes: memory, system bus, I/O adapter, and I/O bus. Ramakrishna compared the trade-o�s between Direct-Memory Access (DMA) and Programmed I/O (PIO) for moving data between host memory and the network interface on a DECstation [17]. Host software consists of the operating system, the application programming interface (API), higher level protocol processes, and the device driver for the network interface. The device driver acts as a system agent which interacts with the network interface. Several articles have discussed communication latency in the context of host software systems. Pasquale et al. proposed operating system support to reduce data copying across di�erent communication domains [15]. Lin et al. found signi cant overhead incurred by APIs using ATM networks [13]. Clark analyzed the TCP protocol processing time and found the protocol processing time was not very signi cant [8]. Banks and Prudence presented an improvement for higher level protocols by reducing the number of data copies required across the system bus [6]. Zitterbart proposed a functional based communication model that allows applications to request individually tailored services from the network subsystem [19]. Other researchers have studied the performance of the network interface. Berenbaum et al. designed a programmable ATM host interface [7]. \Afterburner" is a network-independent interface which provides architectural support for a high-performance protocol [9]. The VMP network adapter board has on-board protocol processing to improve communication performance [12]. 2
This is not a regular ATM OC-3 rate.
1
In this paper we examine a network subsystem for an emerging high-speed network called Fibre Channel. The objectives of this work is: 1) to understand the network subsystem and how it relates to network operations, 2) to evaluate and analyze the performance of such a subsystem, and 3) to propose possible approaches to improve application level throughput and reduce endto-end communication latency. The Fibre Channel device driver was monitored to understand how the network subsystem performs operations (basically it converts user-level requests into interface commands and sends the commands to the network interface). By using hardware and software performance monitoring tools, we were able to evaluate and analyze the performance of the network subsystem. Timing analysis was used to nd performance bottlenecks in the network subsystem. Fibre Channel is a promising and emerging high-speed network technology that can satisfy the communication requirements of many large-scale distributed applications. It o�ers both circuit switching and packet switching at multiple data rates: 25.805 MBytes/sec, 51.61 MBytes/sec, and 103.22 MBytes/sec [4]. Three classes of service (Class 1 through 3) are o�ered to users. Class 1 service establishes a dedicated connection which is retained by the switching fabric with guaranteed maximum bandwidth. It o�ers a reliable, sequenced, and ow-controlled data delivery. Class 2 and Class 3 services are connectionless services in which the frame sequence order is not guaranteed. The di�erence between these two is the acknowledgment scheme used in the frame delivery for Class 2 service. The device driver is the link between the network interface and other system components. By analyzing the device driver, we were able to observe the data and control of each network operation and thus study the interactions among the various network subsystem components. A careful examination of the timing sequence of the network operations was used to evaluate the communication performance of the three classes of FC service. Based on a simple timing analysis of these three services, we were able to identify several performance bottlenecks of the network operations. We found that application performance could be improved by simply modifying the device driver code. Since the device driver is a software component, it is relatively easy to modify. Thus, the modi cation of existing device driver code represents one way to exploit and improve the capacity of the network subsystem. The communication latency of the three classes of FC service can be partitioned into multiple timing phases. Each timing phase represents the time spent on the interactions of several components of the network subsystem. For example, a Class 1 sending process can be partitioned into the following four phases: entering the API, data movement, transmission over the physical network, and exiting the API. The phases of entering and exiting the API involve the application programming interface, le subsystem (operating system), interrupt handling mechanism, and acquisition/release of the network interface. The data movement phase re ects the interactions among the memory subsystem, cache, system bus, I/O adapter, I/O bus (VME bus), and the DMA controller on the network interface. The physical transmission phase represents the communication behavior of the network interface. This paper describes how the end-to-end performance of FC networks can be improved. We consider several network parameters, including: theoretical limitations of the network interface, characteristics of the network standard, the operating system of the host machines, the system 2
bus and I/O bus architecture, and the control/data ow through the network subsystem. We brie y review the environment under consideration in Section 2. In Section 3, we divide the communication timing of the three classes of service into disjoint partitions and collect timings for each partition using performance monitoring tools. For each partition, we derive simple timing equations to approximate the measured results. The derived equations can be used to predict the application level performance of di�erent approaches. In Section 4 and 5, we examine ways to improve network bandwidth and communication latency of an application executing in this environment. We close with conclusions in Section 6.
2 Overview of the FC Test Environment In this section, we brie y describe the Fibre Channel (FC) standard and the FC test environment used for our study. The test environment includes an Ancor CXT 250 16-port Fibre Channel switch which interconnects Silicon Graphics 4D Series workstations equipped Ancor Communications' CIM 250 interface board. We also summarize the interface commands supported by the Fibre Channel interface board as all of the device drivers in our study used the interface commands to communicate with the FC network interface. Finally, we describe hardware and software performance monitoring tools.
2.1 The Fibre Channel Standard Fibre Channel is a standard being developed under the ANSI X3T9.3 task group. The Fibre Channel standard is organized into the following levels [4].
� FC-0 de nes the physical media and links with the receivers and transmitters. Single-mode � � � �
ber, multi-mode ber, coaxial cable, and shielded twisted pair are de ned as transmission media. FC-1 describes an 8B/10B transmission code which bounds the maximum run length of a code, maintains DC balance, and provides word alignment. FC-2 de nes the signaling protocol which includes the frame structure and byte sequences. Figure 1 is a diagram that shows the format of an FC-2 data frame. FC-3 de nes a set of services which are common across multiple ports of a node. FC-4 is the highest level in the standard set. It de nes the mapping, between the lower levels of the Fibre Channel and other Upper Level Protocols (ULPs) such as IPI (Intelligent Peripheral Interface), SCSI (Small Computer System Interface) command sets, HIPPI data framing, and IP (Internet Protocol.)
Three classes of service (1 through 3) are o�ered to users. Class 1 provides dedicated connection service. Data frames are delivered to the destination in the same order they are transmitted 3
(4) Idle Words
SOF
(24) Frame Header
Optional Header
(0 to 2112)
(4)
(4)
Data Field
CRC
EOF
Optional Header
Idle Words
Payload
(64)
Unit = byte
Figure 1: FC-2 Frame Format Node A
Fabric
N_Port A(1)
F_Port T
Adapter R T Adapter R
Outbound fibre Inbound fibre Outbound fibre Inbound fibre
N_Port A(2)
Node B F_Port
R
T
T
R
R
T
T
R
F_Port
N_Port B(1) Inbound fibre Outbound fibre Inbound fibre Outbound fibre
F_Port
R Adapter T R Adapter T N_Port B(2)
Figure 2: Fibre Channel Physical Model by the source. Both Class 2 and Class 3 services are connectionless services. Class 2 service guarantees noti cation of delivery or failure to deliver, while Class 3 supports unacknowledged delivery. Class 1 service will be used by applications requiring a guaranteed communication bandwidth for a long period of time (e.g., scienti c visualization applications). Class 2 will be used by applications where multiple transfers are open at one time with frames from the di�erent transfers multiplexed on a single ber (e.g., the client/server model of distributed computing). Class 3 is designed to be used for applications like the data link layer of connectionless network protocols such as IP [10]. Figure 2 is a block diagram which shows the Fibre Channel physical model. As shown in the block diagram, an interconnection fabric may be used as a switching device between nodes. Its connections to the nodes are called F Ports. Some existing Fibre Channel switches are nonblocking Clos type switches [3, 14]. The interface cards give Fibre Channel capability to nodes. Their Fibre Channel connections are called N Ports.
2.2 System Con guration In our FC test environment, two SGI workstations were used. The source side was a 4D/320VGX and the sink side was a 4D/340S. Each workstation was equipped with an Ancor VME CIM 4
250 Fibre Channel interface board which was connected to an Ancor CXT 250 Fibre Channel switch.
2.2.1 Fibre Channel Interface Board A VME CIM 250 Fibre Channel interface board furnishes one N Port to a workstation [1]. It provides FC-2 (Signaling), FC-1 (Transmission), and FC-0 (interface) levels of the Fibre Channel protocol. The VME CIM 250 acts as a bus master when using DMA to moving data between the host system and the interface board. The VME CIM 250 consists of the following components:
� � � � �
a Very High Speed Communications Interface (VHSCI) ASIC. a 265.6125 megabaud IBM Optical Link Card (OLC-266). a NEC V53 CPU for I/O processing. an 8 Mbyte bu�er with parity for high speed data transfer. VME bus interface logic.
The OLC-266 provides a transmission rate around 266 Mbits/sec. After the 8B/10B converting, the raw physical data rate is 212.8 Mbits/sec. Access to the Fibre Channel interface is through the VME bus. The device driver puts an address (address line A02-A31) and an address modi er (AM0-AM5) on the VME bus. The address modi er is code that controls access to the VME bus. When the host is the VME master and the interface board is the VME slave, the host uses short address (16-bit address 16-bit data, A16D16) to write commands to, or read responses from, the interface board. When the interface board performs a DMA (Direct Memory Access) transfer, the interface board is the VME master and the host is the VME slave. The interface board uses extended address (32-bit address 32-bit data, A32D32) to move data between the host memory and the bu�er on the interface board. The VME CIM 250 uses block transfer mode to speed up data movement. The maximum size for each VME block transfer is 256 bytes. The theoretical bandwidth of a VME bus is 40 MBytes/sec when applying the block transfer mode [16]. The device driver uses the following on board registers to communicate with the Ancor VME CIM 250:
� Command FIFO (Cmd FIFO) (First In First Out Queue) { written to by the device driver.
All commands sent from the driver to the interface board go into the Command FIFO. � Response FIFO - read by the device driver. All commands sent from the interface board to the driver go into the Response FIFO. � Command/Response FIFO Status { written to by the interface board and read by the device driver. The device driver uses it to detect whether the Command FIFO is half full or full and whether the Response FIFO is half full or empty. 5
� Mailbox { used by the driver to tell the interface board which Interrupt Request line (IRQ)
to use when interrupting the driver. The interface board reads the contents of the Mailbox during an initializing sequence and then uses the appropriate IRQ for sending subsequent interrupts to the host.
When transmitting Class 1 data out through the N Port, the device driver uses the Command FIFO to set up an adapter-controlled DMA transfer from host memory to the interface board. The data then passes across the VME bus, through the VHSCI, and out the N Port. To transmit Class 2 and 3 data, the driver passes the data through the Command FIFO. In Ancor's VME Fibre Channel implementation, the message size for Class 2 and 3 can not exceed 128 bytes. When receiving Class 1 data from the N Port, the interface board bu�ers the incoming data, then uses the Response FIFO to tell the driver that it must set up for an adapter-controlled DMA transfer from the interface board to host memory. The data is then sent across the VME bus to the host memory. For receiving Class 2 and 3 data, the interface board bu�ers the incoming data, then passes it to the host through the Response FIFO.
2.2.2 Fibre Channel Switch The CXT 250 16-port switch is the Fabric component of a Fibre Channel compliant network. The CXT 250 switch is a two-dimensional switching architecture using space-division and time-division interconnection techniques to implement the Fibre Channel fabric. Spacedivision switching provides a circuit-switch mechanism that allows direct connections (FC Class 1 service) between nodes on the network. Time-division switching provides a packet-switch mechanism which allows time-multiplexed connections and datagram service (FC Class 2 and 3) among all nodes on the network [2].
2.2.3 Host System The Silicon Graphics 4D/3xx series workstations are shared memory multiprocessor systems equipped with 33 MHz MIPS R3000 processors. The system bus has a bandwidth of 64 MByte/sec. The I/O bus (VME bus) connects to the system bus through an I/O adapter called the IO3 card. This is the fundamental component of the I/O subsystem. One important function of the IO3 is to provide the page mapping hardware necessary to transmit a continuous stream of the data between the network interface and noncontiguous physical memory locations. Figure 3 is a functional block diagram of an SGI 4D series workstation. The diagram also shows how the Fibre Channel interface board connects with the I/O adapter.
2.2.4 System Software Architecture User programs access the Fibre Channel device through low-level Unix I/O system calls, which include open(), close(), read(), write(), and ioclt(). In the Unix operating system, all 6
CPU MIPS R3000
FC Interface
FC Switching Fabric
IO3 Memory
System Bus
VME Bus
Figure 3: High Level View of an SGI 4D Series Workstation devices are treated as les [5]. The Fibre Channel controller is referenced by a special device le /dev/fcN, where N represents the Fibre Channel interface board number when multiple boards reside in the same host. A sample program segment to access the Fibre Channel is shown below. /* open the device */ if ((fd = open("/dev/fc0", O_WRONLY)) < 0){ perror("Fibre Channel open error"); exit(1); } /* set the destination address */ ioctl(fd, FC_DESTADDR, &dest); /* Class 1 write */ if ((len = write(fd, (char *)txbuf, nbytes)) < 0) perror("Fibre Channel write failed"); /* Class 2 or 3 write */ if (ioctl(fd, FC_23_WRITE, &fio) < 0) { perror("start ioctl[FC_23_WRITE] failed"); close(fd); exit(-1); } close(fd);
The open() system call is used to acquire access to the Fibre Channel interface. ioctl() is used to set the destination port number on the switch. The write() system call is used for Class 1 service and it will block until the entire bu�er is transmitted. The returned value from write() represents the actual number of bytes that have been transmitted. When the process nishes its task, close() is used to free up the resources used in the driver for this process. For Class 2 and 3 service, a special ioctl() option, FC 23 WRITE, was implemented. A user can pass information to the device driver using the following o structure: struct fastio {
7
SGI 4D/340 1
2
9
10
5
3 Device Driver
Operating System
User
Ancor VME CIM 250
Firmware 8
7
Fibre Channel Switch Clouds 4 IO Adaptor
Memory
6 DRAM 8 Mbytes
Control and Data Timing Sequences: 1
User issues write system call (or ioctl) for Class 1 (2 and 3)
2
Kernel calls driver routines via Character Device Switching Table
3
Driver communicates with Interface firmware
4
Interface (Driver) moves data using DMA for Class 1 (PIO for Class 2/3)
5
Interface logins to remote N_Port via switch
6
Interface physically transmits data through FC
7
The driver of receiving site issues a completion acknowledgement (Class 1 and 2 only)
8
Interface issues a Trans_Ack interrupt
9
Kernel exits the driver routines
10
Kernel returns to user program
Figure 4: Control and Data Flow of FC Write Service u_short u_char u_short u_short } fio;
src_dest; class; paylength; *payload;
where src dest is used to designate the source (for reads) or the destination (for writes), class is used to specify the type of service to use, and paylength and payload are used for the length of the data and data itself. After the device driver receives the above structure, it will invoke the appropriate driver commands to activate the interface board. The write process involves the host operating system, the FC device driver, the IO3 adapter, and the CIM 250 interface. Figure 4 shows the control and data ow for FC writes. There are 10 events listed in time order. First, the user program calls write() or ioctl(), the corresponding driver routines are looked up in the Character Device Switch Table (CDST). The CDST is a kernel to device driver interface which provides a one-to-one correspondence between system calls and driver routines. The driver routine initializes its private data structure and handshakes with the rmware on the interface board. The subsequent operations are di�erent for the three classes of service. For Class 1 writes, the device driver prepares a scatter-gather list of address and size tuples. It pushes the address of the list and the number of list elements (tuples) onto the Command FIFO. The interface becomes the VME master and uses DMA to read the list. The interface uses the information in the scatter-gather list to transmit the user data from host 8
SGI 4D/340
B
A Operating System
User
Ancor VME CIM 250 4 Device Driver
8
7
1 Firmware
6
3
Fibre Channel Switch Clouds 5 IO Adaptor
Memory
2 DRAM 8 Mbytes
Control and Data Timing Sequences: A
User issues read system call (or ioctl) for Class 1 (2 and 3)
B
Kernel calls driver routines via Character Device Switching Table *
1
Remote N_Port logins local N_Port
2
Interface physically receives data through FC
3
Interface issues a transmission complete acknowledgement
4
Driver communicates with Interface firmware
5
Interface (Driver) moves data using DMA for Class 1 (PIO for Class 2/3)
6
Interface issues a Read_Ack interrupt (Class 1 only)
7
Kernel exits the driver routines
8
Kernel returns to user program *Driver may wait for the presence of user message
Figure 5: Control and Data Flow of FC Read Service memory to interface memory. In contrast, for Class 2 and 3 write services, the driver is the VME master and pushes the user data directly onto the Command FIFO (i.e., uses PIO). For using either DMA or PIO to move data via the VME bus, the user message is moved directly from user memory space to the interface. We de ne the Write Latency as the time spent from Step 1 to Step 10. The FC read service involves the same components as the write service. Figure 5 shows the control and data ow diagram of receiving process. There are two possible scenarios when reading user data from the interface. One scenario is that user calls the read() command for Class 1 read service or ioctl() command for Class 2/3 service before a message arrives at the interface. In this case the user process sleeps waiting for message to arrive3 . When a message reaches the receiving interface, a VME interrupt is generated by the interface to wakeup the sleeping driver. Another scenario is that the message arrives before the driver sleeps. In this case, when the driver services the interrupt from the interface, it stores the information needed to retrieve the message at a later time and the message remains in memory on the interface board. We de ne the Read Latency as the time spent from Step 1 to Step 8. The read latency excludes the time spent on Step A and Step B because they may include an uncertain delay waiting for the arrival of expected user messages. It would be trivial to have a non-blocking read by implementing the select() system call in the driver. However this has not been done yet. 3
9
2.3 CIM 250 Interface Commands and Fibre Channel Device Driver Ancor's Fibre Channel interface board provides a set of interface commands which are used by the host device driver to communicate with the interface board. We brie y describe the interface commands in the following sections.
2.3.1 Class 1 Transfer commands Class 1 data transfers consist of three steps for both sending and receiving. For sending, the rst step is to initialize a Class 1 message transmit by issuing the Class 1 Write command to the interface board. After accepting the Class 1 Write command the interface board returns a Write Ack. In the second step, the interface board expects to receive an Address transfer command which will start a DMA transfer from the host memory to the interface board. In the last step, the interface board issues a Trans Ack command to notify the device driver that the Class 1 transfer has completed or an error has occurred. On the receiving side, a Class 1 Read command is issued by the interface board after it receives all the Class 1 data through the Fibre Channel link. The device driver then responds with a Read Ack command. Then the device driver prepares an Address Transfer command for the interface board to start a DMA transfer. In the last step, the interface board will use the Read End command to notify the device driver that the entire Class 1 message has been transmitted from the interface board to host memory. Address Transfer commands are used by the device driver to manage DMA operations. When a Class 1 message is ready to be transmitted, the device driver prepares a list of bu�ers which are used by the interface board during the DMA transfers. There are two types of address transfer commands. The rst is an Address command which is written to the Command FIFO. An Address command contains a bu�er address and bu�er length which the interface uses for its DMA transfer. The second is the Address List (Addr List) command. The Addr List command provides the address of a list of address commands (i.e., scatter/gather list) and the size of the list. The interface then uses DMA to read the list. The interface board expects to obtain Address and/or Addr List commands until it receives an Address Message End (Addr Msg End) command, which represents the last Address Transfer command. The interface board then transmits the user data.
2.3.2 Class 2 and 3 Transfer commands Class 2 and 3 Transfer commands are used to transmit small messages between the host and the interface board. There are no DMA operations in Class 2 or 3. The Command FIFO and Response FIFO are used to exchange data between the host and the interface board. Both Class 2 and 3 are connectionless services. Class 2 service guarantees noti cation of delivery or failure to deliver, while Class 3 service only supports unacknowledged delivery of data. Thus after a Class 3 write, the interface board returns a Trans Ack immediately. For Class 10
2 writes the Trans Ack is sent after the data has been received by another node.
2.3.3 Fibre Channel Device Drivers We consider four di�erent Fibre Channel device drivers in this paper. The rst is a general purpose device driver (referred to as the original device driver), which follows the procedure mentioned above to communicate with the interface board. It does not use any special hardware support from the host system architecture. We analyze its behavior and performance in Section 3. The second device driver uses hardware DMA mapping registers which are provided by the IO3 adapter. The DMA mapping hardware allows the device driver to present several noncontiguous segments of data to the interface as if it was in physically contiguous memory. This reduces the time caused by transmitting data across segment boundaries. We present this approach in Section 4. The last two device drivers were designed with an emphasis on reducing the communication latency. The third device driver overlapped the FC physical transmission with the memory management of operating system. The last device driver used a Success-oriented approach, which assumed most of the operations would succeed. Error checking tasks were delayed as long as possible and thus could be handled all at once. This approach reduced the overhead caused by interactions between the interface board and the host system. We explain these two approaches in Section 5.
2.4 Performance Monitoring Tools To understand and analyze the interactions between various components of the network subsystem, both hardware and software tools were utilized. We used a VME 110 analyzer board to observe events that crossed the VME bus and used timing logs to study the system software. These tools gave us a complete picture about how the components interacted and cooperated with each other.
2.4.1 VME 110 analyzer board All communications between the host device driver and the network interface go across the VME bus. The VME 110 analyzer board is a useful tool for the development, diagnosis and support of VME systems. Its functions include the capture and storage of VME bus events. The storage of this information can be controlled using sophisticated trigger and trace conditions that can be programmed into the VME bus analyzer. This provides a means of understanding complicated VME bus interactions simply and accurately. We used the VME analyzer to observe the control ow and data ow between the host system and the interface board. The control ow includes driver commands sent from the host device driver to the interface, responses returned from the interface, and interrupts sent by the interface. The data ow re ects the DMA transfer operations. 11
2.4.2 Timing log within the device driver and IO timer To collect detailed timing information on the software side, we put timing logs at critical points in the FC device driver (such as the entry points of driver routines and interrupt service routines.) The timing log is a small segment of code placed in the device driver to record timing information during the execution of various routines. The timing information was stored in the following data structure: struct logging { char event_type; u_long timestamp; short process_id; };
where event type is used for storing a code to represent various events, timestamp is for recording the time read from IO3 clock, and process id holds the process id. The IO3 adapter from SGI has a very accurate 16 MHz clock with a 62.5 nanosecond resolution. All of our timing experiments used this clock. We put the following timing log at critical points in the device driver. A timing log pro le was collected and stored in a preallocated kernel bu�er. On average, the overhead of the timing logs ranged from 2.5 to 4 microseconds. if(timer) { ipl = splvme(); local = &(log[logptr]); logptr = (logptr + 1) & MOD_LOGSIZE; event++; splx(ipl); local->timestamp = *iotimer_addr; local->event_type = EVENT_SYMBOL; local->process_id = u.u_procp->p_pid; }
An ioclt() function was implemented to copy the timing log pro le from the kernel bu�er to a user bu�er. Then the collected pro le was analyzed.
3 Performance Analysis of Fibre Channel LANs The communication characteristics of three classes of the FC standard are examined in this section. We concentrate on communication latency for short messages and the achievable userlevel bandwidth for large messages. To evaluate communication latency and bandwidth, two simple test programs were designed. The statistical analysis of the collected timing data and the test environment are brie y described in Section 3.1. Using the test programs, the general 12
purpose device driver was studied rst. We derived simple timing equations to approximate the measured results. Timing equations are also used to analyze performance bottlenecks in the network subsystem. The FC network provides three di�erent classes of service (as described in Section 2.1). Class 1 service provides reliable communication by utilizing circuit-switching technology. In our test environment, the maximum user message size is 3 Mbytes4 for each read/write system call. We present the results of our timing analysis for Class 1 service in Sections 3.2 (write) and 3.3 (read). The detailed interactions between the operating system, the network interface, and the device driver for Class 1 writes are also described in Section 3.2. In contrast, the maximum message size which can be transmitted for each Class 2 or 3 read/write operation is 128 bytes. So in section 3.4 we only present the communication latency for Class 2 and 3 services.
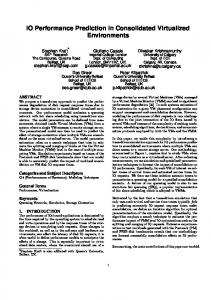
3.1 Experimental Design Users transmit and receive messages using the traditional low-level Unix le system programming interface. As discussed in Section 2.2, users call write() to transmit messages and read() to receive messages after the designated device le is opened. As discussed in Section 2.2.4, the Write Latency is measured starting from the call to write() (for Class 1) or ioctl() (for Class 2 and 3) and ending with the return from the system kernel. The application level bandwidth for a write is calculated by dividing the message size by the write latency. The Read Latency is measured starting from the message arrival to the return from the system call. The time incurred by entering the driver is ignored in the read latency because it contains uncertain delays. The achievable user bandwidth for a read() is calculated by dividing the message size by the read latency. Our system con guration was presented in Section 2.2. The operating system used was IRIX 4.0.5. The FC link provided a 212.8 Mbits/sec data rate. The length of the multi-mode 50 micron ber optic cable was less than 30 feet. The timing information was collected using two simple send and receive programs. To collect the user-level latency, the 16 MHz clock on the IO3 board was examined right before and after the write/read system calls. Several speci c timing logs were placed within the driver to gather timing information about di�erent components of the network subsystem. The read/write times of the VME bus were studied by using the VME 110 bus analyzer. We collected 100 timing samples for each message size. The sample maximum, sample mean, and sample minimum were calculated to represent the communication characteristics. Sample maximum and minimum represent the worst and the best of the collected timings, respectively. Both are sometimes used to characterize communication performance. However, in our experiments, most of the timing samples collected, were very close to the calculated sample mean. For example, Figure 6 shows the distributions of maximum, mean, and minimum for The terms Kbyte and Mbyte refer to 210 and 220 -byte quantities respectively. On the other hand, when these terms are used in the context of a transmission rate and bandwidth, as in Kbytes/sec and Mbytes/sec, they refer to 103 and 106 bytes per second respectively. 4
13
Statistics of 100 Timing Samples 8
Class 1 Write Latency (milli seconds)
Sample Mean Sample Maximum Sample Minimum
6
4
2 4B
4KB
8KB Message Size
12KB
16KB
Figure 6: Statistical results of 100 Class 1 write timing samples for di�erent message sizes Class 1 write service timing samples. We varied the message sizes using 64 bytes increments from 4 bytes up to 16 Kbytes. For each given message size, a 90% con dence interval was computed. We found that the con dence interval of the samples was within a 25 �sec range and very close to the mean. Therefore, only the mean of the timing samples are reported for the remaining experiments.
3.2 Timing Analysis of Class 1 Write Service The CIM 250 interface communicates with the host system using the VME bus. The interface has two dedicated FIFO bu�ers: Cmd FIFO and Response FIFO. Both bu�ers (and all other on board registers) are mapped into the IRIX memory space at startup time. The driver can then access the on board registers with normal memory read/write operations. It is the job of the IO3 board to convert the memory read/write operation to VME read/write operations. When applications invoke a write system call, four major components of the I/O subsystem (host operating system, device driver, I/O adapter, and network interface) are required to cooperate with each other to complete the write operation. In Figure 7, a detailed description of the interactions of the di�erent components, and the control ow for writing a message that is less than or equal to 4 Kbytes, is given. For writing message size greater than 4 Kbytes, the part within the dotted square is replaced by Figure 8. Events listed in the left column of both gures are the VME read/write operations issued either by the device driver or the network interface. In the middle column, the actions of the operating system and the device driver are listed together. A dark small circle in front of a command represents a driver action, and a hollow small square represents an operating system action. The actions of the interface are given in the right column. In this simple device driver, a couple of characteristics are interesting. The Class 1 write service requires 6 context switches and 3 interrupt service traps. Context switches and interrupt 14
VME Events User + Write 1
Writer Actions (in Driver) Call write() OS enters kernel mode Call fcwrite() on CDST Push Write to Cmd_FIFO Sleep for Interrupt OS schedules Writer to Wait Queue
Interrupt Write_Ack
Addr_Msg_End 2
OS traps to Interrupt Service Routines Call fcintr() Pop Write_Ack from Response_FIFO Wake up Writer from Wait Queue OS goes back to interrupted process Writer becoms active Check return status Call physio() Call fcstrategy() Initialize Address Push Addr_Msg_End to Cmd_FIFO Sleep for Interrupt OS schedules Writer to Wait Queue
Data Interrupt Addr_Ack
3
OS traps to Interrupt Service Routines Call fcintr() Pop Addr_Ack from Response_FIFO Wake up Writer from Wait Queue OS goes back to interrupted process Writer becoms active Check return status Exit fcstrategy() Sleep for iodone() (in physio())
Interrupt Trans_Ack
4
User + 1 2
OS traps to Interrupt Service Routines Call fcintr() Pop Addr_Ack from Response_FIFO Wake up Writer from Wait Queue OS goes back to interrupted process Writer becoms active Check return status Exit physio() Go back to user space Exit write()
Initialization Phase DMA Phase
3 4
Interface Actions Wait for Command
Pop Write from Cmd_FIFO Initialize board Push Write_Ack to Response_FIFO Issue Interrupt
Pop Addr_Msg_End from Cmd_FIFO Board prepares for DMA A32D32 DMA Push Addr_Ack to Response_FIFO Issue Interrupt Set up FC connection Move Data from board to FC
(Repeat at most 3 times, if error occurs) Break connection Complete transmission Push Trans_Ack to Response_FIFO Issue Interrupt Wait for next command cycle
FC Phase Completion Phase
+ The "User" represents write system call and is not a VME event.
Figure 7: Detailed Interactions between Writer (Driver) and CIM 250 interface for message size smaller than or equal to 4 Kbytes. 15
VME Events
Writer Actions (in Driver)
Interface Actions
... Addr_List Address Addr_Msg_End Data (1st Page) Data (2nd Page)
Call fcstrategy() Initialize Address List Push Addr_List to Cmd_FIFO Sleep for Interrupt OS schedules Writer to Wait Queue
...
Pop Addr_Msg_End from Cmd_FIFO Board prepares for DMA on Addr list A32D32 DMA (Address & Size) A32D32 DMA (Last Address) A32D32 DMA (First Page of Data)
... ...
A32D32 DMA (2nd Page of Data)
Data (Last Page)
A32D32 DMA (Last Page of Data) Push Addr_Ack to Response_FIFO Issue Interrupt
Interrupt
... Figure 8: Part of interactions between Device Driver and CIM 250 interface for message size greater than 4 Kbytes. traps are time consuming processes. We will discuss some possible solutions to x this problem in Section 5. An advantageous characteristic of the device driver is the absence of data copying in system kernel space. The data is moved directly from the user bu�er to the network interface. This is in contrast to some protocols such as TCP/IP. The complicated interactions of a Class 1 write makes the timing analysis di�cult. A straightforward approach is to divide the write operation into multiple timing pieces. However, there are many possible ways to partition the write operation. We chose to divide the write operation into several timing phases which represent special tasks being performed during the write operation. For example, there are two major tasks which need to be performed in order to transmit data to destination. One is the DMA operation across the VME bus. Another is the data transmission across the FC communication link. The timing phase before the DMA operation involves the system call interface. The phase after transmission across the FC link is the time spent checking the status and exiting device driver. One advantage of our Task-oriented partition is that it is easy to derive simple equations to approximate the experimental results. Since these four phases are executed sequentially, the write latency is equal to the sum of the time spent in each phase. The four phases can be described as follows:
� Initialization phase: When a user issues a write system call, the operating system enters
kernel space and invokes the corresponding driver routine. The driver then puts a Write command in the Cmd FIFO and sleeps waiting for a VME interrupt. When the driver gets the Write Ack interrupt from interface, it wakes up and checks the return status. 16
This phase represents the time incurred by the API, le subsystem, and acquisition of the network interface. � DMA phase: The driver uses a kernel routine to lock down the memory pages of the user bu�er in physical memory. This is done to avoid page swapping during a DMA operation. Then the driver prepares a scatter-gather list. For message sizes smaller than or equal to the memory page size (4 Kbytes) an Addr Msg End command is capable of passing the DMA information needed to the interface (segment address and segment size see Figure 7). For message sizes greater than 4 Kbytes, an Addr List command is used. It is also possible to use a sequence of Address commands, but the original device driver was implemented using an Addr List command. In Figure 8, the usage of an Addr List command and an Addr Msg End command are presented. The Addr List command contains the starting address of a scatter/gather list and the number of elements in the list. After the driver pushes the Addr List command on to the Cmd FIFO, the interface becomes the VME master and reads the list. After issuing an Addr Msg End command, the driver sleeps waiting for an Addr Ack interrupt. The interface then starts the DMA transfer and reads the user bu�er. After the DMA transfer completes, the interface writes an Addr Ack command into the Response FIFO and issues a VME bus interrupt. The DMA phase includes the time involved in locking the physical memory pages, preparing the scatter-gather list, and data movement cross the VME bus. � FC transmission phase: During this phase, the interface physically moves data to the remote machine via the FC link. When a packet arrives at the N Port of the remote machine, the interface of the remote machine stores the message and sends an acknowledgment back to the sender. Then the interface pushes a Trans Ack on to Response FIFO and issues a VME interrupt. The FC transmission phase (FC phase) reveals the Fibre Channel raw bandwidth. � Completion phase: When the operating system of the host machine gets a Trans Ack interrupt, it wakes up the driver and unlocks the memory pages which were locked prior to the DMA transfer. The driver checks the return status and returns to the user process.
3.2.1 Timing Collection In Table 1, we summarize the VME actions and their corresponding timings. This table contains the associated VME events, timing statistics, number of VME cycles, VME operation mode, and direction of data movement. The events and timing information were collected using the VME analyzer and timing logs described in Section 2.4. In Figure 9 the communication characteristics, based on the four phases of Class 1 write service, are presented. Figure 9(a) shows the write latency for message sizes ranging from 4 bytes up to 16 Kbytes. In Figure 9(b), the achievable user-level bandwidths are shown along with transmission rates of the DMA and FC phases. The transmission rate of the DMA phase represents the bandwidth of moving data from host memory to the interface via the VME bus. 17
Table 1: A VME Timing sequence collected for 4 bytes write service (unit: �sec)
VME Events Interval Duration Summation VME Cycles VME Mode From To USER 0.00 | 0.00 | | | Write 96.35 9.40 105.75 5 A16D16 Driver Board Interrupt 110.65 | 216.40 1 | Board Driver 108.65 11.20 336.25 3 A16D16 Board Driver Write Ack Addr Msg End 426.45 9.95 772.65 6 A16D16 Driver Board Data 161.35 | 934.00 1 A32D32 Memory Board Interrupt 91.25 | 1025.25 1 | Board Driver Addr Ack 48.25 7.80 1081.30 3 A16D16 Board Driver Interrupt 1439.65 | 2520.95 1 | Board Driver 42.45 6.75 2570.15 2 A16D16 Board Driver Trans Ack USER 299.15 | 2869.30 | | |
4 Timing Components of Class 1 Write Service
User-level bandwidth and Data Transmission Rates of FC and DMA phases 25
User Level DMA FC Initialization Completion 6
Bandwidth or Data Transmission Rate (MBytes/sec)
Class 1 Write Latency (milli seconds)
8
User-level
4 DMA
2
FC
1
Initialization
Completion
FC DMA User-level
20
15
FC
10
DMA
5
User-level 0 4B
4KB
8KB Message Size
12KB
16KB
0 256B
1KB
4KB
16KB 64KB Message Size
256KB
1MB
3MB
Figure 9: Timing analysis of Class 1 write (a) write latency (b) achievable bandwidth for di�erent message sizes (a)
(b)
18
The transmission rate of the FC phase is the network bandwidth which the Fibre Channel provides. Several interesting observations are listed below:
� For writes with a message size larger than 4 Kbytes, the time of the DMA transfer dom-
� � � � �
inates the write performance. For example with a 16 Kbyte write, the DMA transfer accounts for 61% of the overall write latency. The percentage of time incurred by the DMA phase increases as the message size increases. For a 3 Mbyte message, the DMA operation accounts for 85% of the write latency. The DMA operation is a bandwidth bottleneck. We will present one possible approach to relieve this bottleneck in Section 4. The FC timing is the major bottleneck for message sizes less than 4 Kbytes. With a message of 4 bytes, the FC transmission accounts for 51% of the write latency. The FC timing has an obvious time jump at 2 Kbyte intervals. This is because the size of one FC frame is equal to 2 Kbytes (see Figure 9) The average time for one FC frame is 79.75 �sec. The overhead of the Initialization and Completion phases are negligible when compared to the DMA and FC contributions to the overall latency. The maximum achievable bandwidth for user-level, DMA and FC phases are 3.61, 4.24, and 25.4 MBytes/sec, respectively. The network utilization rate of the FC network is 95.5% (25.4 � 8 / 212.8 Mbits/sec) when transmitting 3 Mbytes of data.
3.2.2 Timing Analysis After collecting timing data, we derived simple equations to describe each phase. For each phase, there is a need to identify the time incurred by the subcomponents. For example, we observed the time for moving data from main memory to the interface could be characterized by the following three factors: Word Latency (Tw 4 ), Block Boundary Latency (Tw 256), and Page Boundary Latency (Tw 4096). User messages are stored in memory pages, and each memory page has 4096 bytes. Tw 4096 represents the time incurred between the transmission of two consecutive memory pages (4096 byte page boundary) except for transmitting the last memory page. The time for the last page of data is presented later. Tw 256 is the time spent between the transmission of two consecutive memory blocks (VME block boundary.) Tw 4 represents the overhead of moving one word from main memory to the network interface using an A32D32 VME transfer. The times observed using the VME analyzer for Tw 4 , Tw 256, and Tw 4096 are 0.2515 �sec, 1.76 �sec, and 636 �sec, respectively. To further study the timing details of each component, we derived a simple timing equation for each phase. The equation contains one parameter, N which represents the user message size. Within the equations, all units of time are measured in microseconds (�sec.) 19
� Initialization phase (Tinit 1w ) includes the time incurred by entering the Unix le system and initializing the interface.
Tinit 1w = 540 + N � 0:000065 540 �sec represents the constant latency which does not depend on the size of the message. The second operand depends on the message size. This is the e�ect of network interface initialization. � DMA phase (TDMA 1w ) contains delays of physically locking the memory pages of the user bu�er, preparing the address list, and moving data from main memory to the interface. There are two cases for di�erent message sizes. For N � 4Kbytes,
TDMA 1w = 450 + Tdata 1w + Tlast 1w ; where,
N e? 1) � T N N N N Tdata 1w = (d 4096 w 4096 + (b 256 c?b 4096 c) � Tw 256 + (b 4 c?b 256 c? 1) � Tw 4 Tlast 1w = 90 + ((N ? 4) mod 4096) � 0:1184
The Tdata 1w term is the time incurred by moving data across the VME bus. We observed that the page boundary latency (except the last memory page) is 636 �sec. The total N e? 1). Therefore, the total page boundary latency number of page boundaries equals (d 4096 N e ? 1) � Tw 4096. When we applied a similar for transmitting N bytes of data is (d 4096 N c ? b N c) � Tw 256 and calculation to the block boundary and word latency, we got (b 256 N c ? 1) � Tw 4 respectively. The Tlast 1w term is the time4096 (b N4 c ? b 256 incurred between the last word of the DMA operation and the appearance of the Addr Ack interrupt. It depends on the size of the last user page. For example, if the last page size is 4 bytes, Tlast 1w equals 90 �sec. When the last page size is 4 Kbytes, Tlast 1w is around 575 �sec. For N > 4 Kbytes, TDMA 1w = Taddr list + Taddress 1w + Tinit DMA + Tdata 1w + Tlast 1w where,
N e � 15; Taddr list = 605 + d 4096 N e � 3 ? 1) � T ; Taddress 1w = (d 4096 w4 Tinit DMA = 210 + N � 0:008
The Taddr list term is the time for physically locking user pages in memory. The time to N e memory pages for physically lock a user page is around 15 �sec. There are a total of d 4096 an N bytes message. The Taddress 1w term is the DMA transfer time of the scatter-gather N e� 3 ? 1) A32D32 VME transfers. The interface preparation list. There are a total of (d 4096 time for the rst DMA operation is Tinit DMA , and it depends on the user message size. 20
Three Timing Components of Class 1 Read Service
Achievable Throughtputs of Class 1 Read for User-level and Raw DMA
4
User Level DMA Completion Board Misc.
6 Achievable Throughput (MBytes/sec)
Class 1 Read Latency (milli seconds)
5
User-level
3
2
DMA
1 Completion 0 4B
4KB
DMA User level
4
DMA
2
User level
Board Misc.
8KB Message Size
12KB
16KB
0.1 256B
1KB
4KB
16KB 64KB Message Size
256KB
1MB
3MB
Figure 10: Timing analysis of Class 1 read (a) read latency (b) achievable bandwidth (a)
(b)
� FC phase (TFC 1w ) contains the time spent on setting up an FC connection, physically moving data across the network, and breaking down the connection.
N e � 79:75 TFC 1w = 1350 + d 2048 The per frame cost of moving data (2 Kbytes) from the sender to the receiver is around 79.75 �sec. � Completion phase (Tcomp 1w ) contains the time of unlocking physical memory pages, status checking, and returning from kernel space to user space.
N e � 5:9 Tcomp 1w = 295 + d 4096 295 �sec is a constant latency of the Completion phase. The cost to unlock a physical page is 5.9 �sec. The calculated formula is very close to the expermental data (see Figure 14(a)). Mathematical modeling of the performance data allows us to identify possible communication bottlenecks and predict performance gains that should be possible after improvements are applied. For example, in the DMA phase, the page boundary latency is the major communication bottleneck. We will examine one approach to reduce the e�ect of the page boundary latency.
3.3 Timing Analysis of Class 1 Read Service After a comprehensive presentation of the details of a Class 1 write, our discussion of Class 1 reads is simpli ed. There are four timing phases for the Class 1 read service: 21
� Initialization phase: includes the time incurred by entering the Unix le system, initial-
izing the interface, and waiting for a message-arrival interrupt. Since this time depends on the arrival of a remote message (i.e. a blocking read), we chose to ignore itUs contribution to the overall read latency. � DMA phase (TDMA 1r ): contains the time of physically locking user pages, preparing the scatter/gather list, and moving data from the interface to main memory. � Board Misc. phase (Tmisc 1r ): is the time between the Addr Ack and the Read End interrupt. � Completion phase (Tcomp 1r ): contains the time of unlocking physical memory pages, status checking, and returning from kernel space to user space.
Figure 10 shows the read latency and achievable bandwidth for Class 1 reads. The time to read a 4 byte message is 1032 �sec. The DMA operation requires 584 �sec, (57 % of the overall latency.) For receiving a 3 Mbytes message, the percentage of timing for the DMA operation is 99.1 %. The Board Misc. phase has a constant latency of 165 �sec. The Completion phase of read is same as the Tcomp 1w . The DMA transfer time of the read operation is a�ected by three major factors: word latency (Tr 4 ), block boundary latency (Tr 256), and page boundary latency (Tr 4096.) The page latency (148 �sec) for moving data from the interface to main memory is much smaller than the one (636 �sec) for moving data from main memory to the interface. The block and word latency for read operations are 0.95 and 0.4715 �sec, respectively. The word latency for a read is almost twice the latency of a write (0.2515 �sec). The following equations describe the characteristics of the three phases. N is the user message size.
Ttotal 1r = TDMA 1r + Tmisc 1r (= 165) + Tcomp 1r (= Tcomp 1w ); where,
TDMA 1r = Taddr list + Taddress 1r + Tinit DMA + Tdata 1r + Tlast 1r (= 90); = (d N e � 3 ? 1) � T ; T address 1r
4096
r4
N e ? 1) � T N N N N Tdata 1r = (d 4096 r 4096 + (b 256 c ? b 4096 c) � Tr 256 + (b 4 c ? b 256 c ? 1) � Tr 4 :
3.4 Timing Analysis of Class 2 and 3 Services For Class 2 and 3 services, the maximum transmission size is 128 bytes. Instead of using DMA for moving data, Class 2 and 3 services use PIO to move data across the VME bus. PIO reduces 22
Four Timing Components of Class 2 Write Service
Two Timing Components of Class 2 Read Service
3.0
User Level PIO Completion
User Level FC PIO Completion Initialization
Class 2 Read Latency (microseconds)
Class 2 Write Latency (milli seconds)
2.5
250
2.0 User-level 1.5 FC 1.0
0.5 Completion
2B
32B
64B Message Size
PIO
200
150 User-level
100 PIO
50 Completion
Initialization
96B
128B
0 2B
32B
64B Message Size
96B
128B
Figure 11: Timing analysis of Class 2 (a) write service and (b) read service (a)
(b)
the latency of transmitting small messages across the VME bus. This is because the DMA transfer preparation time and page boundary latency are eliminated. For example, transmitting a 128 byte message using DMA takes 566 �sec, but for PIO it only takes 145 �sec. Class 2 write latency can be partitioned into four timing phases, Initialization, PIO, FC, and Completion phases. The timings for the Initialization, PIO, and Completion phases are nominal when compared to the one of the FC phase. Figure 11(a) shows the Class 2 write latency with message sizes ranging from 2 bytes to 128 bytes in increments of 2 bytes. The time to write 4, 64, and 128 bytes of message are 1183, 1610, and 2055 �sec, respectively. Since the Class 2 write service requires an acknowledgment from the remote receiver after physically transmitting the message, the FC time is much larger than any other factor. The FC percentages of the total latency for transmitting 4, 64, and 128 bytes are 71 %, 75 %, and 78 %, respectively. Figure 11(b) presents the read latency for Class 2 read service. It is divided into three components, Initialization, PIO, and Completion phase. Similar to Class 1 read service, we exclude the time spent in the Initialization phase which contains an uncertain waiting time. The PIO phase is the major timing components for Class 2 reads. The Class 3 write service is an unreliable, connectionless service. It does not wait for an acknowledgment from the remote N Port. The timings of Class 3 writes are presented in Figure 12. The Class 3 write service is partitioned into four components (as with the Class 2 write service.) The time to write 4, 64, and 128 byte messages are 647, 987, and 1315 �sec, respectively. The Class 3 read service has the same timing as a Class 2 read service, since both use the same interface commands and system call. Table 2(a), is a summary of the timing partitions for the three classes of service. In Table 2(b), the timings for three message sizes 4, 64, and 128 bytes are compared. All the timing information is reported in �sec. Several interesting observations are listed below: 23
Four Timing Components of Class 3 Write
Class 3 Write Latency (milli seconds)
1.5 User Level FC Completion PIO Initialization User-level
1.0
FC 0.5
Completion PIO
2B
32B
64B Message Size
Initialization
96B
128B
Figure 12: Timing analysis of Class 3 write Table 2: Partitioning components for 3 classes of service Classi cation Number Phase 1 Class 1 4 Initialization Write Class 2 4 Initialization Class 3 4 Initialization Class 1 4 Initialization Read Class 2 3 Initialization Class 3 3 Initialization
Phase 2
Phase 3 FC FC FC Misc. null null
Completion Completion Completion Completion Completion Completion
Phase 2
Phase 3
Phase 4
DMA PIO PIO DMA PIO PIO
Phase 4
(a)
Classi cation R/W Class Write Class 1 4 bytes Class 2 Class 3 Write Class 1 64 bytes Class 2 Class 3 Write Class 1 128 bytes Class 2 Class 3 Read Class 1 4 bytes Class 2 Class 3 Read Class 1 64 bytes Class 2 Class 3 Read Class 1 128 bytes Class 2 Class 3
Total
Phase 1
�sec % 529.9 (18.7%) 64.3 (5.4%) 60.5 (9.3%) 540.6 (19.1%) 60.7 (5.6%) 62.2 (6.4%) 536.8 (18.9%) 63.3 (3.1%) 63.4 (4.8%)
�sec % 2836.7 553.5 (19.5%) 1183.9 28.7 (3.3%) 648.5 27.8 (4.5%) 2833.6 551.1 (19.4%) 1610.4 90.3 (3.8%) 986.6 94.5 (9.6%) 2843.8 566.7 (19.9%) 2056.0 145.8 (7.1%) 1314.8 145.5 (11.0%) 1032.2 y 584.2 (56.6%) 55.8 y 30.4 (54.5%) 53.8 y 29.7 (55.2%) 1034.7 y 586.5 (56.7%) 129.5 y 104.5 (80.7%) 122.6 y 97.9 (85.3%) 1045.3 y 593.8 (56.7%) 202.0 y 177.8 (88.0%) 201.3 y 176.4 (87.6%) y This timing component is excluded in our experiments. (b)
24
�sec % 1453.4 (51.2%) 841.7 (71.1%) 320.8 (49.4%) 1445.7 (51.0%) 1214.6 (75.4%) 587.7 (59.5%) 1448.3 (50.9%) 1603.8 (78.0%) 867.4 (66.0%) 145.9 (14.1%) null null 151.4 (14.6%) null null 151.0 (14.6%) null null
�sec % 299.9 (10.6%) 239.6 (20.2%) 238.2 (36.8%) 296.3 (10.5%) 244.9 (15.2%) 242.1 (24.5%) 292.0 (10.3%) 243.0 (11.8%) 238.5 (18.2%) 302.0 (29.3%) 20.5 (46.5%) 19.4 (44.8%) 296.8 (28.7%) 20.3 (19.3%) 19.9 (14.7%) 300.5 (28.7%) 19.6 (12.0%) 20.2 (12.4%)
� For writes with message size less than 128 bytes, the FC phase dominates the overall � � � � �
latency. When writing 4 (128) byte messages, the FC time of Class 1, 2, and 3 services are 1453, 841, and 320 �sec (1448, 1603, and 867 �sec), respectively. The FC time of a 128 byte Class 2 write is larger than the over head of a 128 byte Class 1 write. The time of the DMA phase of the Class 1 service is signi cantly greater then Class 2/3 PIO time. The timing di�erences of DMA and PIO for message sizes of 4, 64, and 128 bytes are around 525, 440, and 420 �sec, respectively. The time for the Initialization phase of a Class 1 write is also signi cantly greater than the Initialization phases for Class 2 and 3. The time of the Initialization phases for Class 1, 2, and 3 writes are around 530, 60, and 60 �sec, respectively. This is because the Class 1 write requires one additional interaction with the interface. For a Class 1 read, the DMA phase is the major contributor to the overall communication time (56%.) When comparing Class 2 and Class 3 writes, we nd the timing di�erences for transmitting 4, 64, and 128 byte of messages are 536, 624, and 742 �sec, respectively. This timing di�erence shows the time caused by waiting for an acknowledgment back from receiving side. The Class 3 write service provides the fastest transmission time since it does not need to set up a connection and wait for an acknowledgment.
4 Approaches to Improve Communication Bandwidth In Section 3, we analyzed the three classes of service with a general purpose device driver and characterized them using simple timing equations. In this section, we discuss several possible approaches to improve the application level bandwidth. First, we describe special DMA mapping hardware and then compare the bandwidth improvements for di�erent DMA segment sizes. The DMA segment size is the size of the data that can be moved in one DMA operation. Each DMA operation performed by the network interface uses multiple DMA block transfers. Next we discuss some possible improvements to the network subsystem. Since the maximum message size for class 2 or 3 is 128 bytes, we focused our study on Class 1 service.
4.1 DMA Mapping Hardware Support In Section 3, the maximum application level bandwidth using the general purpose device driver is around 3.6 MBytes/sec. From Figures 9 and 10, we observed that the application level bandwidth is dominated by the DMA phase. The theoretical bandwidth of the VME bus is 40 MBytes/sec [16], however that bandwidth has never been accomplished. A reasonable bandwidth for a VME bus is around 25 MBytes/sec [16]. 25
FC Adapter
IO3
DMA Table
DMA Mapping Registers
16 K
Physical Memory
4K 4K 4K 4K
VME Bus
System Bus
Figure 13: DMA mapping scheme of IO3 adapter In Section 3.2, we observed the latency for writing one word (4 bytes) from main memory to the interface (Tw 4 ) is 0.2515 �sec, if the word is not at either page (4096) or block (256) boundary. The block boundary (Tw 256) and page boundary latencies (Tw 4096) are 1.76 and 636 �sec, respectively. If we use these parameters to calculate the achievable bandwidth, 4=Tw 4 is equal to 15.9 MBytes/sec. That is, without counting the latency caused by the block and page boundary, the maximum achievable bandwidth using DMA operation across the VME bus is 15.9 MBytes/sec. Considering the block boundary latency, we can get 256=(63 � Tw 256 + Tw 256) = 14:54 MBytes/sec. When moving one page of data from main memory to the interface using DMA, the bandwidth is equal to 4096=(1007 � Tw 256 +15 � Tw 256 + Tw 4096) = 4:47 MBytes/sec. That is, the maximum bandwidth which can be achieved in this environment is restricted to 4.47 MBytes/sec. Page boundaries are responsible for 70% of the total latency. When considering the VME read operation which moves data from the interface to main memory, the word timing (Tr 4 ), block boundary timing (Tr 256), and page boundary timing (Tr 4096) are 0.4715, 0.95, and 148 �sec, respectively. Using a calculation similar to the one used for the VME write operation, the bandwidth for transmitting 4 bytes, 256 bytes, and 4096 bytes packets from the interface to main memory are 8.48, 8.35, and 6.43 MBytes/sec, respectively. The observed maximum bandwidth for read operation is 5.89 MBytes/sec, and the page boundaries are responsible for 24% of the total latency. The page boundary latency is the largest bottleneck in the DMA operation. One approach to improving communication bandwidth is to increase the memory page size of the host system. However, the memory page size is xed within the kernel and would be impossible to change. Another approach is to allocate the DMA bu�er in physically contiguous memory, however this is not possible without copying the bu�er in the kernel. The overhead of the copy makes this alternative undesirable. Fortunately, SGI's IO3 adapter provides DMA mapping hardware which translates physical addresses to/from \bus virtual addresses" by using DMA mapping registers. Bus virtual addresses are a special range of addresses. When the operating system transfers to/from one of these addresses, it knows that it is using registers on the IO3 board. Each DMA mapping register can map one page of memory (4 Kbytes). We can use this facility to prepare a larger DMA segment for the network interface. For example, to prepare a 16 Kbyte DMA segment, four DMA mapping registers are used to translate contiguous bus virtual addresses to four separate physical memory pages as shown in Figure 13. >From the network interface point of view, these 26
four physical pages are treated as a contiguous 16 Kbyte segment. The FC device driver was modi ed to use this DMA mapping facility. After several simple experiments, we found that the segment boundary latency for 4 Kbyte and 8 Kbyte DMA segment sizes are 636 and 798 �sec, respectively. For DMA segment sizes greater than or equal to 16 Kbytes, the segment boundary latency is 1154 �sec. Therefore, the overhead of the DMA phase can be reduced by increasing the DMA segment size. For example, when moving a 16 Kbyte user message with 4 Kbyte DMA segments, there are four segment boundary. The latency equals 636 � 4 = 2544�sec. But with 16 Kbyte DMA segment size, the boundary overhead is 1154 �sec, it is an improvement of 1390�sec. In the next experiment, we measured the application level bandwidth for six di�erent DMA segment sizes ranging from 4 Kbytes to 1 Mbyte. The timing equations derived in Section 3.2 are also adjusted to accommodate the changes to the segment boundary latency and segment size. The timing equations were applied to predict the expected bandwidth which we then compared to the measured bandwidth. In Figure 14, we present the results. For the di�erent DMA segment sizes, we calculated the \expected bandwidth" using the modi ed timing equations. The \original bandwidth" represents the performance of the network subsystem with the original device driver. The measured maximum bandwidth for six DMA segment sizes are 4.52, 5.14, 5.56, 5.81, and 6.06 MBytes/sec. For the 1 Mbyte DMA segment size, this resulted in a 75% application level bandwidth improvement. As shown in the gure, there is a bandwidth di�erence between the measured and expected bandwidth for DMA segment sizes greater than 8 Kbytes. The di�erence becomes more apparent for larger DMA segment sizes. For 1 Mbyte DMA segment size, there is a 2.81 MBytes/sec di�erence between measured and expected bandwidth. Using data from the VME bus analyzer, we determined the cause of the disparity between the measured and expected application level bandwidth. The segment boundary overhead was not constant. >From the timing information collected by the VME analyzer (as shown in Figure 15), the per block overheads before the 13568 byte (0x80803500) o�set are the same as we expected. But starting from the 13568 byte o�set, the per block overheads increases from around 17.5 �sec to around 30 �sec. We found that there are 8 to 9 VME block transfer operations per 256 bytes after the 13568 byte o�set instead of only one VME block transfer operation. This means the network interface is not able to use the maximum VME block transfer size (256 bytes). We believe that this timing abnormality is caused by the network interface, and we are working with Ancor to x this problem.
4.2 Discussion of Communication Bandwidth One interesting property of the general purpose device driver and the driver that uses the DMA mapping facility is that the four timing phases of the Class 1 write occur sequentially. By carefully overlapping the DMA and FC phases, a bandwidth improvement might be possible. If the DMA segment boundary problem mentioned above can be solved, then the application level bandwidth should improve up to 14.54 MBytes/sec. This is derived from the per block latency (256=(63 � Tw 256 + Tw 256)). However, this is still far less than the network bandwidth of Fibre Channel. One possible solution is to use higher bandwidth bus architectures such as VME-64 or 27
Expected and Real Achievable Throughtputs uisng 4 Kbyte DMA Segment
Expected and Real Achievable Throughtputs uisng 8 Kbyte DMA Segment
10
10
8
Achievable Throughput (MBytes/sec)
Achievable Throughput (MBytes/sec)
Expected Real
6
4
2
0 256B
1KB
4KB
16KB 64KB Message Size
256KB
1MB
2
1KB
4KB
3MB
10 Expected Real Original
1KB
4KB
16KB 64KB Message Size
256KB
1MB
8
6
4
2
0 256B
3MB
Expected Real Original
1KB
4KB
(c)
16KB 64KB Message Size
256KB
1MB
3MB
(d)
Expected and Real Achievable Throughtputs uisng 64 Kbyte DMA Segment
Expected and Real Achievable Throughtputs uisng 1 Mbyte DMA Segment
10
10 Expected Real Original Achievable Throughput (MBytes/sec)
Achievable Throughput (MBytes/sec)
1MB
(b)
2
6
4
2
0 256B
256KB
Expected and Real Achievable Throughtputs uisng 32 Kbyte DMA Segment
4
8
16KB 64KB Message Size
(a)
Achievable Throughput (MBytes/sec)
Achievable Throughput (MBytes/sec)
4
Expected and Real Achievable Throughtputs uisng 16 Kbyte DMA Segment
6
0 256B
6
0 256B
3MB
10
8
8
Expected Real Original
1KB
4KB
16KB 64KB Message Size
256KB
1MB
8
6
4
2
0 256B
3MB
(e)
Expected Real Original
1KB
4KB
16KB 64KB Message Size
256KB
1MB
3MB
(f)
Figure 14: Comparison of expected and user achievable bandwidth when varying DMA segment size from (a) 4 Kbytes, (b) 8 Kbytes, (c) 16 Kbytes, (d) 32 Kbytes, (e) 64 Kbytes, and (f) 1 Mbytes
28
x x TRIGx 1x 2x 3x
TIME rel. 0.00 17.6 17.5 17.5
us us us us
51x 52x 53x 60x 69x 77x 86x
17.4 17.5 17.5 29.0 31.2 29.9 31.2
us us us us us us us
BUS ADDRESS LEVEL - 80800000 - 80800100 - 80800200 - 80800300 -
80803300 80803400 80803500 80803600 80803700 80803800 80803900
DATA FFFFFFFE FFFFFFFE FFFFFFFE FFFFFFFE ::: FFFFFFFE FFFFFFFE FFFFFFFE FFFFFFFE FFFFFFFE FFFFFFFE FFFFFFFE
R/W SIZE STAT R R R R
LONG LONG LONG LONG
OK OK OK OK
IRQ* 7654321 -------------------------
R R R R R R R
LONG LONG LONG LONG LONG LONG LONG
OK OK OK OK OK OK OK
-------------------------------------------
IACK* OC IO 1 1 1 1 1 1 1 1 1 1 1 1 1 1 1
1 1 1 1 1 1 1
AM EX 0B 0B 0B 0B
1 1 1 1
0B 0B 0B 0B 0B 0B 0B
1 1 1 1 1 1 1
Figure 15: Partial results collected from analyzer for 64 Kbyte DMA segment size Digital Equipment Corporation's Turbochannel. The theoretical bandwidth provided by VME64 is 80 MBytes/sec [16]. Another possible solution is to put two or more interface cards in one I/O bus and stripe across them. This has been shown to greatly improve the performance of disk I/O subsystems [18] Since most system buses provides much higher bandwidth than standard I/O buses, the I/O buses become the communication bottleneck in high-speed network environments. Another approach to improving the communication bandwidth is to connect the network interfaces directly to the system bus. This would, however, increase the cost and complicated design of the host architecture and network interface. This would also require a close collaboration between the computer vendor and the network interface vendor, which is not always possible. With the rapid progress of ber optic technology, it is very likely that the bandwidth of optical networks may exceed several gigabits/sec. Improvements to standard I/O buses may not match the speed of optical ber networks. One thought is to have multiple I/O buses sharing a network media. This situation is very similar to having a local switch on each host. Each I/O bus is controlled by one I/O adapter. Multiple DMA operations could be performed in parallel. A special control mechanism is required to coordinate the operations of multiple I/O buses. Further study is required to understand the design issues of multiple I/O buses sharing a network media.
5 Improving Communication Latency The communication latency is critical for distributed applications such as distributed network computing and real-time multimedia applications. In this section, we rst examined two possible approaches for reducing the Class 1 write communication latency. As de ned in Section 3.1, the Class 1 write latency is measured starting from the call to write() and ending with the return from the system kernel. During the write() process, four phases were performed sequentially. The basic idea for reducing the communication latency is to overlap some of the phases. This 29
will reduce the time that the interface and the driver spend interacting with each other. Then, we further discuss other possible approaches for reducing the communication latency.
5.1 Overlapping The FC and Completion Phases After the completion of the DMA phase, the device driver needs to unlock the physical memory pages. The general purpose device driver used in Section 3 unlocks the physical pages after the FC phase. However, these physical pages can be released right after the DMA phase instead of after the FC phase. The advantage of this approach is that it overlaps the FC phase and the Completion phase. The device driver can unlock the physical pages at the same time the network interface transmits the data across the Fibre Channel link. This approach reduces the overhead of releasing the memory pages. The amount by which the overhead is reduced depends on the number of memory pages which need to be unlocked. After implementing this concept in the device driver, the time spent on the Completion phase for a Class 1 write is a size constant (190 �sec) instead of (295 + d message 4096 e � 5:9.) Table 3: Timing reduction for Class 1 write using overlap of FC and Completion phases Message Size 4 bytes 64 bytes 1 Kbytes 64 Kbytes 1 Mbytes 3 Mbytes Original 2837 2834 3218 21396 296039 881825 Overlapping 2715 2727 3100 21147 294650 877566 Reduction 122 107 118 249 1389 4259 Percentage 4.3% 3.8% 3.7% 1.2% 0.5% 0.5%
Table 3 shows the results of applying this overlapping approach. With a 4 byte Class 1 write, a reduction of 122 �sec was observed. For Class 1 reads, there is no di�erence after applying this approach because there is no FC phase in the read service.
5.2 Delayed Status Checking During the interactions between the device driver and the network interface, it is very likely that the network interface will receive interface commands in correct sequence and the device driver will get responses from the network interface in proper order. The responses from the network interface are the status of operation results or failures. Therefore, the second approach is to delay the status checking as late as possible. As described in Section 3.2, the general purpose device driver sleeps and waits for the responses from the network interface three times. It waits for a Write Ack after issuing the Write command, waits for an Addr Ack after issuing the Address (or Addr List) command, and waits for a Trans Ack issued by the network interface after the FC phase completes. Our approach is to delay the status checkings for the rst two responses until the device driver receives the Trans Ack. This approach overlaps the actions of the device driver and the interface by issuing more driver commands without waiting for the intermediate results from the interface. This success-oriented approach has another advantage. It eliminates four context switches. Since 30
the driver does not sleep waiting for an interrupt after issuing Write and Address (or Addr List) commands. One disadvantage of this approach is that the delayed status checking may increase the user-level response time when there are errors detected by the interface. Table 4: Timing improvement of Class 1 write using delayed status checking Message Size 4 bytes 64 bytes 1 Kbytes 64 Kbytes 1 Mbytes 3 Mbytes Original 2837 2834 3218 21396 296039 881825 Overlapping 2715 2727 3100 21147 294650 877566 Delayed 2385 2390 2777 20823 292607 866883 Reduction 452 444 441 573 3432 14942 Percentage 15.9% 15.7% 13.7% 2.7% 1.2% 1.7%
Table 4 shows the results of implementing the delayed status checking approach. A 4 bytes Class 1 write had a timing reduction of 452 �sec. This overall latency improvement comes from the reduction of the overhead associated with the Initialization and the DMA phases.
5.3 Latency Discussion After applying the previous two approaches, the latency for short messages was still very high, around 2.4 milliseconds. Further latency reduction is still needed for distributed applications such as network computing and real-time systems. Several possible approaches are discussed as follows:
� PIO v.s. DMA: PIO transfers have a shorter latency than DMA transfers if the message
size is small. Consider the case of writing a 4 byte message. The overhead of the DMA phase of a Class 1 write is 553 �sec, but the PIO phase of a Class 2 write is 27 �sec. For short messages, the communication latency of a class 1 write can be reduced if the DMA transfer is replaced with a PIO transfer. PIO transfers have a lower latency until the message size becomes greater than 680 bytes. This result is calculated from the timing data for the DMA phase of Class 1 and the PIO phase of Class 2/3 writes. Therefore, when writing messages less than 680 bytes, PIO transfers are preferred. On the other hand, the DMA transfers are better for message sizes greater than 680 bytes. � Overlapping the FC and DMA phases: Another possibility to improve the communication performance is to overlap the DMA and FC phases. The rst approach (overlapping FC and Completion phase) has reduced the latency of the Completion phase to a constant, 195 �sec. The second approach (delayed status checking) has also reduced the latency of the Initialization phase to a constant, 140 �sec. If the DMA and FC phases could be overlapped, the overall latency should be reduced. For example, if the network interface could transmit/receive data across the Fibre Channel links at the same time it is moving user data between the interface and main memory, a signi cant latency reduction would be achieved. The interface vendor claims that this would be di�cult, if not impossible, to accomplish. 31
� Timed Polling: Interrupt handling has long been blamed for high communication laten-
cies [8]. One possible solution for reducing the latency caused by handling interrupts and context switches, is to disable the interrupts from the interface. The required cooperation between the network interface and device driver could be accomplished by using a timed polling scheme. This approach allows the device driver to issue commands to the interface as fast as possible and to poll responses at the very end of the read/write sequences within a predesignated time duration, say 100 �sec. In a normal case, the interface will put responses back to the Response FIFO in correct order. If there is no response within the prede ned time duration, the process will give up the CPU and enable interrupts. The advantage of this approach is that it eliminates all of the context switches. The disadvantages are that it is di�cult to choose an appropriate polling duration and it would tie up the CPU for a longer time.
Even though the above approaches can be applied to reduce the communication latency, the latency for transmitting short messages will still be dominated by the FC phase. With the careful design of newer network interfaces, the latency for short messages is expected to be reduced to under a couple hundred �sec instead of 1.4 milliseconds (the latency of the FC phase for writing 4 bytes of Class 1 data.) This will allow I/O intensive applications to e�ciently execute over Fibre Channel networks.
6 Conclusion Recent progress in high-speed networks has shifted the communication overhead from network media to network subsystems. Protocol processing in network subsystems often dominates the communication performance. Therefore, it is critical to improve the performance of network subsystems in order to achieve high-speed transmission. In this paper, we studied the network subsystem of an emerging and promising high-speed network, Fibre Channel. A detailed examination of this particular network subsystem was presented with emphasis on the interactions among its components. The Fibre Channel device driver was monitored in order to understand how it interacted with the rest of the network subsystem. It converts the user-level requests into interface commands and sends the commands to the network interface. By using hardware and software performance monitoring tools, we evaluated and analyzed the performance of the network subsystem. Simple timing equations were derived to approximate the measured results and to nd the communication bottlenecks in the network subsystem. Based on the performance evaluation, we found that the DMA operation dominates the performance of the network subsystem for transmitting large messages. By simply modifying the device driver to utilize the DMA mapping facility of the host system, the maximum achievable bandwidth was improved by 75%. Two approaches, overlapping di�erent phases of the communication latency and delayed status checking, were applied to reduce the communication latency by 15.9% for short messages. Other ways of improving the performance were also discussed. This study focused on the interactions among the components of a network subsystem. The 32
design issues of the network subsystems for high-speed networks such as network interface design, bus architecture, and host software systems, need to be further studied in order to improve the achievable bandwidth at the end-user level. ACKNOWLEDGEMENT The authors wish to express their sincere gratitude to Tom Ruwart of the Army High Performance Computing Center for help with the DMA mapping hardware, and Ronald J. Vetter at the University of North Carolina, James Schnepf and Rose Tsang at the University of Minnesota for their valuable comments and support.
References [1] Ancor Communications, Inc. VME CIM 250 Reference/User's Manual, No. PUB 006 A Rev. B, 1994. [2] Ancor Communications, Inc. CXT 250 16-Port Switch Installer's/User's Manual, No. PUB 007 A Rev. D, 1993. [3] T.M. Anderson and R.S. Cornelius. High-Performance Switching with Fiber Channel. In Proceedings of CompCon, pages 261{264. IEEE, February 1992. [4] ANSI X3T9.3. Fiber Channel - Physical and Signaling Interface (FC-PH), 4.2 edition, November 1993. [5] M.J. Bach. The Design of the Unix Operating System. Prentice-Hall Software Series. Prentice-Hall, London, 1987. [6] D. Banks and M. Prudence. A High-Performance Network Architecture for a PA-RISC Workstation. IEEE Journal on Selected Areas in Communications, 11(2):191{202, February 1993. [7] A. Berenbaum, J. Dixon, A. Iyengar, and S. Keshav. A Flexible ATM-Host Interface for XUNET II. IEEE Network, pages 18{23, July 1993. [8] D.D. Clark, V. Jacobson, J. Romkey, and H. Salwen. An Analysis of TCP Processing Overhead. IEEE Communications Magazine, 27(6):23{9, June 1989. [9] C. Dalton, G. Watson, D. Banks, C. Calamvokis, A. Edwards, and J. Lumley. Afterburner. IEEE Network, pages 36{43, July 1993. [10] D. Getchell and P. Rupert. Fiber Channel in the Local Area Network. IEEE LTS, pages 38{42, May 1992. [11] J. Hsieh, M. Lin, D.H.C. Du, and J.A. MacDonald. Performance Characteristics of HIPPI Networks. , Department of Computer Science, University of Minnesota, (in preparation) 1994. [12] H. Kanakia and D.R. Cheriton. The VMP Network Adapter Board (NAB): High Performance Network Communication for Multiprocessors. In Proc., ACM SIGCOMM '88, pages 175{187, Aug. 16-19 1988.
33
[13] M. Lin, J. Hsieh, D.H.C. Du, J.P. Thomas, and J.A. MacDonald. Distributed Network Computing over Local ATM Networks. Technical Report, TR-94-17, Department of Computer Science, University of Minnesota, March 1994. [14] K Malavalli and B. Stovhase. Distributed Computing with Fibre Channel Fabric. In Proceedings of CompCon, pages 269{274. IEEE, February 1992. [15] J. Pasquale, E. Anderson, and P.K. Muller. Container Shipping: Operating System Support for I/O-Intensive Applications. IEEE Computer, March 1994. [16] W. Peterson. The VMEbus handbook. VFEA International Trade Association, 3rd Edition, 1993. [17] K.K. Ramakrishnan. Performance Considerations in Designing Network Interfaces. IEEE Journal on Selected Areas in Communications, 11(2):203{219, February 1993. [18] T.M. Ruwart and M.T. O'Keefe. Performance Characteristics of a 100MB/second Disk Array. Preprint 93-123, Army High Performance Computing Research Center, University of Minnesota, December 1993. [19] M. Zitterbart, B. Stiller, and A.N. Tantawy. A Model for Flexible High-Performance Communicatin Subsystems. IEEE Journal on Selected Areas in Communications, 11(4):507{518, May 1993.
34