IEEE Conference on Communications and Network Security 2013 - Poster Session
Performance of Interval-based Features for Anomaly Detection in Network Traffic Kriangkrai Limthong Computer Engineering Department, Bangkok University, Pathumthani 10220, Thailand Graduate University of Advanced Studies (Sokendai), Chiyoda-ku, Tokyo 101-8430, Japan Email:
[email protected],
[email protected]
I. I NTRODUCTION Anomalies in computer network have caused a variety of serious problems, such as network congestions and a range of security issues. An expeditious detection method would help network administrators to protect network systems and prevent disastrous consequences from such anomalies. Due to a massive variation in network anomalies mainly caused by threats or accidents, there is no a perfect solution to cover all these anomalies. An adaptive method for detecting various anomalies in network traffic have been attractive. Many researchers have proposed thousands of detection methods from simple to sophisticated techniques in the past decades. We strongly believe that the machine learning is one of the effective and flexible methods for detecting various anomalies in network traffic. Anomaly detection using machine learning is an adjustable technique because it can be applied different algorithms or features for different types of anomalies. Various machine learning algorithms and techniques have been applied to achieve main objectives of anomaly detection in network traffic. Many proposed studies using machine learning have employed packet-based or flow-based features as a key for detection. Although packet-based or flow-based features can distinguish between normal and abnormal packets or flows, they cannot discover some unusual incidents such as outages or misconfigurations, which does not contain any relevant packet or flow. Therefore, only packet-based or flow-based features are not enough to cover a broad range of anomalies in network. In our previous study [1], it has been shown that intervalbased features can play a major role in anomaly detection. Interval-based features are characteristics of network traffic at individual time intervals. Examples of interval-based features are the number of packets, the number of IP addresses, or the number of ports at a particular interval. Rather than packet or flow discrimination, interval-based features try to discover the time interval which anomalies or unusual incidents occur. In this study, we conducted a series of experiments to examine which interval-based features are suitable for a particular type of attack. We also compared detection performance between individual features and a combination of all features. In our experiments, we applied well-known learning algorithms, namely multivariate normal distribution, k-nearest neighbor, and support vector machine, to explore detection performance.
978-1-4799-0895-0/13/$31.00 ©2013 IEEE
II. M ATERIALS AND M ETHODS For feature extraction, we concentrate on nine features as listed in Table I, and extracted all these features on a single interval basis. In this table, we shows the abbreviation of features in first column, the second column lists the name of features, and the last column describes the detail of each feature. TABLE I I NTERVAL - BASED F EATURES 𝑓# 𝑓1 𝑓2 𝑓3 𝑓4 𝑓5 𝑓6 𝑓7 𝑓8 𝑓9
Features Packet Byte Flow SrcAddr DstAddr SrcPort DstPort ΔAddr ΔPort
Description Number of packets Sum of packet size Number of flows Number of source addresses Number of destination addresses Number of source ports Number of destination ports ∣SrcAddr − DstAddr∣ ∣SrcPort − DstPort∣
For data set, we selected five types of attacks from the Lincoln Laboratory in the Massachusetts Institute of Technology [2], and combined these attack packets with normal traffic from our controlled campus network. The selected attacks are: 1) Back attack is a denial of service attack against the Apache web server through port 80, where a client requests a URL containing many backslashes. 2) IpSweep attack is a surveillance sweep performing either a port sweep or ping on multiple IP addresses. 3) Neptune attack is a SYN flood denial of service attack on one or more destination ports. 4) PortSweep attack is a surveillance sweep through many ports to determine which services are supported on a single host. 5) Smurf attack is an amplified attack using ICMP echo reply flood. In this study, we performed experiments and measured detection performance on individual attacks. Therefore, we can discover which features are suitable for each particular type. For performance evaluation, we use F-score value [3] on a per-interval basis. The F-score is the harmonic mean of precision (positive predictive value) and recall (sensitivity value). The F-score is in the range of 0 to 1, where 0 represents the worst detection performance, and 1 represents the best detection performance.
361
IEEE Conference on Communications and Network Security 2013 - Poster Session
MND
f1
f2
f3
f4
Learning time consumption of MND
KNN
f5
SVM
f6
f7
f8
f9
Time (seconds)
F-score
Back 1 0.75 0.5 0.25
fall
IpSweep F-score
0.5
0.25 f1
f2
f3
f4
f5
f6
f7
f8
f9
18 16 14 12 10 8 6 4
18 16 14 12 10 8 6
fall
4
Neptune F-score
1
100
0.75
90
80
70 60 50 Training data (days) 40
0.5 0.25 f1
f2
f3
f4
f5
f6
f7
f8
f9
fall
30
20
10
0 0
10
20
30
40
50
60
70
80
90 100
Number of features
PortSweep F-score
0.5 0.25
Fig. 2. f1
f2
f3
f4
f5
f6
f7
f8
f9
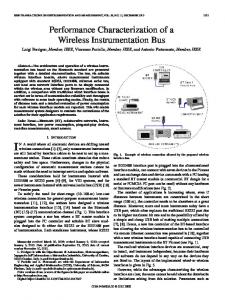
Time consumption of learning process using MND.
fall
Smurf
Detecting time consumption of MND
0.75 0.5 0.25 f1
Fig. 1.
f2
f3
f4
f5
f6
f7
f8
f9
fall
Time (Second)
F-score
1
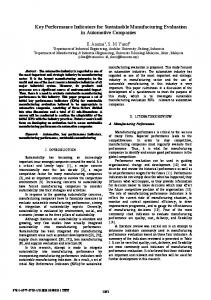
Comparison of detection performance using different features.
This study has the following process. We first decided on a learning algorithm among multivariate normal distribution, k-nearest neighbor, and support vector machine. Second, we selected the Back attack data set to start performing with the Packet feature (𝑓1 ) through the combination of all features (𝑓𝑎𝑙𝑙 ). In this step, we also measured the F-score for individual features. Next, we switched to the other types of attacks and carried out the same process as the Back attack with all features, we did so for all types of selected attacks. Finally, we changed the learning algorithm to another and did the same experiment for all three learning algorithms. III. P RELIMINARY R ESULTS AND D ISCUSSION Detection performance of all three learning algorithm using different features are shown in Figure 1. In this figure, the x-axis shows each individual feature from 𝑓1 to 𝑓9 , and 𝑓𝑎𝑙𝑙 the combination of all features. The y-axis indicates detection performance or F-score values between 0 and 1, where 0 represents the worst and 1 represents the best. Each row shows experiment results on different types of attacks, from top to bottom are the Back, IpSweep, Neptune, PortSweep, and Smurf respectively. Different vertical bars on the same feature indicate different learning algorithms: multivariate normal distribution (MND), k-nearest neighbor (KNN), and support vector machine (SVM). In our study, we also measured computational time during learning and detecting process for all three algorithms. Due to page limitation, we can demonstrate only time consumption results using multivariate normal distribution, where time consumption result over learning process has been shown in Figure 2, and detecting process has been shown in Figure 3. Where the x-axis indicates the number of features from 1 to
4 3.5 3 2.5 2 1.5 1 0.5 0
100
4 3.5 3 2.5 2 1.5 1 0.5 0
90
80
70 60 50 Training data (days) 40
Fig. 3.
30
20
10
0 0
10
20
30
40
50
60
70
80
90 100
Number of features
Time consumption of detecting process using MND.
100 features, the y-axis indicates the number of training data set, and the y-axis shows time consumption for one-day data. Preliminary results reveal which interval-based features are suitable for particular types of attacks in network traffic. Many features produced promising detection performance by using proper learning algorithms. For the same effective features, however, when we apply an improper learning algorithm, detection performance is not so satisfied. Time consumption results also show that it would be able to apply for real-time anomaly detection. Our future work are performing studies on other types of anomalies, and implementing this technique on our network environment for real-time detection. R EFERENCES [1] K. Limthong, P. Watanapongse, and F. Kensuke, “A wavelet-based anomaly detection for outbound network traffic,” in 8th Asia-Pacific Symposium on Information and Telecommunication Technologies, 2010. APSITT 2010. International Conference on, Jun 2010. [2] R. Lippmann, D. Fried, I. Graf, J. Haines, K. Kendall, D. McClung, D. Weber, S. Webster, D. Wyschogrod, R. Cunningham, and M. Zissman, “Evaluating intrusion detection systems: the 1998 darpa off-line intrusion detection evaluation,” vol. 2, 2000, pp. 12 –26 vol.2. [3] C. J. V. Rijsbergen, Information Retrieval. Newton, MA, USA: Butterworth-Heinemann, 1979.
362