broker-determined price for power. The disavantages are: (i-a) Human owners may not exist for some resources, or may not be able to or be willing to respond ...
Proceedings of the 2007 WSEAS International Conference on Computer Engineering and Applications, Gold Coast, Australia, January 17-19, 2007
Performance of Multi-agent Coordination of Distributed Energy Resources JIAMING LI, GEOFF POULTON, GEOFF JAMES, ASTRID ZEMAN, PETER WANG, MATTHEW CHADWICK, MAHENDRA RAJAH PIRAVEENAN CSIRO Information and Communications Technology Centre Locked Bag 17, North Ryde, NSW 1670 AUSTRALIA
Abstract: - This paper describes our research in technology for the management and control of distributed energy resource agents. An agent-based management and control system is being developed to enable largescale deployment of distributed energy resources. Local intelligent agents will allow consumers who are connected at low levels in the distribution network to manage their energy requirements and participate in coordinated responses to network stimuli. Such responses can be used to ease the volatility of wholesale electricity prices and assist constrained networks during summer and winter demand peaks. In our system, coordination of energy resources is decentralized. The coordination mechanism is asynchronous and adapts to change in an unsupervised manner, making it intrinsically scalable and robust. Key-Words: - Multi-agent coordination, Distributed energy resources, Agent-based management and control, Intelligent agent, Market-oriented algorithms, Price-based control.
1 Introduction With the increasing gap between electricity supply and demand, the electricity industry in many countries is facing a number of new pressures. The distributed electricity generation technologies, alongside improved demand-side management techniques have been identified as one set of solutions to this challenge [1]. The idea of switching loads and generators on/off to respond to price signals and network constraints is technically achievable and becoming more economically viable for businesses requiring greater supply reliability, flexibility, and lower cost to the consumers. We have been developing multi-agent technology for the management and control of distributed energy resources [2-3], aimed at deployment in the Australian National Electricity Market within the next five years. A component of this work is the development of algorithms for coordinating distributed energy resources (DERs) comprising customer loads and generators. DERs are coordinated to aggregate sufficient distributed capacity to be of strategic value to market participants such as retailers and network businesses. Such aggregation is a significant challenge, particularly for large numbers of DERs and when centralized control techniques are not feasible. To achieve a coordinated response by a group of
distributed energy agents we have previously developed planning algorithms [2], which combine predicted environmental conditions, models for the constraints and behaviour of loads and generators, and a system goal to calculate plans for each resource for a period into the future. Each plan is a state sequence, for example, a set of switching actions and times that an agent will carry out in the future. A centralized genetic optimization algorithm was used in [2] to simultaneously calculate the plans for each resource. Therefore, there are two problems that need to be solved: scalability to large numbers of resources; and adaptability to changes in both local and global conditions. Since the behaviour of all agents was optimized for a particular set of events, the solution was not expected to scale well, particularly as genetic algorithms are used as the optimization tool, and the assembly of agents must satisfy system global as well as local goals. Sudden changes in the situation of one or more agents are not anticipated or accounted for. For example, suppose that large quantities are added to or removed from a cool room; such an event would require re-optimization of the whole system. Two current methods of improving distribution exist in the literature and are currently under trial [47]. These, together with their problems, are as follows. i) Price-based control, where human “owners” of
568
Proceedings of the 2007 WSEAS International Conference on Computer Engineering and Applications, Gold Coast, Australia, January 17-19, 2007
each resource are asked to respond to a varying, broker-determined price for power. The disavantages are: (i-a) Human owners may not exist for some resources, or may not be able to or be willing to respond when asked. (i-b) There is no guarantee of the level of service to resources. (i-c) The process may lead to customer dissatisfaction since it requires effort from them and they are being asked to choose between cost, comfort and convenience. ii) Agent-based market-oriented algorithms, with real or virtual currency, where one or more broker agents carry out a negotiation process with each resource agent to fix usage and price. The disadvantages are: (ii-a) Lack of simple scalability. Market-based algorithms require hierarchies of brokers to negotiations with very large numbers of resources leading to potentially fragile structures. (ii-b) Market-based algorithms also require adaptation or replication to account for relationships between resource control actions at different times arising from their physical properties. (ii-c) Although the efficiency of market-based algorithms may be quantified there is no guarantee of an adequate level of service at resource or system level. In this paper we introduce an innovative distributed multi-agent coordination algorithm, which coordinates distributed energy resources by attempting to enforce a supply cap on the power drawn from the grid. The coordination mechanism is asynchronous and adapts to change in an unsupervised manner, making it intrinsically scalable and robust. In the system, individual agents are selfish agents, and reasonably simple. However, the complex system response emerges out of low level agent coordination, which is in stark contrast to traditional centralized control systems. This work will bring potential solutions to the volatility of wholesale pool prices and an alternative way of dealing with network constraints during summer and winter peaks. The paper is organized as follows. Section 2 briefly introduces our distributed energy resource agent coordination system and shows how the system works based on available real time electricity market information. Since the technique is still in the patenting review process, the detailed technical parts will be omitted. Section 3 gives a series of experimental results, and section 4 concludes this paper.
2 Management and Control of Distributed Resource Agent System
In order to design a simpler, faster and scaleindependent algorithm, a distributed energy resource agent coordination system has been developed consisting of: • A group of resource agents. Each resource agent is a standalone computer program that controls a load or generator and has modelling capability to plan its electricity demand or supply for a period into the future. • One or more broker agents. Each broker agent is a standalone computer program that receives information about network or market needs and determines a control signal, e.g. a grid supply cap for a certain period of time. Resource agents are selfish: their primary purpose is to satisfy local goals
2.1 How the System Works The resource agents have information about local constraints imposed by the electricity customer who owns the load or generator. Examples of constraints are temperature bounds for a heating/cooling environment. At convenient intervals the resource agents apply these constraints to a physical model of their resource to calculate a plan for electricity demand or supply for a period into the future, e.g. the next half hour. The broker agent has knowledge of predicted electricity market price as well as information about the plans communicated by participating resource agents. The broker acts for electricity market participants, such as retailers and network operators, who provide additional information leading to a desired cap on the total demand for power drawn from the grid. From this information the broker agent derives key features which are made available to resource agents, enabling them to revise their plans to help achieve global goals whilst continuing to adhere to their local constraints. By submitting revised plans they participate in a real-time process that continues until it stabilises. The process is asynchronous: no explicit coordination is needed between plan submission and broker action. The process is governed by the dispatch and trading cycles of the electricity market which determine when planning should advance to another time interval. The heart of the algorithm, which allows the coordination process to be scalable and adaptable, lies in the broker-derived features and the means of communication between broker and resource agents.
569
Proceedings of the 2007 WSEAS International Conference on Computer Engineering and Applications, Gold Coast, Australia, January 17-19, 2007
2.2 Grid Supply Cap Based on Electricity Market Price In Australia, the National Electricity Market Management Company (NEMMCO) was established to manage the operation of the wholesale electricity market and security of the power system. Our homes, businesses and industries depend on a reliable supply of electricity to function. NEMMCO plays a central role in ensuring south-eastern Australia’s electricity supply through its responsibilities as market and system operator of the National Electricity Market (NEM). There is much electricity demand and price information available from NEMMCO, such as 5-minute pre-dispatch (forecast) prices, 30-minute pre-dispatch prices, 5minute dispatch prices, 30-minute trading prices, etc. In our system, since we need to calculate a rolling plan of electricity demand or supply for a relatively short period into the future, we use 5minute pre-dispatch prices for the broker to set the system grid supply cap to maximize system profits. The 5 minute pre-dispatch price file is usually published one minute before the time of first prediction price and contains 5 minute pre-dispatch (forecast) data by region, showing short term price and demand forecasts looking out one hour ahead. The information is updated every 5 minutes. The 5minute pre-dispatch price file is available in CSV format from the NEMMCO website [8].
3 Experimental Results We have developed a system with one broker agent and a number of loads – all cool room agents. The broker agent reads 5-minute pre-dispatch wholesale electricity prices from NEMMCO and sets the grid supply cap accordingly. Each cool room agent calculates a plan of electricity demand for the next half hour which satisfies its internal temperature constraints. Then cool room agents communicate and act as described in section 2, effectively cooperating to satisfy the system supply cap whilst continuing to adhere to their local constraints. A series of experiments has been completed to investigate system coordination performance, which includes coordination scalability, maximum system demand reduction for a short period supply cap, the effect of resource agent diversity on coordination performance, and continuous coordination benefits for resource agents. Sections 3.1 to 3.3 describe experiments implemented in MATLAB® and Section 3.4 describes experiments implemented in GridAgents [9], a real-time agent environment
tailored to distributed energy applications and built upon the open-source Java Agent Development Framework (JADE) [10].
3.1 Room Model Cool rooms have internal temperature constraints with hard boundaries at 1˚ and 6˚ Celsius and soft boundaries at 2˚ and 5˚ Celsius. The internal temperature is governed by the model developed in [11] with most room features removed for the purposes of these experiments: 1 Tai (t ) = (C f T (t − 1) + Q p (t ) + k Tao (t )) Ca f + k a ai
(1)
where Tai is internal temperature, Tao is external air temperature, Qp is the power capacity of the cool room plant, Ca is the thermal capacity of air in the cool room, f is the sampling rate, k = AwU w + U v , Aw is a coefficient, and Uw, Uv are thermal resistances of the wall and ventilation path. We modelled non-identical resource agents by allowing different thermal capacities Ca in the room model. In our experiments, f = 3000, A g = 1 / 58.9 , U = 6 , and g
U
v
= 0
.
3.2 Coordination of Constant Supply Cap 3.2.1 Small Diversity of Cool Rooms We modelled a set of similar cool rooms with power capacity Qp = 3 kW and thermal capacity of air varying within a narrow range given by n C a = C a 0 (1 + 0.9 )
where
C ao = 8.8964 × 10
−4
(2)
and n = {1, … , N } for a set
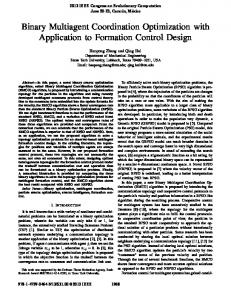
of N cool rooms. The thermal capacity is reflected in the typical period of a heating/cooling cycle. Fig. 1 shows initial room temperatures and power demands for future half hour periods for a system with 3 cool rooms. The time constants of all cool rooms are very close to each other. A constant supply cap, 3kW, is applied to the system. Before coordination, the supply cap is not satisfied for the time 9:25 to 9:40. After several steps of coordination among resource agents, the supply cap is satisfied as shown in Fig. 2. Table 1 lists coordination performance for the system with constant demand cap and different numbers of resource agents. From the table we can see that when agent numbers increase, the number of coordination steps increases as well, but at a much slower rate. When the number of agents is big
570
Proceedings of the 2007 WSEAS International Conference on Computer Engineering and Applications, Gold Coast, Australia, January 17-19, 2007
enough, e.g. 10,000, the number of coordination steps even decreases. This indicates that the number of coordination steps converges, so the coordination process is scalable. In our simulation experiments, all resource agents were executed on one computer and used non-threaded calculations. In a deployed environment, each resource agent will have a dedicated machine and use threaded calculation. The total time for system coordination is less than 47 milliseconds for a system with 10,000 agents, which is extremely fast. Therefore real time, deployed coordination is certainly possible.
internal temperature of 1# 5 0 9:15
9:20
9:25
9:30 9:35 instant power of 1#
9:40
9:45
5 0 9:15
9:20
9:25 9:30 9:35 internal temperature of 2#
9:40
9:45
5 0 9:15
9:20
9:25
9:30 9:35 instant power of 2#
9:40
9:45
5 0 9:15
9:20
9:25 9:30 9:35 internal temperature of 3#
9:40
9:45
5 0 9:15
9:20
9:25
9:40
9:45
5 0 9:15
9:20
9:40
9:45
9:40
9:45
9:30 9:35 instant power of 3#
9:25 9:30 9:35 total power demand and grid supply cap
5
Table 1. Coordination for Different Number of Resource Agents Agent No. 1 10 100 1000 10000
3.2.2
Supply Cap (kW) 1 10 100 1000 10000
Coordination Steps 6 6 20 32 23
Time per Agent (sec.) 0.16 0.03 0.028 0.045 0.047
Large Diversity of Cool Rooms initial internal temperature of 1# 5 0 9:15
9:20
9:25
9:30 9:35 initial instant power of 1#
9:40
9:45
5 0 9:15
9:20
9:25 9:30 9:35 initial internal temperature of 2#
9:40
9:45
5 0 9:15
9:20
9:25
9:30 9:35 initial instant power of 2#
9:40
9:45
5 0 9:15
9:20
9:25 9:30 9:35 initial internal temperature of 3#
9:40
9:45
5 0 9:15
9:20
9:25
9:40
9:45
5 0 9:15
9:20
9:40
9:45
5 0 9:15
9:20
9:40
9:45
9:30 9:35 initial instant power of 3#
9:25 9:30 9:35 initial total power demand and grid supply cap
9:25
9:30
9:35
Fig. 1. Room & System States before Coordination
0 9:15
9:20
9:25
9:30
9:35
Fig. 2. Room & System States after Coordination. A system consisting of 10,000 cool rooms with large variations in parameters has been set up to test coordination performance and scalability. The cool rooms have the same temperature constraint, but diverse power capacities and time constants, random starting internal temperatures, and random initial switching states for the cooling plan. Table 2 lists the minimum supply cap achievable for the systems comprising resource agents with different ranges of parameters. “Capacity” is the power capacity of resource agents, “Ton” is turn on time constant of resource agents, “Toff” is turn off time constant of resource agents, “Cap” is the minimum system supply cap which could be satisfied, and “Stp” is the number of coordination steps needed for resource agents to satisfy the supply cap. Systems 1 to 3 have increasing diversity of resource agents. From the table, we can see that the system with more diverse resource agents will tolerate a smaller supply cap. Table 2. Coordination System with 10,000 Resource Agents System 1 2 3
Capacit y (kW) 3 3~ 6.76 1.5~ 6.8
Ton (min) 9.5~ 17.8 4.83~ 10.3 4.83~ 37.3
Toff (min) 8.8~ 16.7 4.5~ 34.8 4.5~ 35
Cap (kW) 10000
Stp
7100
6
5000
6
6
Table 3 gives constant cap coordination performance for the system 2 with different numbers of resource agents. Comparing with table 1, we can see that for the same supply cap, the system with the larger diversity among resource agents is able to coordinate much more easily. The coordination is scalable for large numbers of agents. Table 3. Coordination for Different
571
Proceedings of the 2007 WSEAS International Conference on Computer Engineering and Applications, Gold Coast, Australia, January 17-19, 2007
Coordination Steps 5 2 1 1
Time per Agent (sec.) 0.03 0.0096 0.0073 0.0076
3.3 Continuous Coordination In a deployed environment, resource agents coordinate their plans every 5 minutes, i.e., continuously coordinate with each other. To investigate the system continuous coordination performance, we carried out a series of tests based on the systems 2 & 3 in table2. 3.3.1 Demand Reduction for Short-period Supply Cap In a real situation, a supply cap occurs only when the electricity price is high enough. The broker may give advance notice to resource agents before supplying the cap. To test the system response to different cap notice times, the following tests have been executed for a supply cap of 15 minutes’ duration. Table 4. Demand reduction for different advance notice times System
2
3
Advance Notice (minutes) 5 10 15 5 10 15
Maximum Demand Reduction 42.5% 44% 45% 50% 52% 52%
Suppose the cap occurs between 9:30 and 9:45. Advance cap notices of 5, 10 and 15 minutes were investigated. Table 4 gives the percentage reduction in demand that could be achieved for different advance notice times. We can see that the more advance notice time is given, the more demand reduction can be achieved; the greater diversity of resource agents in the system, the more demand reduction can be achieved.
am. The supply cap is set based on the NEMCCO 5min pre-dispatch price: when price is more than $170/Mw supply cap will be 85% of total demand. Experimental results are shown in table 5 and Fig. 3. Table 5 shows the experimental results for systems with different numbers of resource agents. For each system, the total electricity cost is compared with and without the supply cap. From the table we can see that for systems with different numbers of resource agents, from 250 to 10,000 agents, the total cost saving is about the same. This further demonstrates the system scalability. Fig. 3 shows the results for a 10,000-agent system. In this example the NEM electricity price is high from 12:30 to 16:00. The system cost in this period drops from $175,851 to $164,009 as a result of applying the supply cap and achieving a 12% demand reduction during this time. Because the internal temperature constraints are always satisfied, the total power usage averaged over time must be similar with and without the supply cap, being determined by the rate of heat flow through the cool room walls. Thus the demand reduction (12%) obtained for this long-period cap is less than that obtained for a short-period cap (~40%). We expect that more sophisticated and optimised broker rules can achieve greater demand reductions in both cases. Table 5. Continuous Coordination System. Agent No. Total Total Cost Saving Cost with without Cap Cap 250 $4,096 $4,376 6% 500 $8,134 $8,710 7% 1000 $16,355 $17,273 5% 10000 $164,009 $175,851 7% 4
x 10
3
Cost Saving with Supply Cap is 7%
Total Power with Supply Cap (costs $164009) Total Power withOut Supply Cap (costs $175851) 250 Supply Cap
2.5 200 2 150 1.5
100 1
50
0.5
3.3.2 Demand Reduction for Continuous Coordination System Demand reductions of continuous coordination for system 2 have also been tested, based on actual NEM price data. The continuous coordination is simulated for 24 hours, in this example from 3rd January 2006 at 9:15 am to 4th January 2006 at 9:10
9:15 11:15 13:15 15:15 17:15 19:15 21:15 23:15 1:15 Time (Hour:Minute)
3:15
5:15
7:15
0
NEM 5-min Pre-dispatch Price ($/MW)
Supply Cap (kW) 10 100 1000 10000
System Power Consumption (kW)
Number of Resource Agents. Agent No. 10 100 1000 10000
572
Proceedings of the 2007 WSEAS International Conference on Computer Engineering and Applications, Gold Coast, Australia, January 17-19, 2007
4
x 10
Cost Saving with Supply Cap is 12%
200 2
100
1
Total Power with Supply Cap (costs $91063) Total Power withOut Supply Cap (costs $102905) Supply Cap
NEM 5-min Pre-dispatch Price ($/MW)
System Power Consumption (kW)
3
are inherent features of a real-time environment helped to improve the speed and quality with which agents satisfy the cap. This is early experimental evidence that convergence of the coordination process is not only possible in a deployed environment, with asynchronous actions and communications, but improved over a more synchronous simulation environment.
0 0 12:00 12:20 12:40 13:00 13:20 13:40 14:00 14:20 14:40 15:00 15:20 15:40 16:00 Time (Hour:Minute)
Fig. 3. Coordination System with 10000 Resource Agents
3.4 Asynchronous Coordination in a RealTime Environment A real-time environment has been implemented using JADE, the Java Agent Development Framework, in order to test the viability of the algorithm within a real-time, asynchronous environment. Using a Java-based framework enabled us to run our agents on many different platforms and also armed us with the ability to use the same code both in simulation and deployment. Our JADE implementation of the system was designed to maintain total independence between agents. To reduce network traffic, ensure system integrity and reduce the coupling between agents, wherever possible, information between agents is exchanged on request. A single communication in algorithmic terms is implemented as a brief conversation consisting of a sequence of events. Each agent is designed with a set of behaviours that can be invoked in any order. This reduces the coupling between behaviours and allows an agent to reprioritise its responsibilities with ease. The advantages of plug-and-play behaviours allow any programmer to construct an agent with different responsibilities with swiftness and simplicity. Our initial experiments in the JADE environment involved one broker and 100 resource agents. Fig. 4 illustrates the total predicted load on the grid (upper graphs) which consists of the individual resource agent demands (bottom graphs). Two screen captures were taken of the system; the right capture was taken one minute after the first. The resource agents satisfy the cap, marked by a horizontal line in the top panel, within one minute of the broker agent determining the cap level. The cap was set at 50% of the consumption when the NEM price was at a maximum. The test results of our JADE implementation revealed a particular point of interest: the randomness in agent start-up and cycle times which
4 Conclusion An innovative distributed multi-agent coordination system has been introduced in this paper, which coordinates distributed energy resources to permit a supply cap on the power drawn from the grid. The coordination mechanism is asynchronous and adapts to change in an unsupervised manner, making it intrinsically scalable and robust. This system overcomes many of the difficulties of previously reported coordination systems. In addition, the following points should be noted. The system remains robust under changing circumstances of resources even for large resource numbers. The system automatically includes different scales of temporal dependency through the amalgamation of energy consumption plans.
Fig. 4. 100 resource agents satisfy the cap imposed by the broker agent within 1 minute (left panel indicates the time that the cap was set). References: [1] United States D.O.E.: “Report of the US Department of Energy’s Power Outage Study Team”, Final report (March 2002). [2] Guo, Y., Li, J., and James, G., “Evolutionary Optimisation of Distributed Electrical Loads and Generators”, Proceedings, 18th Australian Joint Conference on Artificial Intelligence (AI’05), Sydney, Australia, 5-9 Dec 2005, pp. 1086-1091. [3] Jones, T. E., and James, G. C., “The Management and Control of Distributed Energy Resources”, Proceedings, CIGRE Symposium on Power Systems with Dispersed Generation, Athens, April 2005. [4] Regan, T., Sinnock, H., and Davis, A., “Distributed Energy Neural Network Integration System: Year One Final Report”, NREL/SR-56034216 , June 2003.
573
Proceedings of the 2007 WSEAS International Conference on Computer Engineering and Applications, Gold Coast, Australia, January 17-19, 2007
[5] Jones, T. E., and James, G. C., “The Management. Dimeas, L., and Hatziargyriou, N. D., “Operation of a Multi Agent System for Microgrid Control”, IEEE Transactions on Power Systems, November 2004. [6] Akkermans, H., Schreinemakers, J., and Kok, K., “Microeconomic Distributed Control: Theory and Application of Multi-Agent Electronic Markets”, Proceedings, 4th international joint conference on Autonomous Agents and Multiagent Systems, July 2005. [7] Ygge, F., “Market-Oriented Programming and its Application to Power Load Management”, Ph.D. Thesis, ISBN 91-628-3055-4, Lund University, 1998. [8] See http://www.nemmco.com.au/. [9] See http://www.ict.csiro.au/page.php?did=225. [10] See http://jade.tilab.com/. [11] Hudson, G. and Underwood, C. P., “A Simpl Building Modelling Procedure for MatLab/Simulink”, Proceedings, International Building Performance and Simulation Conference, Kyoto, 1999.
574