Jun 1, 2011 - Grow up server consolidation with the progress ... Monitor. CPU/MemoryControl. IO Control. Resource Contro
Linux Con JAPAN 2011(Yokohama)
June 1st 2011
Performance Prediction and Optimization using Linux/cgroups
Yuzuru Maya Hitachi, Ltd., Yokohama Research Laboratory Copyright (c) 2011 Hitachi Ltd., Yokohama Research Lab. All right reserved
1
Agenda • • • • •
Background Outline of Linux/Cgroups Performance prediction with RA Evaluation Conclusion
RA: Regression Analysis Copyright (c) 2011 Hitachi Ltd., Yokohama Research Lab. All right reserved
2
Background - Grow up server consolidation with the progress of the virtualization technology. - guarantee real time and performance at the same time and in the same server. - need stable operation. - Important to optimize computing resources with performance prediction. - Cgroups will be essential for process computing and cloud computing because of computing resources and access control.
Copyright (c) 2011 Hitachi Ltd., Yokohama Research Lab. All right reserved
3
Outline of Linux/Cgroups (1) Bandwidth control - Bandwidth control of CPU, Memory, Network and Disk. - Account the CPU usage. (2) Access control - Access control of device. - Constrain CPU and memory placement of tasks. - name space control. (3) Group control - Freeze task. - checkpoint and restart. Copyright (c) 2011 Hitachi Ltd., Yokohama Research Lab. All right reserved
4
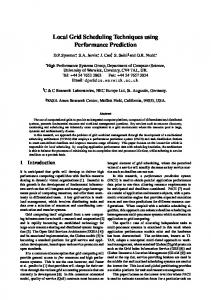
Target we research and develop on Linux/Cgroups AP-A AP-A Priority:High Priority:High
AP-B AP-B Priority:Low Priority:Low
Resource Control/Access Control
IO Control
CPU/MemoryControl
Require IO Throughput and Latency.
Monitor
Statistics data
Prediction performance
Compare Data measured and required data
(1) Dev target 1 Develop Cgroups itself. Feedback
Disk Server
Resource assignment (2) Dev target 2 Develop using Cgroups
(This presentation) Copyright (c) 2011 Hitachi Ltd., Yokohama Research Lab. All right reserved
5
Outline of Block IO control (1) About blkio.weight bandwidth of IO. range of weights is from 100 to 1000. IO-Weight is blkio.weight/100 (from 1 to 10) to simplify in only this presentation. (2) Construct Measurement environment. mount -t cgroup none /cgroup/ -o blkio mkdir -p /cgroup/test1 /cgroup/test2 echo 900 > /cgroup/test1/bklio.weight echo 100 > /cgroup/test2/bklio.weight ./fio-test.sh Copyright (c) 2011 Hitachi Ltd., Yokohama Research Lab. All right reserved
6
Measurement Environment 【Measurement Machine】 # Item Content Dell PowerEdge840 1 Machine CPU:Intel Xeon 3060 2.4GHz, Core(2), Memory:4 GB 2 OS RHEL6.0β2 x86_64 3 Benchmark FIO (Flexible IO) version1.41 【FIO condition】 # 1 2 3 4 5
Item Measurement item Access type Measure time IO type I/O type
Content IO Throughput (IO issue per second) & Latency (IO Complete clat) Random read/write 360 sec Asynchronous I/O 4kB,64kB
Copyright (c) 2011 Hitachi Ltd., Yokohama Research Lab. All right reserved
7
Measurement item and result queryA: (g=0): rw=randrw, bs=32K-32K/32K-32K, ioengine=libaio, iodepth=50 Starting 1 process queryA: (groupid=0, jobs=1): err= 0: pid=6562 read : io=602MB, bw=1,710KB/s, iops=53, runt=360548msec slat (usec): min=6, max=331K, avg=260.46, stdev=6901.12 clat (usec): min=21, max=2,183K, avg=474887.53, stdev=433054.37 bw (KB/s) : min= 0, max= 4187, per=103.88%, avg=1776.39, stdev=847.50 write: io=590MB, bw=1,677KB/s, iops=52, runt=360548msec slat (usec): min=6, max=1,192K, avg=459.21, stdev=12281.17 clat (usec): min=262, max=2,200K, avg=468998.71, stdev=431350.99 bw (KB/s) : min= 0, max= 5396, per=96.80%, avg=1622.29, stdev=947.72 cpu : usr=0.04%, sys=0.23%, ctx=36654, majf=0, minf=41 IO depths : 1=0.1%, 2=0.1%, 4=0.1%, 8=0.1%, 16=0.2%, 32=99.6%, >=64=0.0% submit : 0=0.0%, 4=100.0%, 8=0.0%, 16=0.0%, 32=0.0%, 64=0.0%, >=64=0.0% complete : 0=0.0%, 4=100.0%, 8=0.0%, 16=0.0%, 32=0.0%, 64=0.1%, >=64=0.0% issued r/w: total=19268/18893, short=0/0 lat (usec): 50=0.01%, 100=0.01%, 250=0.02%, 500=0.65%, 750=0.09% lat (usec): 1000=0.12% lat (msec): 2=0.15%, 4=0.24%, 10=1.78%, 20=3.31%, 50=7.80% lat (msec): 100=8.29%, 250=16.79%, 500=22.52%, 750=15.86%, 1000=9.92% lat (msec): 2000=12.33%, >=2000=0.12% Run status group 0 (all jobs): READ: io=602MB, aggrb=1,710KB/s, minb=1,751KB/s, maxb=1,751KB/s, mint=360548msec, maxt=360548msec WRITE: io=590MB, aggrb=1,676KB/s, minb=1,717KB/s, maxb=1,717KB/s, mint=360548msec, maxt=360548msec Disk stats (read/write): dm-0: ios=31502/34760, merge=0/0, ticks=15140973/16651011, in_queue=31824277, util=100.00%, aggrios=0/0, aggrmerge=0/0, aggrticks=0/0, aggrin_queue=0, aggrutil=0.00% sdb: ios=0/0, merge=0/0, ticks=0/0, in_queue=0, util=-nan%
Measurement item ・IO Throughput (IO issue per sec) ・Latency (clat) clat:complete latency
Copyright (c) 2011 Hitachi Ltd., Yokohama Research Lab. All right reserved
8
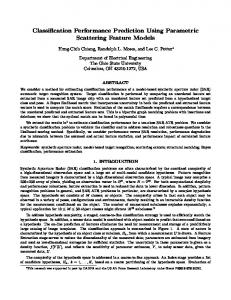
Measurement Data IO Size: 4kB 3,000
6 Latency
2,500
5
2,000
4
1,500
3
1,000
2
500
1
0
0
1
2
3
4
5
6
7
8
9
Latency (msec)
IO Throughput (times/sec)
IO Throughput
0 10
IO-Weight IO-Weight: blkio.weight/100 Copyright (c) 2011 Hitachi Ltd., Yokohama Research Lab. All right reserved
9
What is Regression Analysis (RA)? Why the straight line? To reduce computational complexity to be able to set the moderate value in online in the future. (1) Regression Analysis? To be approximated by the straight line that is the nearest to data. ~ Sxy = ∑(xi-x)・∑(y ~ i-y) b = Sxy /Sx y = a + b・x Sx = ∑(xi-x) ~ ~ ~ a = y – b・x ~ :average (2) Least Squares Method To minimize the distance between each point and the straight line. Copyright (c) 2011 Hitachi Ltd., Yokohama Research Lab. All right reserved
10
Adapt Regression analysis (1) 【Purpose】 Predict performance with Regression analysis 【Procedure】 (1) Regression analysis with all range of IO-Weight - IO-Weight : from 1 to 9 【Result】 - IO throughput May be good(easy to predict). - Latency Not so good(hard to predict). point to rise suddenly when I make IO-Weight small(1-3). IO-Weight is an evaluation to 1-9, and the predictive range of the regression analysis is wide, and a prediction is difficult. An evaluation to considering a characteristic of IO throughput the latency is necessary. Copyright (c) 2011 Hitachi Ltd., Yokohama Research Lab. All right reserved
11
【Regression Analysis (1)】 IO Size: 4kB 3,000
6 Latency
2,500
5
2,000
4
1,500
3
1,000
2
500
1
0
0
1
2
3
4
5
6
7
8
9
Latency (msec)
IO Throughput (times/sec)
IO Throughput
0 10
IO-Weight IO-Weight: blkio.weight/100 Copyright (c) 2011 Hitachi Ltd., Yokohama Research Lab. All right reserved
12
Adapt Regression Analysis (2) 【Purpose】 Extract characteristic of IO Throughput and Latency by limited IO-Weight range. 【Procedure】 (1) Regression analysis with partitioned range of IO-Weight - Divide IO-Weight as limited range as1-3, 4-6, 7-9 etc. - Do Regression analysis. (2) Characteristic of IO Throughput and Latency - IO throughput Improve linearly according to the mount of resources. - Latency Be constant (cannot shorten) even if resources is increased. Copyright (c) 2011 Hitachi Ltd., Yokohama Research Lab. All right reserved
13
【Regression Analysis (2)】 IO Size: 4kB 3,000
6 Latency
2,500
5
2,000
4
1,500
3
1,000
2
500
1
0
0
1
2
3
4
5
6
7
8
9
Latency (msec)
IO Throughput (times/sec)
IO Throughput
0 10
IO-Weight IO-Weight: blkio.weight/100 Copyright (c) 2011 Hitachi Ltd., Yokohama Research Lab. All right reserved
14
Optimized procedure 【Optimized procedure】 (1) Collect statistics data ・Normalize data. (Sum of IO-Weight is 10
Collect statistics data (Normalize)
and decide performance of each IO-Weight (1 to 9).)
(2) Predict performance ・Predict performance by statistics data.
Predict Performance Set IO-Weight.
・Set IO-Weight.
Compare data measured and required data
(3) Compare with measured and required data ・Within allowable range, do nothing to modify IO-Weight.
Feedback Set IO-Weight again
・Without allowable range, do feedback and set IO-Weight again. Copyright (c) 2011 Hitachi Ltd., Yokohama Research Lab. All right reserved
15
Evaluation
【Procedure】
(1) Predict Latency and IO Throughput of 16kB by data of 4kB and 64kB. (2) Predict most suitable IO-Weight and perform performance measurement and check whether AP requirement is satisfied. (3) Feed back again if I do not meet it. Case 1 2 3
AP AP-A AP-B AP-A AP-B AP-A AP-B
Required value Latency IO Throughput 2.0 1,500 4.0 750 1.0 2,500 6.0 500 1.0 2,500 1.5 1,750
Copyright (c) 2011 Hitachi Ltd., Yokohama Research Lab. All right reserved
16
Example of case1(OK without feedback) 12
IO Throughput (times/sec)
3,000 4kB
10
64kB 64kB
2,000 1,500
8
16kB 4kB
6
③ AP-B
1,000
③
②
②
① 4
AP-A
500
① 0
2
4
6
8
Latency (msec)
2,500
2
10
IO-Weight Copyright (c) 2011 Hitachi Ltd., Yokohama Research Lab. All right reserved
17
Example of case2 (OK with feedback) IO Throughput (times/sec)
3,000
12 4kB
10
64kB 64kB
2,000 1,500
8
16kB 4kB
③
6
AP-B
①
1,000
4
③
②
②
AP-A
500
① 0
2
4
6
8
Latency (msec)
2,500
2
10
IO-Weight Copyright (c) 2011 Hitachi Ltd., Yokohama Research Lab. All right reserved
18
Example of case3 (NG: shortage of resource) IO Throughput (times/sec)
3,000
12 4kB
10
64kB 64kB
2,000 1,500
8
16kB 4kB
6
③ ①
②
1,000
③
4
AP-B
②
500
①
Latency (msec)
2,500
2
AP-A
0
2
4
6
8
10
IO-Weight Copyright (c) 2011 Hitachi Ltd., Yokohama Research Lab. All right reserved
19
Evaluation result Case 1
2
3
After feedback
Before feedback AP
IOWeight
Latency
AP-A
5
2.01 (2.0)
1,789 (1,500)
-
-
-
AP-B
3
3.93 (4.0)
985 (900)
-
-
-
Reserved
2
5.25
736
-
-
-
AP-A
7
1.51 (1.0)
2,224 (2,500)
8
1.02 (1.0)
2,538 (2,500)
AP-B
2
5.84 (6.0)
670 (500)
2
4.66 (2.0)
751 (500)
Reserved
1
10.6
371
0
-
-
AP-A
9 -> 6
2.01 (1.0)
1,879 (2,500)
AP-B
6 -> 4
2.89 (1.5)
1,333 (1,500)
Reserved
-5 -> 0
-
-
IOIO Latency Throughput Weight
IO Throughput
Resource shortage by reserved value after performance prediction.
Upper:Measured value,(Lower):Required value Copyright (c) 2011 Hitachi Ltd., Yokohama Research Lab. All right reserved
Evalu ation
○
△
×
20
Conclusion 1. Summary (1) Normalize throughput and latency with fio. - Evaluate Linux/Cgroups (2) Adapt Regression Analysis - RA1: Adapt RA in all field (from 1 to 9). - RA2: Divide 3 parts and adapt RA. (3) Propose Feedback function - to enable to be within an allowable error. 2. Future Works (1) Predict performance in online and set. (2) Cooperate other resource assignment - CPU and memory (3) and cooperate access control. Copyright (c) 2011 Hitachi Ltd., Yokohama Research Lab. All right reserved
21
-Linux is a trademark of Linus Torvalds in the United States, other countries, or both. -Other company, product, or service names may be trademarks or service marks of others.
Copyright (c) 2011 Hitachi Ltd., Yokohama Research Lab. All right reserved