Performance Study of Robust Data Transfer Protocol for VANETS M. Chuah
Dept of CSE Lehigh University Bethlehem, PA 18015, USA
[email protected]
ABSTRACT
VANETs has emerged as the new network environment for intelligent transportations systems. In this paper, we focus on two types of VANET applications and evaluate the effectiveness of our data dissemination protocol for these two types of applications. In particular, we investigate traffic monitoring (TM) and roadside message transfer (RMT) applications. The traffic monitoring application (TMA) allows drivers to query traffic conditions at some distance ahead of themselves so that they can make decisions on route changes. The roadside message transfer application (RMTA) allows data messages to be delivered between roadside entities e.g. emergency messages via the moving vehicles. We design a robust data transfer protocol (RDTP) for these two applications. Via simulation studies, we evaluate how vehicular density, vehicular speed affect the performance of the data transfer protocol we design. We also compare the performance of our protocol with two existing protocols. For TMA, RDTP achieves comparably accurate speed estimate and higher query success rate with lower control overhead when compared to VITP, an existing protocol for the same application. For RMTA, RDTP achieves higher data throughput and lower delivery latency when compared to an existing approach.
Categories and Subject Descriptors
C.2.2 [Network Protocols]: Routing Protocols
General Terms
Algorithms, Performance, Design.
Keywords
Data Dissemination, Vehicular Adhoc Networks, Adaptive.
1. INTRODUCTION
In the near future, many vehicles will be equipped with computing technologies and wireless communication devices. Thus, intelligent transport systems (ITS) [1],[2] can become a reality very soon. Such systems can enable a wide range of applications e.g. emergency message dissemination, real-time traffic condition monitoring, collision avoidance, and real-time route scheduling. Traditional ITSes often rely on certain infrastructures e.g. installing roadside traffic sensors (or cameras) and having such sensors report the data to a central database via
F. Fu
Dept of CSE Lehigh University Bethlehem, PA 18015, USA
[email protected] cellular networks. Users can query the aggregated information via cellular networks. However, such traditional systems are expensive since sensors need to be installed on every road in which the system is going to be used. In addition, such systems are not scalable due to their centralized design. Vehicular ad hoc networks based on short-range wireless communications (e.g. IEEE 802.11) has emerged as the preferred network design for intelligent transportation systems. The Federal Communications Commission (FCC) has recently allocated 75 MHz in the 5.9 GHz band for licensed Dedicated Short Range Communication (DSRC) [3] for vehicle-to-vehicle and vehicle-to-infrastructure communications. Unlike infrastructure-based networks, VANETs are constructed onthe-fly and do not require any investment except for the wireless network interfaces which may be a standard feature in next-generation vehicles. An important problem to be solved for VANETs is to efficiently disseminate information among vehicles in a scalable manner. In some applications, the information is disseminated proactively using broadcast (push model), while in others, the information is obtained on-demand (pull model). Different applications may require different dissemination models. In this paper, we consider two types of applications. The first application is real-time traffic monitoring [4]. A user behind a vehicle can issue a query to find out the average vehicular speed at a certain distance ahead of the vehicle. Such information allows a driver to determine if there is a traffic jam ahead so that he can take an alternate routes to avoid the congestion area. The second application is data transfer between two road-side entities [5]. There are several motivations for this second application. For example, an accident occurs at some point on the highway and a data relaying scheme can facilitate transfer of emergency data (e.g. medical information) between a vehicle at the site of an accident and a base station located further down the highway. Data relaying over vehicular networks reduce the number of road-side base stations that need to be installed and also reduce the cost of backhaul network that connect these road-side entities. The organization of the paper is as follows. In Section 2, we review related work and in Section 3, we state
the problem that is being addressed in this paper. In Section 4, we present our data transfer protocol for supporting these two applications in vehicular adhoc networks. In Section 5, we describe our simulation model. Then, we present and discuss the simulation results we obtained. We conclude with discussions on some future work in Section 6.
response first and be selected as the relay node. In this paper, we design a multihop data transfer protocol to handle both types of applications. We compare our approach with the single hop approach described in [5] and the VITP protocol described in [4].
2. Related Work
In this paper, we design a data transfer protocol that can support two types of vehicular services. In the first type of service, a driver is able to issue a query to determine the traffic condition of a certain road segment ahead of himself. Such information allows him to make decision whether or not he wants to take an alternate route to reach his destination. The second type of application we want to support is the data transfer between roadside entities. The difference between these two types of applications is that we have query/response transactions in the first type of application but the second type of application is merely a data delivery transaction. We refer to the first type of the application as the Traffic Monitor Application (TMA) and the second type of application as the Roadside Message Transfer Application (RMTA).
A good data dissemination algorithm must address the unique characteristics of the network in which it will operate. Some unique characteristics of a vehicle-to-vehicle (V2V) network [9] include: (1) constrained movement, largely due to fix roadway geometry, (ii) rapidly changing topology due to high mobility, (iii) frequent partition due to the high mobility speeds and the number of vehicles that support V2V communications, (iv no significant power constraints, (v) unreliable communication channels. These properties make VANETs different and affect the design of data delivery protocols for such networks. Much work on the intelligent vehicular system (ITS) focus on designing protocols for collision warning systems in a VANET [6],[7],[8]. The collision warning system designed in [8] computes the time to collision (TTC) and the time to avoidance (TTA) using relative vehicular velocity and location information. A warning is issued to other vehicles if the TTC is less than TTA plus a tunable constant. In the Vehicular Collision Warning Communication (VCWC) protocol designed in [7], the authors adjust the transmission rate of emergency warning messages so that such warning messages do not overwhelm a VANET. These papers deal more with disseminating emergency warning messages to vehicles and do not support applications that use query/response type of transactions. The two most relevant papers to our work are [4],and [5]. In [4], the authors describe an information transfer protocol called VITP for vehicular computing. VITP allows users to issue location-aware requests to obtain traffic information ahead of the drivers. VITP provides syntaxes that allow users to set return conditions of their issued queries e.g. return the average speed of 10 vehicles which are 500 m ahead of a driving vehicle. We will describe the data transfer protocol used in [4] in more details when we discuss the data transfer protocol we design in Section 4. In [5], the authors propose several protocols to allow roadside entities to use passing by vehicles as relaying nodes to transfer messages between them. The main feature of their protocols is to use a single hop data transfer approach. The source selects a nearby node as a relay node. The relay node will carry the transferred messages until it reaches a location that is within the transmission range of the destination. The different protocols described in [5] only differ in how the nodes who hear the solicit message from the source respond so that with high probability a higher priority node will send its
3. Problem Statement
For TMA, the information requested by the driver of a vehicle can be computed out of the data available on vehicles and roadside facilities located in the road segments specified by the driver e.g. the traffic flow on a road segment can be derived by estimating the average speed of vehicles moving in that road segment for a short period of time. To derive such information, the user’s inquiries need to be translated into a series of location-sensitive queries. Each of these queries should be forwarded to the desired location of interest via the vehicular adhoc network. Upon arrival at its destination area, the vehicles in the relevant area must collaborate to generate relevant replies. The reply from each vehicle needs to be aggregated hop by hop as the reply traverses back to the querying node. The querying node will have to do the final computation. For RMTA, the source needs to find an appropriate forwarder. Each intermediate forwarder in turns need to find an appropriate next hop node to carry the messages to the final destination. A trade-off can be made between using more hops (and hence each node may end up spending more energy) or incurring more delay for delivering a message. We argue that since there is no tight energy constraint in vehicles, a multihop approach is more useful. To design a vehicular infrastructure that is capable of supporting TMA and RMTA, we need to have (a) a vehicular information transfer protocol, (b), a lightweight software component that implements the message syntax for query/response transactions and the information transfer protocol, (c) the location encoding scheme to allow users to specify their location-aware queries. The message syntax defined in VITP [5] can meet our needs so we intend to use
a modified version of this VITP syntax to support both TMA and RMTA. We, however, do not use the VITP for data transfer. Instead, we will be using a scheme we design called Robust Data Transfer Protocol (RDTP) for both applications. We will elaborate on the differences between VITP and RDTP in Section 4.
4. Robust Data Transfer Protocol (RDTP)
In this section, we describe the data transfer protocol we design for supporting TSA and RMTA. We refer to our scheme as the robust data transfer protocol (RDTP). First, we use two scenarios to illustrate how RDTP works. Then, we provide some pseudo codes for RDTP.
4.1 Traffic Monitoring Scenario
Figure 1: Source issuing location-aware query
In Figure 1, we use a TMA scenario to explain the robust data transfer protocol we design and discuss how it differs from VITP [4]. We first describe how VITP works in a TMA scenario before we describe how RDTP works. In Figure 1, the source, src, broadcasts a query message to find the average speed of the vehicles in the query region. In VITP, this query message will be delivered via geographical routing protocol towards the query region. It is assumed that every node running VITP periodically issues a beacon announcing its location and speed. Based on the beacons heard, each node can maintain a neighbor list. Thus, a node that relays a query knows how to pick the next node to relay the query. Once the query reaches the query region, each node inside the query region that hears such a query will compute an average speed estimate based on the average speed, the counter value in the received query and its own speed information. If this node happens to be the first node in the query region that receives the new query, then it merely enters its own speed, and sets the counter value to one. Each intermediate node will pick another node in the query region to forward this query as long as the counter limit is not exceeded. Once the counter value reaches the count limit set in the original query, the last node that receives this query will generate a reply. This reply will be relayed back to the node that issues the query. Since the querying node may have moved during this period, one may have to use flooding to deliver the query reply once the reply has reached an area closer to where the querying node is originally thought to be located.
In RDTP, the source sets a timer to wait for the replies after issuing a query message. This timer is set to Time_Per_Hop*2*Max_Hops where Time_Per_hop is the time taken to transmit a query by one hop and Max_Hops is the number of hops the source expects it takes for the query to reach the end of the query region. Each node that receives a query message checks to see if it needs to forward the query. For example, in Figure 1, nodes 1,2,3 and 4 receive a query message from the source, src. However, node 4 will discard the query since it is farther away from the query region than its parent (the node from which it hears the query). Node 3 also discards the query since it is traveling in the opposite direction to the querying node. So, only nodes 1 and 2 will forward the query. They each sends a short reply to the source to indicate that the source is their parents. Then, they each updates the TTL in the query packet and starts a timer which is equal to Time_Per_Hop*2*(Max_Hops-TTL+1) to wait for a query reply. Such settings allow the timer at nodes 1 & 2 to expire before their parent node. In addition, they record who their parent (the node from which they first hear the query) is. Each node will only relay the query that it has heard the first time. Each node within the query region that receives the query will make a note that it needs to include its own information and process any query reply it will receive in the future. Such query forwarding continues until the query reaches some nodes that are near the end of the query region e.g. node 11. Nodes in the end zone (within a distance d=k*transmission_range of the end of the query region where k is set to 0.6) will generate a reply immediately to their parents after receiving the query. Other intermediate nodes will generate a reply only if reply timer expires or upon receiving replies from all children. We explain in Figure 2 how this takes place using the example we show in Figure 1.
Figure 2: Query Response aggregated by parent nodes
Node 11 will generate a reply immediately after receiving the query since node 11 is in the end zone. When node 9 receives the reply from node 11 (as shown in Figure 2) node 9 will add its own speed, recompute the average speed, increment a counter before sending back the updated message to its parent. Node 7 may hear node 9’s reply but since node 9’s reply is unicasted to its parent which is node 8, node 7 will not utilize this information. Since each node
has a unique parent, we ensure that each vehicle’s speed information is only utilized once. Eventually, all replies will reach the query node and the query node performs the final computation to get a final answer. To minimize the number of nodes within the query region to be involved in the query reply process, we allow each node in the query region to relay the query probabilistically. That way, not every node within the query region needs to be involved. The trade off is the accuracy of the estimated average speed of vehicles in the query region.
4.2 Roadside Message Transfer Scenario
L
Figure 3: Source solicting data forwarders
In Figure 3, we show two roadside entities separated by a distance of L m. To select a forwarding node, the source (denoted as src in Figure 3) broadcasts a forwarder solicit request message which contains information about the intended destination. Any node that hears this message issues a forwarder solicit response message including information about its own speed and location. The source waits for a certain period of time, denoted as TIMER for replies from all nearby nodes. Then, the source computes a metric that reflects the contact duration it will have with any responding node. Based on this information, the source will select one node as the data forwarder and start sending data messages to that node. In Figure 3, we show that the source selects node 1 as the forwarder. The node selected as the forwarder transmits a data acknowledgement packet periodically. This message not only helps the source to know what messages to retransmit but also allows the source to know when its link with the selected forwarder will be broken. Once the source has lost connectivity with a selected forwarder, the source will repeat the forwarder selection process again. In Figure 4, we show that each forwarder (e.g. nodes 1, 5, 7 and 9) repeats the forwarder selection process to select the next-hop forwarder until the message reaches the destination (denoted as dst).
Figure 4: Multihop forwarding for RMTA The delivery approach in RDTP differs from the data delivery approach used in [5]. In [5], once the source has selected node 1 as the data forwarder, node 1 will travel towards the destination after receiving messages from the source. When node 1 is within the transmission range of the destination e.g. it hears the periodic beacons sent by the destination), then it will deliver the picked up messages to the destination. So, we see that tradeoffs are made to deliver the message faster in RDTP by incurring extra transmissions to deliver the message faster. To reduce the transmission overhead, RDTP allows the vehicles to reply probabilistically to the forwarder solicit messages rather than always reply to such messages.
4.3 Robust Data Transfer Protocol
Figures 5 & 6 show the pseudo codes for source, and the intermediate nodes for the two application scenarios. For the TMA scenario, the source issues a query, sets a timer and waits for the replies. The source sets the maximum number of vehicles’ information, cnt_limt, that it will wait before generating an aggregate average speed estimate. Thus, either the timer expires or enough replies arrive to allow the source to generate an answer. As for intermediate nodes, they will only respond to any query that they receive the first time. In addition, they will check to see if they need to perform any actions upon receiving a new query (e.g. check if they are traveling along the right direction etc). If they need to respond, then, they re-broadcast the TMA_Query_Request, waits to count the number of downstream nodes that consider themselves as parents. If the node that receives a new query happens to be in the end zone, then it will generate a TMA_Query_Response with its own speed and sets cnt to 1. This node will send the response to its parent. Any intermediate node will wait for sufficient number of replies (or the reply timer expires depending whichever happens first) before generating a response back to its parent. For the RMTA scenario, the source issues a forward solicit request. Upon receiving several responses, the source will select an appropriate forwarder (e.g. the one that has the longest contact duration among those nodes who respond). Each intermediate node that carries some messages in turn repeats this forwarder selection process until the message is delivered as shown in the pseudo code in Figure 6.
Figure 5: Pseudo code for TMA
our simulator, once a vehicle leaves the road, a new vehicle enters the road. The speed of the vehicle is chosen uniformly between 10 and 30 m/s (thus the average speed of the vehicles is 20 m/s). The simulation time is set to 500 seconds. The query segment is fixed to 800 m. Each vehicle will respond to the query message with a probability of 0.67. The metrics used for the TMA scenario are (i) response time – this is the average time of a successful query/response transaction, (ii) the dropping rate – this is the percentage of unsuccessful queries, (iii) accuracy – this measures how close the estimated average speed is to the actual average speed of the vehicles in the region of interest, and (iv) efficiency [4] which measures the percentage of the number of exchanged query messages that were actually employed in calculating a result over the total number of query messages exchanged both in routing and inside the target location. The efficiency metric reported in [4] does not include the hello messages sent by the nodes so we include a new metric called control overhead per query. Sections 5.1 discusses the performance of RDTP and VITP as the query distance is varied. Section 5.2 discusses the performance of RDTP and VITP as the vehicle density is varied. For RMTA, we simulate a scenario similar to the one described in [5]. We have a highway of length 5000 m with three lanes. In the first scenario, we vary the speed from 40 mph to 70 mps. In the second scenario, we fix the speed to 55 mph and vary the vehicular density. In both scenarios, we compare our approach with the best approach described in [5]. The metrics we use for RMTA is the achievable throughput and the average message delivery latency. Section 5.4 discusses the performance comparison when we vary the free flow velocity and Section 5.5 discuses the performance comparison when we vary the vehicular density. Since we do not have access to the simulators in [4] & [5], the numbers we report for these protocols are extracted from the plots in their papers.
5.1 Effects of query distance D
Figure 6: Pseudo Code for RMTA
5. Simulation Study
In this section, we first describe the simulation model we implement using ns-2[10]. For TMA, we simulate a scenario similar to what is described in [4]. We use IEEE 802.11 radio with a peak data rate of 11 Mbps in our simulator. The transmission range is set to 250m. Our simulator allows us to change the road length, the average gap distances between vehicles, the number of lanes etc. In
Response Time (sec)
Response Time 0.4 0.3 VITP
0.2
RDTP
0.1 0 0
1000
2000
3000
4000
5000
6000
Query Distance (m)
Figure 7: Response time vs query distance
In Figure 7, we plots the response time versus the query distance for both VITP and RDTP. For the VITP plot, we use the results when the count limit is set at 20. The response time increases with the query distance for
both protocols. The RDTP achieves reasonably good response time compared to VITP. Figure 8 plots the accuracy of the query results for both protocols. Our results indicate that RDTP can achieve similar accuracy as VITP. The key thing to note is that RDTP achieves similar performance results with much lower control overhead (refer to Table 1). Each vehicle only sends forwarder solicit request message when it has been chosen as a forwarder and hence it needs not send hello messages periodically. control overhead (msg/sec) VITP
RDTP
500
750
9.3
1000
750
13.2
2000
750
16.8
3000
750
22.4
4000
750
27.4
5000
750
38
The response time (see Figure 9) increases with the gap for both protocols. Even though the response time for RDTP is slightly higher, but we expect the query success rate for RDTP to be higher than that for VITP. Examining the dropping rates, we find that the forward and backward dropping rates increase with increasing gap distance.
Table 1: Control Overhead for VITP and RDTP
query distance 500 1000 2000 3000 4000 5000
forward dropping VITP RDTP 12 8 18 13 36 15 51 19 61 22 66 28
backward dropping VITP RDTP 1 0 1 1 2 2 3 4 4 5 4 7
Table 2: Dropping rates vs Query Distance Accuracy
Accuracy (%)
Next, we study the impact of vehicular density on the performance of RDTP. In this set of experiment, we fix the query distance to 2000 m and change the vehicle density by changing the gap between consecutive vehicles on the same lane from 50 to 200 m. Table 3 tabulates the forward/backward dropping rates, accuracy of speed estimation and the packet utilization of RDTP and VITP (only for some statistics that are reported in [4]). The results show that the efficiency and the accuracy drop with increasing vehicular gap. The efficiency drop with increasing vehicular gap distance is more significant with VITP than with RDTP.
100 95 90 85 80 75 70
packet utilization Gap (%) between ours vehicles (m) VITP 50 45 29 100 14 23 150 8 15 200 6 12
forward backward Control Overhead dropping dropping accuracy rate (%) rate (%) (%) (msg/sec) VITP ours ours ours ours 1500 20.6 0 0 97 750 16.8 15 2 94 500 13.2 19 3 93 375 9.8 24 4 90
Table 3: RDTP/VITP performance with different gaps. Response Time 0.3 Response Time (sec)
query distance (meter)
5.2 Effects of vehicle density
0.25 0.2 VITP
0.15
RDTP
0.1 0.05 0 0
VITP
50
100
150
200
250
Gap between vehicles(m)
RDTP
Figure 9: Response Time vs Gap between Vehicles 0
1000
2000
3000
4000
5000
6000
Query Distance (m)
Figure 8: Accuracy vs Query Distance Table 2 reports the dropping rates for different query distances. The forward dropping rate corresponds to the fraction of queries that are dropped due to the failure of query delivery while the backward dropping rate corresponds to the fraction of failed queries due to failure of having the query response delivered to the source. From Table 2, we see that both dropping rates increase with query distance for both protocols. RDTP has lower dropping rates than the VITP since RDTP indirectly uses multipath information. The lower dropping rates translate to higher query success rate for RDTP.
5.3 Effect of Free Flow Velocity on RMTA performance
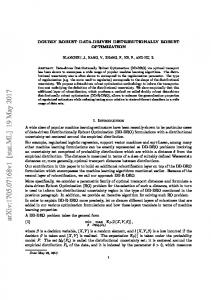
For the first set of experiments on RMTA, we fix the vehicular density to 2000 vehicles/hour and vary the free flow velocity. In Figure 10, we plot the achievable throughput versus free flow velocity for both protocols. Our results show that RDTP can achieve higher throughput than Protocol 3(b) (the best protocol in [5]). Table 4 shows the utilization of both protocols. RDTP achieves higher utilization. We also plot the message delivery latency of both protocols in Figure 11. Our results show that RDTP achieves lower message delivery latency than Protocol 3(b).
Achievable Throughput(Mbps)
Achievable Throughput 6 5 4
Protocol 3(b)
3
RDTP
2 1 0 40
50
60
70
80
Avg Vehicular Speed (mph)
accurate speed estimate and higher query success rate with lower control overhead and response time than VITP. For RMTA, our scheme can achieve higher throughput than what can be achieved with the best scheme reported in [5]. This is just a preliminary work. We are in the process of developing a prototype with our data transfer protocol. In our prototype, we intend to have a voiceactivated proxy that allows a driver to search for an alternate route upon finding congested area. We intend to carry out some field tests around Lehigh campuses. We also intend to add locationbased broadcast messages into our system for business advertisement. Our goal is to design an intelligent transportation system that can benefit local community around our campuses.
Figure 10: Achievable Throughput vs Free Flow Velocity
utilization time RDTP 0.91 0.91 0.9 0.91 0.89 0.85 0.88
Achievable Throughput
protocol 3b 0.95 0.96 0.95 0.98 0.97 0.98 0.97
Achievable Throughput (Mbps)
average velocity (mph) 40 45 50 55 60 65 70
Protocol 3(b) RDTP
0
2000
4000
6000
8000
Vehicles Per Hour
Table 4: Utilization: 2000 vehicles per hour
5.4 Effect of Vehicles Per Hour on RMTA performance
Next, we fix the vehicle speed to 55 mph and vary the traffic levels in the roadway by varying the vehicles per hour. We plot the achievable throughput results for Protocol 3(b) in [5] and RDTP in Figure 12. Again, our results show that RDTP can achieve higher throughput than Protocol 3(b). Message Delivery Latency A vg Msg D elivery Latency(s)
6 5 4 3 2 1 0
Figure 12: Achievable Throughput vs Vehicles/Hour
7. REFERENCES
[1] The FleetNet Project, “www.et2.tu-harbug.ed/fleetnet” [2] http://www.its.dot.gov/index.htm. [3] http://www.leearmstrong.com/DSRC/DSCRHomeset.htm [4] M. D. Kikaiakos etc, “VITP: An information transfer protocol for vehicular computing”, VANET 2005. [5] B. Petit etc, “Protocols for Roadside-to-Roadsie Data Relaying over Vehicular Networks”, Proceedings of IEEE WCNC, April 2006.
300 250 200 150 100 50 0
Protocol 3(b) RDTP
40
50
60
70
80
Avg Vehicular Speed (mph)
Figure 11: Average Message Latency vs Average Vehicular Speed
6. Conclusions
In this paper, we have described a robust data transfer protocol (RDTP) that we have designed to support two types of vehicular services, namely the traffic monitoring and the roadside message transfer applications. Via simulations, we show that our scheme can perform better than two existing schemes that are proposed. For TMA, our approach can provide comparably
[6] H. Wu, R. M. Fujimoto, R. Guensler, M. Hunter, “MDDV: Mobility Centric data Dissemination Algorithm for Vehicular Networks”, ACM workshop on vehicular adhoc networks, Oct, 2004 [7] X. Yang, J. Liu, F. Zhao, N. Vaidya “A Vehicle-to-Vehicle Communicaiton Protocol for Cooperative Collision Warning”, ACM workshop on vehicular adhoc networks, Oct, 2004 [8] R. Miller, Q. Huang, “An adaptive peer-to-peer collision warning system”, IEEE Vehicular Technology Conference (VTC), 2002 [9] J. Tian, K.Rothermel, ”Building large peer-to-peer systems in highly mobile ad hoc networks: New challenges?” Technical Report, University of Stuttgart, 2002. [10] Network simulator ns-2, www.isi.edu/nsname/ns2.