Personalized Features for Attention Detection in Children with Attention Deficit Hyperactivity Disorder Fatemeh Fahimi1, Cuntai Guan, Wooi Boon Goh, Kai Keng Ang, Choon Guan Lim, Tih Shih Lee
Abstract— Measuring attention from electroencephalogram (EEG) has found applications in the treatment of Attention Deficit Hyperactivity Disorder (ADHD). It is of great interest to understand what features in EEG are most representative of attention. Intensive research has been done in the past and it has been proven that frequency band powers and their ratios are effective features in detecting attention. However, there are still unanswered questions, like, what features in EEG are most discriminative between attentive and non-attentive states? Are these features common among all subjects or are they subjectspecific and must be optimized for each subject? Using Mutual Information (MI) to perform subject-specific feature selection on a large data set including 120 ADHD children, we found that besides theta beta ratio (TBR) which is commonly used in attention detection and neurofeedback, the relative beta power and theta/(alpha+beta) (TBAR) are also equally significant and informative for attention detection. Interestingly, we found that the relative theta power (which is also commonly used) may not have sufficient discriminative information itself (it is informative only for 3.26% of ADHD children). We have also demonstrated that although these features (relative beta power, TBR and TBAR) are the most important measures to detect attention on average, different subjects have different set of most discriminative features.
I. INTRODUCTION Attention Deficit Hyperactivity Disorder (ADHD) is a prevalent disease among children and the cause of various life disorders such as social withdrawal, dropping out of school, lack of focus on a particular task and missing details. Besides children, many adults also suffer from attention deficit disorder. Medication and behavior therapy are currently the widely used treatment methods for ADHD [1], each with its advantages and disadvantages. Medication-based methods use stimulants and may create positive effects in a relatively short time but their side effects, especially in the long term, is still unknown. On the other hand, behavior therapy does not have such side effects but takes a longer time to make a noticeable improvement. As a result, long-term methods can
Fatemeh Fahimi, Wooi Boon Goh and Cuntai Guan are with the Nanyang Technological University, 50 Nanyang Avenue, Singapore (emails:
[email protected], aswbgoh @ntu.edu.sg, and
[email protected]). Kai Keng Ang is with the Institute for Infocomm Research, A*STAR, Singapore, (e-mail:
[email protected]). Choon Guan Lim is with the Institute of Mental Health, Singapore (email:
[email protected]) Tih Shih Lee is with the Duke-NUS Graduate Medical School, Singapore (email:
[email protected])
978-1-5090-2809-2/17/$31.00 ©2017 IEEE
cause patients to lose motivation and stop treatment before beneficial results occur. Electroencephalogram (EEG) based neurofeedback has also been widely trialed in various studies where ADHD patients are trying to regulate their EEG rhythms which are related to attention. Research on ADHD has found that quantitative EEG (QEEG) is a beneficial tool in ADHD diagnosis. They reported that ADHD subjects show increased TBR compared to non-ADHD subjects [2, 3]. Besides study on ADHD diagnosis and prognosis, several studies have evaluated the age-related changes of QEEG parameters in ADHD patients, they found that diminution in relative beta activity in ADHD subjects (comparing to normal) is smaller in adults [4]. A comprehensive analysis of QEEG parameters in studying ADHD is presented in [5]. Recently, Brain Computer Interfaces (BCI) based therapy was introduced which is based on attention detection using machine learning methods [6]. Several studies have shown significant improvement in attention symptoms [7-9]. The features that are used in these studies are main band powers from EEG. Following these prior works, we wish to investigate the following questions. What features of EEG describe the difference between attentive and non-attentive states, in other words, what features can be extracted from the EEG signal which can discriminate between the attention and nonattention states? Are these features subject-independent or subject-specific? To this end, we explored the fundamental relationship between EEG and attentive/inattentive behaviors. As we have recorded data from 120 ADHD children based on the same experimental design as in [7], our study is based on a large valuable data set that makes our findings considerably dependable. Our main contribution is discovering the best indicator of attention for ADHD children. Based on our study, we confirm that theta beta ratio (TBR), which has been previously recommended in the literature, is a significant feature in discriminating the attentive and non-attentive states (It is discriminative for 93 subjects on average). Moreover, our results show that the relative beta power and theta/(alpha+beta) (TBAR) are also equally significant (they are informative for 92 subjects on average) while relative theta power doesn’t include discriminative information and has been selected only for 16 subjects. The rest of the paper is organized as follow. A description of the data set and details on feature extraction, feature selection and classification are given in section II. Section III presents the results and thorough discussions. The final
414
TABLE I.
section concludes the study and recommends areas for further research.
Feature
II. MATERIALS AND METHODS A. Data Set The data used in this project are the data collected during Stroop test sessions for the BCI-based attention training program for ADHD treatment as proposed in [7]. The data are recorded using a dry EEG headband with one forehead EEG channel at 256 Hz sampling frequency. Our study utilizes data from 120 ADHD children aged between 6 and 12 years old who have never received stimulant medication. Each participant underwent three sessions of Stroop color test in weeks 0, 4 and 8 from the start of their treatment. Each session consists of 40 trials in which each trial includes two parts: Stroop test (attention) and rest (non-attention). During Stroop test which lasts at least 6 seconds, the name of a random color (red, green, brown or white) is written in a different color of word itself, the question is in which color the word is written. The rest period after each Stroop test has same duration to match. The idea behind the Stroop test is that we read the word faster than recognizing the word color, therefore naming the word color would activate participant’s attention. In other words, the cognitive mechanism involved here is ‘directed attention’: Trying to focus on one aspect although your attention was attracted to another one unconsciously [10]. The protocol of each session is illustrated in Fig. 1. B. Feature Extraction While performing the Stroop task, subjects undergo a change of state from attentive to rest and vice versa. Therefore, we have labeled the resting intervals as nonattention and the question-answer (Q & A) intervals as attention. A two-second sliding window with one second shift has been used to divide EEG into two-second segments. After division, the features of each segment have been extracted. We applied wavelet decomposition method to obtain different frequency bands of EEG. We used ‘Daubechies’ as wavelet function. The sampling frequency of our data was 256 Hz, therefore we needed 8 levels to achieve to 0.5-32 Hz frequency band including delta (0.5-4 Hz), theta (4-8 Hz), alpha (8-16 Hz) and beta (16-32 Hz). After calculating the wavelet coefficients of above mentioned frequency bands using 8 decomposition levels and ‘db8’ as wavelet function, the power of each band is computed. In total, we extracted 7 features as listed in table I, where T in these formulas refers to total power which is defined below:
T
DEFINITION OF FEATURES
Formulation
1
Relative Delta Power
RDP
2
Relative Theta Power
RTP
3
Relative Alpha Power
RAP
4
Relative Beta Power
RBP
5
Theta Beta Ratio
TBR
6
Theta Alpha Ratio
TAR
7
Theta/(Alpha+Beta)
TBAR
T T T T
C. Subjective Feature Selection using Mutual Information Method Considering this fact that brain signal characteristics are different between human beings, we have assumed the most discriminative features are different between subjects and we are testing this hypothesis here. In this paper, we used the method of Mutual Information based Best Individual Feature (MIBIF) for subjective feature election [11]. Consider two random variables X and Y, the Mutual Information (MI) between them is defined as follow [10]:
I ( X ; Y ) H (Y ) H (Y | X ) Where
H refers to Entropy and is defined as:
H ( X ) p( x) log 2 p( x) xX
H (Y | X ) p ( x, y ) log 2 p ( y | x ) xX yY
In above formulas, p (.) is probability function. If we define F as input features with n dimensions and C as the set of classes with m number of classes, MI between them is:
I ( F ; C ) H (C ) H (C | F )
Where the conditional entropy is:
f n cm H (C | F ) p(c | f ) log 2 p(c | f ) f f1 cc1
To estimate p(c | f ) , the method of Parzen window has been used [14]. Based on the MIBIF algorithm, features with maximum mutual information with output class would be selected. Consider SF as the set of selected features, then:
Figure 1. Recording Protocol
415
SF fi | I ( fi ; C ) max I ( f ; C) fiF , j 1..n i
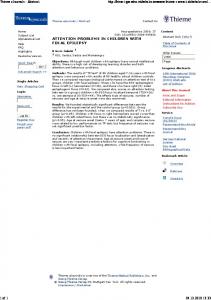
Let’s define s as the number of features to be selected among n available attributes, this parameter would be determined by user. In this work, we select a 4-feature subset of the 7 generated features for every subject. Fig. 2 illustrates the accuracy versus number of selected features. As can be seen, the maximum accuracy occurs in 4-feature subset. D. Classification Data for each subject involves 3 sessions of Stroop test in which each session consists of 40 trials of Stroop and rest. After division of EEG into 2-second segments (with 1-second overlap), there are 400 samples in every session which 200 samples belong to the attention class and 200 samples are of the non-attention class. We extracted 7 features (relative Delta, Theta, Alpha and Beta power, TBR, TAR and TBAR) for each sample. Then, linear discriminant analysis (LDA) was used for classification with 20-fold cross validation approach to divide samples into train and test parts. Classification has been performed on several groups of features as defined in table II. III.
Figure 2. Accuracy vs. Number of Selected Features TABLE II.
No.
RESULTS AND DISCUSSION
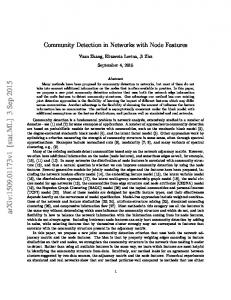
A. Accuracy versus Features Table III shows the classification results using above mentioned sets of features. As can be seen, using only ratio powers (TBR, TAR and TBAR) produces the lowest accuracy compared to the results of other groups of features. The second lowest results belong to relative powers. In this case, along with the relatively low accuracy, the standard deviation in session 2 is not acceptable. It shows that a combination of relative and ratio powers carries discriminative information, and not simply relative or ratio powers alone. The outcomes of all 7 generated features and 4 subjectspecific features are both significant although subject-specific features produced better results. This confirms our assumption in the previous paragraph that discriminative features exist in a combination of relative and ratio powers. It also demonstrates that only a 4-feature subset involves all the information relevant to attention detection. Therefore, as we strive to find the procedures with lower computational load and higher speed, reducing the dimension in a way that leads to equivalent or better results is important. This becomes even more significant in practical applications, since it enables us to find the most effective and discriminative features (based on the intended task) for each subject. We can then use this optimal subset of features instead of all features thereafter. It is also worth mentioning that some features contain irrelevant information regarding a specific task which may cause misclassification. Thus, removing these features from computations would be useful. B. Personalized Features Fig. 3 shows the histogram of the number of times that a feature has been selected as one of the four most discriminative features (regardless of first, second, third or fourth choice).
1. 2. 3. 4. 5. 6.
Group Name All TBR TAR TBAR Ratio Relative
7.
Selected
DEFINITION OF GROUPS OF FEATURES USED FORCLASSIFICATION PURPOSE
Description Including all 7 features listed in Table I Theta beta ratio Theta alpha ratio Theta/(alpha+beta) Including TBR, TAR, TBAR Including relative delta, theta, alpha and beta power 4-feature subset selected by MI
TBR, relative beta power and TBAR have been selected as the most effective features for 93, 92 and 92 ADHD subjects respectively (on average). It shows that in addition to TBR, the relative beta power and TBAR are significant to distinguish between the attentive and non-attentive states for many ADHD subjects. The fourth discriminative feature is relative delta power (selected as one of four features for 70 subjects on average). Another interesting point which can be derived from Fig. 3 is that the relative theta power doesn’t have discriminative information itself. It is informative only for a few subjects (16 subjects on average), mostly as their fourth choice. It’s important to note that although TBR, relative beta power and TBAR have been selected as best indicators of attention for most subjects, the number of relative delta power, relative alpha power and TAR is non-trivial. It indicates that these features are representative for attention detection for some subjects. C. Robustness of Subject-specific Features To investigate whether the selected features for each subject are robust, we performed cross-session classification. In this case, selected features from one session have been used to test two other sessions. Table IV presents the results. The small observed difference between within-session (in which feature selection is done for each session separately) and cross-session results demonstrates the robustness of subject-specific features.
416
D. Common Features versus Subject-specific Features To understand whether using a common subset of features (based on average features selected) performs better than subject-specific features, we repeated classification using relative beta power, TBR, TBAR and relative delta power for all subjects. Table V shows these results. We applied paired t-test to evaluate the results, providing small pvalues less than 0.001, confirming that the observed difference is significant. TABLE III.
CLASSIFICATION ACCURACY USING DIFFERENT GROUPS OF FEATURES
Session 1
Session 2
Session 3
All TBR
65.42(8.14) 60.57(7.14)
63.77(7.55) 58.84(7.59)
63.07(7.52) 58.86(6.93)
TAR
60.07(7.13)
57.33(15.39)
58.26(6.82)
TBAR
61.40(7.20)
59.78(7.09)
59.6(6.87)
Ratio
61.39(7.18)
59.94(7.13)
59.59(6.77)
Relative
64.86(7.81)
62.16(15.34)
62.72(7.20)
Selected
65.55(7.83)
63.94(7.33)
63.60(7.25)
IV.
In this paper, we studied 120 ADHD children to find the most discriminative features between the attention and nonattention states in a subject-specific feature selection approach. As further research, we will investigate the changes in EEG features over calibrations to assess the performance of BCI-based treatment and to find out the correlations between EEG characteristics and signs of recovery based on the reports filled by parents or clinicians. ACKNOWLEDGMENT The Authors would like to thank Mr Chuanchu Wang for preparing the EEG data and Mr Siavash Sakhavi. REFERENCES [1]
[2]
[3]
[4]
[5] [6] Figure 3. The number of times features selected over Session 1, 2 and 3. [7] TABLE IV.
CROSS-SESSION VS. WITHIN -SESSION RESULTS
Session 1
Cross-session
Train on Session 1
-
Session 2
Session 3
62.59
61.94
Train on Session 2
64.07
-
62.08
Train on Session 3
64.37
62.46
-
Average
64.22
62.53
62.01
Within-session
65.42
63.77
63.07
TABLE V.
COMMON SUBSET OF FEATURES VS. SUBJECT -SPECIFIC FEATURES RESULTS
Session 1
Session 2
Session 3
Subject-specific features
65.55(7.83)
63.94(7.33)
63.60(7.25)
Common 4-feature
64.92(8.12)
63.42(7.33)
62.82(7.67)