both the proposed texture and object features to ensure that all attended pixels ... terward, Treisman [4] combined both the early and late selection theories into a ...
JOURNAL OF INFORMATION SCIENCE AND ENGINEERING 26, 1657-1675 (2010)
Visual Attention Region Detection Using Texture and Object Features* HSUAN-YING CHEN AND JIN-JANG LEOU Department of Computer Science and Information Engineering National Chung Cheng University Chiayi, 621 Taiwan Human perception tends to firstly pick attended regions, which correspond to prominent objects in an image. Visual attention region detection simulates the behavior of the human visual system (HVS) and detects regions of interest (ROIs) in the image. In this study, a visual attention region detection approach using low-level texture and object features is proposed. The new and improved (shifted) functions are proposed and used in both the proposed texture and object features to ensure that all attended pixels will be extracted. The proposed approach can generate high-quality spatial saliency maps in an effective manner. As compared with three existing approaches, including Stentiford’s, Zhai/ Shah’s, and Park/Moon’s approaches, the proposed approach has a better performance of extracting ROIs in images and low computational complexity. Keywords: visual attention, saliency map, regions of interest (ROIs), feature extraction, multi-scaled model
1. INTRODUCTION A meaningful and effective image representation is very important in various research fields, such as multimedia processing and content-based image retrieval. The movement of eyes over an image at the first sight draws the outline of regions of interest (ROIs) in the image. The ROIs of an image can be utilized to obtain better performance in some image/video processing procedure, such as feature extraction in image retrieval. Additionally, the computational complexity of some image/video processing procedure can be reduced if ROIs and non-ROIs of an image are well detected. Human perception tends to firstly pick attended regions, which correspond to prominent objects in an image. Visual attention region detection, different to edge detection or image segmentation, extracts few attended regions (not just the edges) with precise object positions and rough object shapes from an image. Visual attention simulates the behavior of the human visual system (HVS) by generating saliency maps of the target image and detects ROIs in the image, which are attractive to image viewers at the first sight. The HVS organizes scattered external visual signals into reasonable and meaningful perceptions. James [1] suggested that visual attention may be driven by both a top-down process and a bottom-up process. Visual attention involved in the top-down process is volition-controlled by both external and internal stimuli, such as pattern or object. The bottom-up process is saliency-driven by external stimuli, especially in the contrasts of luminance, color, edge, and orientation. Broadbent [2] proposed the attention filter theory. Received September 22, 2008; revised December 30, 2008 & April 21, 2009; accepted April 30, 2009. Communicated by Tong-Yee Lee. * This work was supported in part by the National Science Council of Taiwan, R.O.C. under Grants No. NSC 95-2221-E-194-020-MY3 and NSC 96-2221-E-194-033-MY3.
1657
1658
HSUAN-YING CHEN AND JIN-JANG LEOU
Because the ability of the perceptual system is limited and not all visual signals are important for primates, external visual signals should be selected by the perceptual system. Attention here is a filter between sensory registration and perception analysis, i.e., it can be treated as a limited capacity channel. Visual signals will be processed, recognized, and stored by further perceptual analysis if they get across the filter. The timing of attention selection in this case is before the moment that visual signals are recognized by the perceptual system, i.e., attention selection is in front of the processing. Thus, the attention filter theory of Broadbent is a type of early selection. On the contrary, Deutsch [3] proposed the late selection theory, i.e., attention selection works with the perceptual system, because a part of external visual signals involve in further perceptual analysis. Afterward, Treisman [4] combined both the early and late selection theories into a feature integration theory (FIT) model. To design a robust computational model, visual attention may be driven by both top-down (volition-controlled) and bottom-up (saliency-driven) mechanisms. In the topdown mechanism, perception processing of human brain will intervene between the computational model and external visual signals, namely, internal stimuli. Internal stimuli (knowledge), such as face/skin detection or pattern recognition, are crucial for what features are selected in external visual signals. Lee et al. [5] modeled the selective attention guided by top-down internal facial stimuli, which is dynamically integrated with external information. The integration map is then generated by an interactive activation rule and formalism development for interactive spiking neural networks (ISNN). Lu et al. [6] claimed that the top-down control plays an important role on the shift and distribution of visual attention. Their perceptual quality significance map (PQSM) reflects the processing ability of the human brain on local visual contents statistically. Several other approaches [7-9] also used the top-down mechanism. The bottom-up mechanism computes particular external visual signals as features, which are then used to set up the saliency map. The bottom-up mechanism can reduce the computational complexity and extract attended regions exactly. Based on the biologically plausible architecture of Koch and Ullman [10], Itti et al. [11] proposed a visual attention model using intensity, color, and orientation features. The linear “center-surround” operation is implemented on multi-scaled feature images, which are created using dyadic Gaussian pyramids. After normalization, all feature maps are combined into a final saliency map. To detect attended locations in an image, a two-dimensional (2D) winnertake-all strategy is used. They offered a basis for computational visual attention model. For the model proposed in Stentiford [12], a pixel will be highlighted if the pixel identity and its neighboring area are inconsistent. That is, similar identities in neighboring area are inhibited. Ma and Zhang [13] proposed an approach to obtain the saliency map using contrast analysis and developed a fuzzy growing technique in the visual attention model to extract attended regions from the saliency map. Meur et al. [14] obtained perceptual sub-band decompositions using the cortex transform and selected relevant information on account of the perception concept in visual attention detection. The contrast sensitivity function (CSF) is used to determine the visual significances of sub-band decomposition images. Zhai and Shah [15] proposed an algorithm having a linear computational complexity with regard to the image size and used the color histogram of an image to create its saliency map. Park and Moon [16] proposed a reference map created by integrating feature maps, and a combination map representing the boundaries of meaningful objects
VISUAL ATTENTION REGION DETECTION USING LOW-LEVEL FEATURES
1659
is created by integrating the reference map and feature maps. A visual attention model is very practical in various research fields, such as image/video compression [17-21], video summarization [22], visual surveillance [23, 24], scene classification [25], and content recomposition [26]. In this study, a visual attention region detection approach using low-level texture and object features is proposed, in which the bottom-up mechanism is employed. For the texture feature, high-quality spatial texture saliency maps will be generated in an effective manner. For the object feature, both the contour and the region inside an object can be extracted simultaneously. To ensure all attended pixels are accurately and efficiently detected, the new and improved (shifted) functions are proposed. The final saliency map of an image is generated by extracted texture and object features. This paper is organized as follows. Related works are briefly described in section 2. The proposed approach is addressed in section 3. Experimental results are described in section 4, followed by concluding remarks.
2. RELATED WORKS Stentiford [12] proposed a model, which highlights the pixels when the pixel identities and neighboring area identities are inconsistent. “Identity consistent” in Stentiford’s model means that structures of neighboring pixels and equivalent positional structure of another randomly selected pixel in neighborhoods are alike. That is, if the identities in both the pixel and neighboring area are consistent, the attention value of the pixel will be inhibited. For a set a = (a1, a2, a3) with the location x = (x1, x2), a function F can be defined such that a = F(x). Consider a neighboring area Z of x where {x′ ∈ Z iff |xi − xi′| < ε, i = 1, 2}. Select a set of m random points Sx in Z, where Sx = {x1′, x2′, x3′, …, xm′}. Select location y in neighborhoods where the set Sy = {y1′, y2′, y3′, …, ym′}, x − xj′ = y − yj′, j = 1, …, m. The structure of neighboring pixels of x is said to match that of y if |F(x) − F(y)| < δ,
(1)
|F(xj′) − F(yj′)| < δ, ∀j.
(2)
and
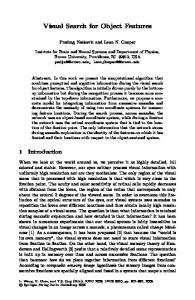
It is assumed that there are t pixels in neighborhoods, the pixel x will be worthy of attention if it matches only a small number pixels of neighborhoods. Stentiford’s model is processed in the RGB space, F(x′) = a = (r, g, b), t = 100, m = 2, ε = 2, and δ = 80. A pixel is displayed as a dark color in the saliency map if the matching number of the pixel is greater than the threshold, and vice versa. According to some observations, this model presents local visual attention (compared with neighborhoods) and the visual effect is similar to that of edge detection. As the illustrated image shown in Fig. 1 (a), based on the same reason, the pixels which are unattractive to image reviewers, such as the region marked in Fig. 1 (b), may have high attention values using Stentiford’s model. Zhai and Shah [15] proposed an algorithm having a linear computational complexity with regard to the image size and used the color histogram of the image to create its
HSUAN-YING CHEN AND JIN-JANG LEOU
1660
(a) (b) (c) (d) Fig. 1. (a) The original image; (b)-(d) The corresponding saliency maps of Stentiford’s model, Zhai and Shah’s model, and Park and Moon’s model.
saliency map. The color statistics of images are used to construct an efficient model for computing the corresponding spatial saliency maps. The attention value of a pixel k in an image I (a component image of the RGB color space) is defined as SalS ( k ) =
∑ ||I k − Ii ||,
(3)
∀I i ∈I
where || ⋅ || represent the distance between two pixel values and the values of Ik and Ii are in the range of [0, 255]. SalS ( k ) = ∑ ||I k − I i || can be expanded as ∀I i ∈I
SalS(k) = ||Ik − I1|| + ||Ik − I2|| + … + ||Ik − IN||,
(4)
where N is the total number of pixels in the image. SalS(k) can be restructured again because the value of each pixel Ii in an input image is known and the terms with the same Ii can be rearranged to be together as 255
SalS (k ) = ∑ f n ||I k − n||,
(5)
n =0
where fn is the frequency of pixel value n in the image. Since n ∈ [0, 255], the distance ||Ik − n|| is also bounded in the range of [0, 255]. The saliency map of the original image shown in Fig. 1 (a) for Zhai and Shah’s model is shown in Fig. 1 (c). Park and Moon [16] proposed a reference map created by integrating feature maps, and a combination map representing the meaningful objects that is created by integrating the reference map and feature maps. The edge feature maps are created by 24
F1/β ( x, y ) = (∑ |I1/β ( x, y ) − N i |)/24, β = {2, 3, 4},
(6)
i =1
where β is the scaling factor, I1/β is the edge image by applying the Sobel edge operator to each resized image, i denotes the index of neighborhood pixels. The representative edge map is calculated by 4
RFM Edge = ( ∑ N ( F1/Edge β ))/3, β =2
(7)
VISUAL ATTENTION REGION DETECTION USING LOW-LEVEL FEATURES
1661
is created by Eq. (6) and N(•) represents a normalization of image into 1/4 where F1/Edge β size. Then, the representative CbCr map in the YCbCr color system and the representative H map in the HSV color system are constructed by 4
4
β =2
β =2
Cr RFM CbCr = (( ∑ N ( F1/Cb β ))/3 + ( ∑ N ( F1/β ))/3)/2,
(8)
4
RFM H = ( ∑ N ( F1/Hβ ))/3.
(9)
β =2
The reference map is calculated by RM = (((RFMEdge ⊕ RFMCbCr)/2) ⊕ ((RFMEdge ⊕ RFMH)/2))/2,
(10)
where ⊕ denotes an operator combining two feature maps. Finally, the combination map is constructed by RM = (MRFMEdge + MRFMCbCr + MRFMH)/3,
(11)
where
⎧ RFM ( x, y ), if RFM ( x, y ) ≠ 0 and RM ( x, y ) ≠ 0, MRFM ( x, y ) = ⎨ ⎩α RFM ( x, y ), otherwise,
(12)
and α denotes a weighting factor between 0 and 1. After denoising and resizing to the size of the original image, the saliency map of Zhai and Shah’s model for the original image shown in Fig. 1 (a) is shown in Fig. 1 (d). As shown in Figs. 1 (b)-(d), Stentiford’s model, Zhai and Shah’s model, and Park and Moon’s model may extract many noisy parts from muddy surroundings, such as grasses and sprays. Additionally, the saliency map of Stentiford’s model has the visual effect similar to that of edge detection. Note that, different to either edge detection or image segmentation, visual attention detection mainly extracts few attended regions with precise object positions and rough object shapes from an image. Visual attention simulates the behavior of the human visual system (HVS) by generating saliency maps of the target image and detects regions of interest (ROIs) in the image, which are attractive to viewers.
3. PROPOSED APPROACH In this study, to extract ROIs, standard deviation representation and color contrast of image blocks are used. Regions with distinctive features in an image, such as that shown in Fig. 2 (a), will be detected by the proposed approach, whereas “noisy” regions in an image, such as that shown in Fig. 2 (b), will not detected by the proposed approach. 3.1 Proposed Visual Attention Texture Model In this study, a new visual attention texture model is proposed to improve its com-
HSUAN-YING CHEN AND JIN-JANG LEOU
1662
… (a) Distinctive regions.
… (b) Noisy regions. Fig. 2. Some blocks with high standard deviations.
putational complexity so that the high-quality spatial texture saliency map of an image can be generated in an effective manner. The contrast image I of size W × H obtained from a corresponding contrast visual signal (here intensity) is partitioned into image blocks Bi,j of size w × h. Then for the standard deviation representation map I′, each image block can be expressed by its modified standard deviation:
⎧⎪σ i, j − TH i , j , if σ i, j > TH i , j , otherwise, ⎪⎩ 0,
σ i,′ j = ⎨
(13)
where the standard deviation σi,j is given by w −1 h −1
σ i, j = ( ∑
∑ ( Bi, j ( x, y) − μi, j )2 )/( w × h),
(14)
x =0 y =0
and μi,j is defined as w−1 h −1
μi , j = [ ∑ ∑ Bi , j ( x, y )]/( w × h),
(15)
x =0 y =0
(i, j) is the block index and THi,j is a saliency threshold determined by the just noticeable difference (JND) model [27]. Note that the JND provides a visibility threshold of difference, which is employed to reduce perceptual redundancy. The saliency threshold THi,j, an important factor, represents the visual sensitivity, which will be determined by the modified JND model here. In this study, the modified JND is given by ⎧⎪TH ⋅ (1 − μi , j /127) + 10, if μi , j ≤ 127, TH i , j = ⎨ otherwise, ⎪⎩ γ ⋅ ( μi , j /127) + 10,
(16)
where TH and γ are set to 17 and 3/128, respectively (determined in [27]). Here, μi,j is treated as the background in JND model and the saliency threshold THi,j can be calculated by Eq. (16). σi,j is treated as the difference between the foreground and the background in JND model. An image block having higher standard deviation may contain dis-
VISUAL ATTENTION REGION DETECTION USING LOW-LEVEL FEATURES
1663
tinctive features, which will attract more attention, and vice versa. Additionally, I′ can be normalized as T(x, y) = I′(x, y) × 255/Max,
(17)
where (x, y) is the coordinate of the map and Max is the maximum value in I′. Note that T(x, y) lies within the range (0, 255). Though the regions with distinctive features can be extracted, noisy regions having high standard deviations but without distinctive features (as the illustrated examples shown in Fig. 2 (b)) may also be detected. To cope with this problem, the color contrast image is used to retrieve visual attention regions (objects) from muddy surroundings. In human primary visual cortex [28], the color pairs, such as red/green and blue/yellow, contain chromatic opponency. In cortex, neurons are excited by one color and inhibited by another color, namely, the color double-opponent. The difference between two opponent color images can help to reduce (smooth) noises more or less in muddy surroundings since colors in nature are rarely pure red, pure green, or pure blue. As the illustrated example shown in Fig. 3, for an 8 × 8 color image block within muddy surroundings shown in Fig. 3 (a), the corresponding color image block (the difference image block between the red and green component blocks) is shown in Fig. 3 (d), which has a low standard deviation, as compared with that of the original color image block. Thus, in this study, the color contrast image is used to remove “noisy regions” having high standard deviations but without distinctive features.
(a) (b) (c) (d) Fig. 3. An 8 × 8 color image block within muddy surroundings; (a) The color image block; (b) The red component image block (σ = 49.07, μ = 131.48); (c) The green component image block (σ = 49.09, μ = 104.20); (d) The color contrast image block (σ = 1.29, μ = 20.92).
Based on the visual attention model by Itti [11], the intensity contrast image II is defined as II = (r + g + b)/3,
(18)
where r, g, and b are the red, green, and blue components of the original image, respectively. Two color contrast images include IRG and IBY, where IRG is the difference image between R and G, and IBY is the difference image between B and Y, i.e., R = r − ( g + b)/2, G = g − (r + b)/2, B = b − (r + g )/2, Y = (r + g )/2 − |r − g |/2 − b.
(19)
HSUAN-YING CHEN AND JIN-JANG LEOU
1664
The proposed texture method is then applied on the three contrast images, namely, II, IRG, and IBY to obtain the three texture saliency maps TI, TRG, and TBY, respectively. Fig. 4 shows the framework of the proposed texture model, in which the color-texture saliency map TC is composed of the RG-texture map TRG and the BY-texture map TBY. After obtaining the intensity-texture and the color-texture saliency maps, namely, TI and TC, of an image, the texture saliency map TT of the image is obtained by linear combination of TI and TC, i.e., TT = (TI + TC)/2.
Fig. 4. The framework of the proposed visual attention texture model.
(20)
Fig. 5. The framework of the proposed multiscaled visual attention object model.
VISUAL ATTENTION REGION DETECTION USING LOW-LEVEL FEATURES
1665
(c) The object-saliency map OO. (a) The original image. (b) The texture-saliency map TT. Fig. 6. The proposed visual attention approach.
3.2 Proposed Multi-Scaled Visual Attention Object Model The proposed multi-scaled visual attention object model is shown in Fig. 5. Although the texture saliency map can detect the ROIs in an image, as an illustrated example shown in Fig. 6 (b), the texture saliency map contains almost edge features (parts) of the ROIs in the original image. The inner parts of the ROIs in the original image are not necessarily textural. In this study, to cope with this problem, a multi-scaled visual attention object model is proposed to extract the inner parts of the ROIs in the image. Then, the proposed texture and object models are combined to constitute the final saliency map. The proposed multi-scaled visual attention object model is similar to the proposed texture model with two consequent steps. First, the contrast image I is transformed into multi-scaled contrast images by multi-scaled down-sampling with a factor of 2 before the standard deviation representation computation. For example, if the scale s is set to 3, the three multi-scaled contrast images are I0, I1, and I2. The multi-scaled contrast images Il are obtained as 2l −1 2l −1
I (i, j ) = (1/(2 ⋅ 2 )) ⋅ ∑ l
l
l
∑ I (2l ⋅ i + x, 2l ⋅ j + y),
(21)
x =0 y =0
where l, i, j, x, and y are integers with 0 ≤ l < s, 0 ≤ i < W/2l, 0 ≤ j < H/2l, 0 ≤ x ≤ 2l − 1, 0 ≤ y ≤ 2l − 1. Each of the multi-scaled images Il (containing (W/w ⋅ 2l) × (H/h ⋅ 2l) image blocks) is processed by the proposed texture model to obtain the corresponding texture saliency maps Tl. Then, the multi-scaled texture saliency maps Il are reversely up-sampled to the same size of the original image, namely, El. The object combination map O is linearly combined by s −1
O = ∑ (1/s ) ⋅ E l .
(22)
l =0
The object model is identically applied on the three contrast images, II, IRG, and IBY, to obtain the three object saliency maps, OI, ORG, and OBY, respectively. The color-object saliency map OC is linearly composed of the RG-object and BY-object combination
HSUAN-YING CHEN AND JIN-JANG LEOU
1666
(a)
(b)
(c)
(d)
(e)
(f) (g) (h) (i) (j) Fig. 7. Comparison of multi-scaled object saliency maps in the proposed multi-scaled visual attention object model; (a) The original image; (b)-(d) The intensity-object saliency maps OI with the scale s = 1, 2, and 3, respectively; (e)-(g) The color-object saliency maps OC with the scale s = 1, 2, and 3, respectively; (h)-(j) The object saliency maps OO with the scale s = 1, 2, and 3, respectively.
(a) The original and subsampling images.
T0 of II
+
T1 of II
(upsampling) = OI
(b) T0 and T1 of II and the combined intensity-object saliency map OI.
T0 of IRG
+
T1 of IRG
(upsampling) = ORG
(c) T0 and T1 of IRG and the combined RG color-object saliency map ORG.
T0 of IBY
+
T1 of IBY
(upsampling) = OBY
(d) T0 and T1 of IBY and the combined BY color-object saliency map OBY. Fig. 8. Details of multi-scaled object saliency maps for an image with the scale s = 2.
VISUAL ATTENTION REGION DETECTION USING LOW-LEVEL FEATURES
(e) The color-object saliency map OC.
1667
(f) The object saliency map OO.
Fig. 8. (Cont’d) Details of multi-scaled object saliency maps for an image with the scale s = 2.
maps, ORG and OBY. After obtaining the intensity-object and color-object saliency maps, OI and OC, OI and OC are linearly combined to constitute the object saliency map OO. Therefore, as an illustrated example shown in Fig. 6 (c), a noise-free saliency map can be generated in an effective manner by means of the multi-scaled function and the inner parts of saliency objects (ROIs) are extracted by the object model. Fig. 7 shows the intensity-object saliency maps and the color-object saliency maps of an image with the scale s = 1, 2, and 3, respectively, whereas Fig. 8 shows the details of multi-scaled object saliency maps for an image with the scale s = 2. 3.3 Improved Saliency Map In this study, the intensity contrast image II is defined as Eq. (18), IRG is the difference image between R and G, and IBY is the difference image between B and Y. To reduce the computational complexity and enhance the color contrast of the proposed approach, color contrast images R, G, B, and Y are simply re-defined as R = 2r, G = 2g, B = 2b, Y = r + g.
(23)
As an illustrated example shown in Fig. 9, the color-object saliency map of the proposed approach (lower computational complexity) is better than that of Itti’s model.
(a) (b) (c) Fig. 9. Color-object saliency maps OC using different color models; (a) The original image; (b)-(c) The color-object saliency maps OC using Itti’s color model and the proposed approach, respectively.
(a) The image block position diagram of T.
(b) The “shifted” image block position diagram of Ts and the red square is the position of the “shrunk” saliency map Ts′. Fig. 10. Two types of image block position diagrams.
1668
HSUAN-YING CHEN AND JIN-JANG LEOU
Based on the experiments in this study, it is found that a saliency pixel may not be detected by the standard deviation representation scheme if it lies on the boundary of an image block. To cope with this problem, a modified (“shifted”) standard deviation representation scheme is proposed. As shown in Fig. 10, based on the original image block position diagram, the contrast image I can be expanded to an enlarged image Ie of size (W + w) × (H + h) using boundary pixel padding. As shown in Fig. 10 (b), in the modified standard deviation representation scheme, the position of each image block will be shifted w/2 to the left and h/2 to the top before applying the standard deviation representation computation. The contrast image I containing (W/w) × (H/h) image blocks and the “enlarged” image Ie containing (W/w + 1) × (H/h + 1) image blocks are processed using standard deviation representation computation to obtain the saliency map T and the “shifted” saliency map Ts, respectively. The “shrunk” saliency map of the shifted saliency map Ts (the origin is (w/2, h/2) with W × H in size) is Ts′. The improved saliency map U is the union of the original saliency map T and the “shrunk” saliency map Ts′. This improvement is applied on both the proposed visual attention texture and object models. Finally, the improved texture saliency map UTT and the improved object saliency map UOO are linearly combined to constitute the final saliency map F of the image. Fig. 11 shows an illustrated example.
(a) The original image.
(b) The texture saliency map TT.
(c) The object saliency map OO.
(d) The improved texture (e) The improved object saliency (f) The final saliency map F. saliency map UTT. map UOO. Fig. 11. An illustrated improved saliency map.
4. EXPERIMENTAL RESULTS In this study, 30 test images, selected from the Corel Photo Library, Microsoft Research Asia (MSRA) and [29], are generally classified to 3 categories, namely, simple images (each image contains a single object), middle-complex images (each image contains few objects), and complex images (each image contains many objects). The images are 256 × 256 in size and the processing unit (image block) is 8 × 8 in size. The experiments are performed using Borland C++ on Intel Core 2 Due CPU 2.0GHz-Microsoft Windows platform. Based on the experimental results obtained in this study, as the illustrated multi-
VISUAL ATTENTION REGION DETECTION USING LOW-LEVEL FEATURES
1669
scaled object saliency maps for the image shown in Fig. 7, it was found that the performance of the object saliency map for an image with the scale s = 1 is not good, i.e., some visual attention regions (objects) in the image are not clearly detected. On the contrary, the performance of the object saliency map for an image with the scale s = 3 is also not good, i.e., visual attention regions (objects) in the image are overly extracted. Therefore, in the proposed approach, the scale s is set to 2. Visual attention region detection, different to edge detection or image segmentation, detects few visual attention regions (objects) with precise object positions and rough object details from an image. To evaluate the performance of the proposed approach, three comparison models, namely, Stentiford’s model [12], Zhai and Shah’s model [15], and Park and Moon’s model [16] are implemented in this study. To evaluate subjective performances of three comparison models, ten persons are invited to draw ten rectangles for ROIs on each original image, then the recall scores between the saliency map and rectangles for ROIs, namely, Rr, is computed as [16]: Rr = Rp/A, where
Rp =
W −1 H −1
⎧V ( x, y )/255, if ( x, y ) ∈ rectangles of ROIs, otherwise, y =0 ⎩
∑ ∑ ⎨ 0,
x =0
(24)
and
A=
W −1 H −1
∑ ∑ V ( x, y)/255,
(25)
x =0 y =0
the saliency map V (normalized within the range (0, 255)) is W × H in size, (x, y) is the coordinate of the map, and Rr ∈ [0, 1]. The subjective performance score is normalized into the range 0 (poor) to 10 (excellent). Figs. 12-14 show the comparison results of three types of images, namely, simple images, middle-complex images, and complex images, for Stentiford’s model, Zhai and Shah’s model, Park and Moon’s model, and the proposed approach. Note that each integer number labeled at the right corner of each image is the average subjective performance score (rounded to the nearest integer number) by the ten persons’ rectangles for ROIs. In Figs. 12 (a)-14 (a), red rectangles for ROIs show that drawn by most of the ten persons, whereas yellow dotted rectangles for ROIs show that drawn by sub-most of the ten persons. The average subjective performance scores for the 30 processed images of Stentiford’s model, Zhai and Shah’s model, Park and Moon’s model, and the proposed approaches are listed in Table 1, whereas the average computational complexities (the average processing times for an image of size 256 × 256) of Stentiford’s model, Zhai and Shah’s model, Park and Moon’s model, and the proposed approaches are listed in Table 2. Based on the experimental results obtained in this study, the following observations can be found. (1) If an image contains visual attention regions encircled by smooth surroundings, as the illustrated example shown in the first row of Fig. 12, Stentiford’s model, Zhai and Shah’s model, Park and Moon’s model, and the proposed approach can extract visual attention regions in the image. (2) Stentiford’s model, Zhai and Shah’s model, and
1670
HSUAN-YING CHEN AND JIN-JANG LEOU
9
4
9
9
5
2
7
9
3
3
5
9
3
2
5
9
5
6
8
9
1
1
2
7
1
1
1
4
2
1
3
6
2
2
2
8
2
2
3
8
(a) (b) (c) (d) (e) Fig. 12. Performance comparison of simple images (each image contains single object); (a) The original images; (b)-(d) The saliency maps by Stentiford’s model, Zhai and Shah’s model, Park and Moon’s model, and the proposed approach, respectively.
VISUAL ATTENTION REGION DETECTION USING LOW-LEVEL FEATURES
1671
7
3
8
9
7
3
7
9
4
5
7
9
2
2
4
9
(a) (b) (c) (d) (e) Fig. 13. Performance comparison of middle-complex images (each image contains few objects); (a) The original images; (b)-(d) The saliency maps by Stentiford’s model, Zhai and Shah’s model, Park and Moon’s model, and the proposed approach, respectively.
5
3
7
8
1
1
2
3
3
2
6
8
(a) (b) (c) (d) (e) Fig. 14. Performance comparison of complex images (each image contains many objects); (a) The original images; (b)-(d) The saliency maps by Stentiford’s model, Zhai and Shah’s model, Park and Moon’s model, and the proposed approach, respectively.
HSUAN-YING CHEN AND JIN-JANG LEOU
1672
Table 1. Average subjective performance scores of the final saliency maps of Stentiford’s model, Zhai and Shah’s model, Park and Moon’s model, and the proposed approaches.
Avg. subjective score
Stentiford’s model
Zhai and Shah’s model
Park’s model
Proposed approach (Itti’s color model)
Proposed approach
3.62
2.58
5.22
6.34
7.75
Table 2. Average computational complexity (the average processing times for an image of size 256 × 256) of Stentiford’s model, Zhai and Shah’s model, Park and Moon’s model, and the proposed approaches. Stentiford’s Zhai and Shah’s model model Avg. processing time (ms)
1188.12
656.41
Park’s model
Proposed approach (Itti’s color model)
Proposed approach
917.63
24.13
24.09
Park and Moon’s model usually fail to detect visual attention regions encircled by muddy surroundings, whereas the proposed approach successfully detects visual attention regions encircled by smooth and muddy surroundings. (3) For complex images (each image contains many visual attention objects), both Stentiford’s model and Zhai and Shah’s model successfully detect small visual attention objects in some images and fail to detect small visual attention objects in other images, whereas the proposed approach successfully detects small visual attention objects in all test complex images. (4) In general, the saliency map of an image by the proposed approach contains only the visual attention regions (ROIs) in the image, whereas the saliency maps of Stentiford’s model, Zhai and Shah’s model, and Park and Moon’s model usually contain both edge-like parts and other complex parts in the image. (5) In terms of direct visual appearance, the proposed approach is better than Stentiford’s model, Zhai and Shah’s model, and Park and Moon’s model. Additionally, based on the experimental results listed in Tables 1 and 2, as compared with Stentiford’s model, Zhai and Shah’s model, and Park and Moon model, the proposed approach has better subjective performance score and low computational complexity.
5. CONCLUDING REMARKS In this study, a visual attention region detection approach using low-level texture and object features is proposed. The new and improved (shifted) functions are proposed and used in both the proposed texture and object features to ensure that all visual attention regions (pixels) in an image are detected. The proposed approach can generate highquality spatial saliency maps in an effective manner. As compared with existing visual attention models, the proposed texture feature has better visual detection performance and low computational complexity, whereas the proposed object feature can detect all visual attention regions (ROIs) in an image. Based on the experimental results obtained in this study, as compared with Stentiford’s model, Zhai and Shah’s model, and Park and Moon’s model, the proposed approach has better subjective visual performance and low
VISUAL ATTENTION REGION DETECTION USING LOW-LEVEL FEATURES
1673
computational complexity. Because the proposed approach has low computational complexity, the proposed approach can be employed to process images in real time.
REFERENCES 1. W. James, The Principles of Psychology, Harvard University Press, Cambridge, MA, 1890. 2. D. E. Broadbent, Perception and Communication, Pergamon, New York, 1958. 3. J. Deutsch and D. Deutsch, “Attention: some theoretical considerations,” Psychological Review, Vol. 70, 1963, pp. 80-90. 4. A. M. Treisman and G. Gelade, “A feature-integration theory of attention,” Cognitive Psychology, Vol. 12, 1980, pp. 97-136. 5. K. W. Lee, H. Buxton, and J. Feng, “Cue-guided search: a computational model of selective attention,” IEEE Transactions on Neural Networks, Vol. 16, 2005, pp. 910924. 6. Z. Lu, W. Lin, X. Yang, E. Ong, and S. Yao, “Modeling visual attention’s modulatory aftereffects on visual sensitivity and quality evaluation,” IEEE Transactions on Image Processing, Vol. 14, 2005, pp. 1928-1942. 7. S. W. Bana, M. Lee, and H. S. Yang, “A face detection using biologically motivated bottom-up saliency map model and top-down perception model,” Neurocomputing Letters, Vol. 56, 2004, pp. 475-480. 8. J. P. Hodsoll and G. W. Humphreys, “The effect of target foreknowledge on visual search for categorically separable orientation targets,” Vision Research, Vol. 45, 2005, pp. 2346-2351. 9. G. Ciocca, C. Cusano, F. Gasparini, and R. Schettini, “Self-adaptive image cropping for small displays,” in Proceedings of IEEE International Conference on Consumer Electronics, 2007, pp. 1-2. 10. C. Koch and S. Ullman, “Shifts in selective visual attention: towards the underlying neural circuitry,” Human Neurobiology, Vol. 4, 1985, pp. 219-227. 11. L. Itti, C. Koch, and E. Niebur, “A model of saliency-based visual attention for rapid scene analysis,” IEEE Transactions on Pattern Analysis and Machine Intelligence, Vol. 20, 1998, pp. 1254-1259. 12. F. W. M. Stentiford, “An estimator for visual attention through competitive novelty with application to image compression,” in Proceedings of Picture Coding Symposium, 2001, pp. 24-27. 13. Y. F. Ma and H. J. Zhang, “Contrast-based image attention analysis by using fuzzy growing,” in Proceedings of the 11th ACM International Conference on Multimedia, 2003, pp. 374-381. 14. O. Le Meur, P. Le Callet, D. Barba, and D. Thoreau, “From low level perception to high level perception, a coherent approach for visual attention modeling,” in Proceedings of the SPIE Human Vision and Electronic Imaging IX, Vol. 5292, 2004, pp. 284-295. 15. Y. Zhai and M. Shah, “Visual attention detection in video sequences using spatiotemporal cues,” in Proceedings of the 14th Annual ACM International Conference on Multimedia, 2006, pp. 815-824. 16. K. T. Park and Y. S. Moon, “Automatic extraction of salient objects using feature
1674
17. 18. 19. 20. 21. 22. 23. 24. 25. 26. 27. 28. 29.
HSUAN-YING CHEN AND JIN-JANG LEOU
maps,” in Proceedings of the International Conference on Acoustics, Speech, and Signal Processing, 2007, Vol. 1, pp. I-617-I-620. J. Askelof, M. L. Carlander, and C. Christopoulos, “Region of interest coding in JPEG 2000,” Signal Processing: Image Communication, Vol. 17, 2002, pp. 105-111. S. Shirani and A. Jerbi, “Application of nonlinear pre- and post-processing in low bit rate, error resilient image communication,” Signal Processing: Image Communication, Vol. 18, 2003, pp. 823-835. A. P. Bradley and F. W. M. Stentiford, “Visual attention for region of interest coding in JPEG 2000,” Journal of Visual Communication and Image Representation, Vol. 14, 2003, pp. 232-250. L. Itti, “Automatic foveation for video compression using a neurobiological model of visual attention,” IEEE Transactions on Image Processing, Vol. 13, 2004, pp. 13041318. C. W. Tang, “Spatiotemporal visual considerations for video coding,” IEEE Transactions on Multimedia, Vol. 9, 2007, pp. 231-238. Y. F. Ma, X. S. Hua, L. Lu, and H. J. Zhang, “A generic framework of user attention model and its application in video summarization,” IEEE Transactions on Multimedia, Vol. 7, 2005, pp. 907-919. M. T. Lopez, A. F. Caballero, M. A. Fernandez, J. Mira, and A. E. Delgado, “Motion features to enhance scene segmentation in active visual attention,” Pattern Recognition Letters, Vol. 27, 2006, pp. 469-478. M. T. Lopez, A. F. Caballero, M. A. Fernandez, and J. Mira, “Visual surveillance by dynamic visual attention method,” Pattern Recognition, Vol. 39, 2006, pp. 2194-2211. C. Siagian and L. Itti, “Rapid biologically-inspired scene classification using features shared with visual attention,” IEEE Transactions on Pattern Analysis and Machine Intelligence, Vol. 29, 2007, pp. 300-312. W. H. Cheng, C. W. Wang, and J. L. Wu, “Video adaptation for small display based on content recomposition,” IEEE Transactions on Circuits and Systems for Video Technology, Vol. 17, 2007, pp. 43-58. C. H. Chou and Y. C. Li, “A perceptually tuned subband image coder based on the measure of just-noticeable-distortion profile,” IEEE Transactions on Circuits and System for Video Technology, Vol. 5, 1995, pp. 467-476. S. Engel, X. Zhang, and B. Wandell, “Colour tuning in human visual cortex measured with functional magnetic resonance imaging,” Nature, Vol. 388, 1997, pp. 68-71. O. Oyekoya and F. Stentiford, “Exploring human eye behaviour using a model of visual attention,” in Proceedings of the 17th International Conference on Pattern Recognition, Vol. 4, 2004, pp. 945-948. Hsuan-Ying Chen (陳軒盈) was born in Kaohsiung, Taiwan, R.O.C., December 1, 1977. She Received the B.S. degree in Information Engineering in 2000 and the M.S. degree in Information Engineering in 2005, all from I-Shou University, Kaohsiung, Taiwan. Since September 2005, she has been working toward the Ph.D. degree in Computer Science and Information Engineering at National Chung Cheng University, Chiayi, Taiwan. Her current
VISUAL ATTENTION REGION DETECTION USING LOW-LEVEL FEATURES
1675
research interests include image/video processing, pattern recognition, and soft computing. Jin-Jang Leou (柳金章) was born in Chiayi, Taiwan, R.O.C., October 25, 1956. He received the B.S. degree in Communication Engineering in 1979, the M.S. degree in Communication Engineering in 1981, and the Ph.D. degree in Electronics in 1989, all from National Chiao Tung University, Hsinchu, Taiwan. From 1981 to 1983, he served in the Chinese Army as a Communication Officer. From 1983 to 1984, he was at National Chiao Tung University as a lecturer. Since August 1989, he has been on the faculty of the Department of Computer Science and Information Engineering at National Chung Cheng University, Chiayi, Taiwan. His current research interests include image/video processing, image/ video communication, pattern recognition, and computer vision.