Article
Perspectives on the Use of Null Hypothesis Statistical Testing. Part III: The Various Nuts and Bolts of Statistical and Hypothesis Testing
Educational and Psychological Measurement 2017, Vol. 77(5) 816–818 Ó The Author(s) 2016 Reprints and permissions: sagepub.com/journalsPermissions.nav DOI: 10.1177/0013164416667988 journals.sagepub.com/home/epm
Fernando Marmolejo-Ramos1 and Denis Cousineau2 Keywords methodology, null hypothesis testing I suppose it is tempting, if the only tool you have is a hammer, to treat everything as if it were a nail. —Abraham Maslow, The Psychology of Science: A Reconnaissance, 1966, pp. 15-16 The highlight of the 3-day meeting [the 1962 conference of the American Educational Research Association], however, was to be found in Kaplan’s comment on the choice of methods for research. He urged that scientists exercise good judgment in the selection of appropriate methods for their research. Because certain methods happen to be handy, or a given individual has been trained to use a specific method, is no assurance that the method is appropriate for all problems. He cited Kaplan’s Law of the Instrument: ‘‘Give a boy a hammer and everything he meets has to be pounded.’’ —Milton J. Horowitz, Journal of Medical Education, 1962, Vol. 37, p. 637.
The number of articles showing dissatisfaction with the null hypothesis statistical testing (NHST) framework has been progressively increasing over the years. Thompson (2001) compiled a list of 402 articles questioning the indiscriminate use of NHST. According to Thompson (2001), the very first rebuttal against p values dates back to 1919 (Boring, 1919), barely 10 years after the publication of the t test (Student, 1908)! However, the number of criticisms really started to grow after 1955, reaching by the end of the 1990s more than 20 papers per year. Although the data 1
Stockholm University, Stockholm, Sweden University of Ottawa, Ottawa, Ontario, Canada
2
Corresponding Author: Fernando Marmolejo-Ramos, Go¨sta Ekman Laboratory, Department of Psychology, Stockholm University, Frescati Hagva¨g 9A, Stockholm 11419, Sweden. Email:
[email protected]
817
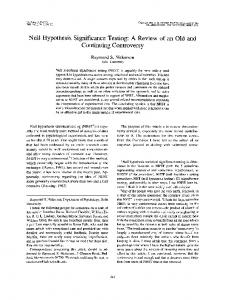
15 10 5
Frequency
20
25
Marmolejo-Ramos and Cousineau
1920
1940
1960 Year of publication
1980
2000
Figure 1. Frequency of articles questioning the indiscriminate use of NHST as a function of years, based on Thompson’s (2001) data (the blue dotted line represents the LOWESS nonparametric regression line).
are not available past the year 2000, it is most likely that this number has continued to grow until now. Figure 1 shows the distribution of the number of criticisms as a function of years, suggesting an exponential increase. Although 402 articles may seem considerable, it has to be contrasted with the tens of thousands of articles published extending NHST over the same period. Alternatives to NHST have also been proposed, the Bayesian approach receiving the highest amount of visibility. In this last part of the special issue, a few alternative approaches are examined. Jamil, Marsman, Ly, Morey, and Wagenmakers feature the Bayesian approach in the comparison of proportions. Trafimow, on the other hand, proposes the coefficient of confidence as an a priori inferential statistic to be used as an alternative to both Bayesian and NHST procedures. Grice, Yepes, Wilson, and Shoda propose a method called observation oriented modelling, a method that relies less on estimators of location and scale and instead focuses on the visual examination of data to detect and explain dominant patterns within a set of observations. George Box once stated: ‘‘All models are wrong, but some are useful.’’ Algorithmic modelling is one of those useful forms of statistical inference that has attracted interest. Bzdok, Varoquaux, and Thirion advocate the use of such an approach in the analysis of neuroimaging data. Finally, Campitelli, Macbeth, Ospina, and Marmolejo-Ramos propose the combination of statistical graphics with modelling techniques to understand the phenomena of interest and exploit all the parameters of the data’s distribution. We hope that the reader discovers the miscellany of approaches to statistical inference in order, paraphrasing the opening quotes, to pick the most suitable ‘‘hammer’’ given the ‘‘nail’’ whereby ‘‘scientists exercise good judgment in the selection of appropriate methods for their research’’ (Horowitz, 1962, p. 637).
818
Educational and Psychological Measurement 77(5)
Declaration of Conflicting Interests The author(s) declared no potential conflicts of interest with respect to the research, authorship, and/or publication of this article.
Funding The author(s) received no financial support for the research, authorship, and/or publication of this article.
References Boring, E. G. (1919). Mathematical versus scientific significance. Psychological Bulletin, 16, 335-338. Horowitz, M. J. (1962). Trends in education. Journal of Medical Education, 37, 635-639. Student (pseudonym for W. Gosset). (1908). The probable error of a mean. Biometrika, 6, 1-25. doi:10.1093/biomet/6.1.1 Thompson, B. (2001). 402 Citations questioning the indiscriminate use of null hypothesis significance tests in observational studies. Retrieved from http://warnercnr.colostate.edu/ ~anderson/thompson1.html