the performance of metrics for object segmentation when ... surveillance applications ... el al. [8] on an open source tracking test bed and evaluation web site.
PETS Metrics: On-Line Performance Evaluation Service David P. Young and James M. Ferryman Computational Vision Group, Department of Computer Science The University of Reading, Reading, RG6 6AY, UK [d.young][j.m.ferryman]@reading.ac.uk
Abstract
that all participants tested algorithms and presented results based on the same published dataset. Since 2000, a further six PETS (and VS-PETS) workshops have been held in collaboration with major conferences, examining a range of surveillance data. Recently, there has been a growing number of additional activities which aim to further address performance evaluation in a surveillance context. This includes project ETISEO which commenced in 2005 (funded by the French Ministry of Science) and “seeks to work out a new structure contributing to an increase in the evaluation of video scene understanding.” 1 , and satellite workshops including the Real-Time Event Detection Solutions (CREDS) for Enhanced Security and Safety in Public Transportation. This latter activity was held in conjunction with the 2005 IEEE International Conference on Advanced Video and Signal based Surveillance. Table 1 summarises representative current efforts in publicly available surveillance datasets and performance evaluation.
This paper presents the PETS Metrics On-line Evaluation Service for computational visual surveillance algorithms. The service allows researchers to submit their algorithm results for evaluation against a set of applicable metrics. The results of the evaluation processes are publicly displayed allowing researchers to instantly view how their algorithm performs against previously submitted algorithms. The approach has been validated using seven motion segmentation algorithms.
1. Introduction Performance evaluation is necessary to state whether the research community is making a quantifiable progression in algorithm development. Previously there was a tenancy to test and report algorithm results based on in-house datasets. This could lead to a bias of exaggerated performance due to non-representative datasets of a particular problem. To combat this problem standard datasets have been created: PETS, CAVIAR – and in the near future ETISEO and iLIDS. Even with standard datasets it can be difficult to confirm the performance of an algorithms due to in-house metric evaluations and selective reporting of results. The next progressive step is to supply the research community with an central location where algorithms can be tested against standard datasets and a common set of metrics. The PETS Metrics web site aims to provide this service for the research community.
1.2. Performance Evaluation and Surveillance In the context of visual surveillance, Cavallaro el al. [2] propose an “automatic” approach to the objective evaluation of segmentation results. The method is used to compare and rank change detection results for three different algorithms based on a metric which weights judgement of the spatial accuracy and temporal coherence against a reference segmentation. Beleznai el al. [3] present quantitative assessment of two motion segmentation algorithms performed using error metrics based on ground truth data and with and without the use of spatial context. Erdem el al. [4] evaluate the performance of metrics for object segmentation when ground truth segmentation maps are not available. Recent work by Brown el al. [5] developed a new method for evaluating the performance of background subtraction and tracking including a track evaluation based on matching ground truth tracks to system tracks in a two-way matching process. Ellis [6] examined the main requirements for effective performance analysis of surveillance systems and proposed a number of new metrics. Black el al.
1.1. History of PETS & Related The first Performance Evaluation of Tracking and Surveillance (PETS) workshop [1] was held in Grenoble on March 31st 2000, in conjunction with the IEEE Face and Gesture Recognition conference. It was realised that the growth in the development of the visual surveillance field had not been met with complementary systematic performance evaluation of developed techniques. It has been especially difficult to make comparisons between published algorithms in the literature if they have been tested on different datasets under widely varying conditions. The PETS workshop was instigated to address this issue. The workshop was unique in
1 ETISEO
1
Website located at: www.silogic.fr/etiseo
Project PETS (The University of Reading, UK) iLIDS (HOSDB, UK) VERAAE (ARDA, US) ARDA VACE (NIST, US) CAVIAR EC funded project (IST 2001 37540) ETISEO (France)
Description Series of workshops on performance evaluation. Each workshop focuses on specific dataset(s) Collection of real-world CCTV test imagery (4 surveillance scenarios)
Timescale 2000 - current
Comparative study of Video Event Recognition (VER) algorithms
Focus is on surveillance domain. 2005 - current Three 2-year phases Currently in middle phase 2 October 2002 - September 2005 2005 - 2006
Develop revolutionary advances in automatic video extraction, understanding, and multimodal fusion - surveillance is one of the evaluation domains Set of ground truthed datasets. Domain is public space, and shopping, surveillance French Government funded project to evaluate vision techniques for video surveillance applications
2004 - current
Table 1: Summary of representative current efforts in Performance Evaluation of Surveillance [7] presented a novel framework for performance evaluation employing pseudo-synthetic video. The most relevant work to PETS Metrics is the recent work undertaken by Collins el al. [8] on an open source tracking test bed and evaluation web site. The web site developed by Collins el al. [8] provides an on-line algorithm evaluation service. However, the evaluation is limited to the specific task of tracking ground vehicles from airborne video.
combine the advantages of different algorithms to produce a single, more robust tracking algorithm. A significant aim of PETS Metrics is to extend the evaluation methodology to: 1. Provide a online, evolving repository of datasets, metrics and results 2. Allow for automatic evaluation of submitted results 3. Provide quantitative results which may be viewed ranked by metric
1.3. PETS Metrics PETS Metrics has been developed to be both an ancillary and complementary mechanism to the traditional PETS workshop event. The overall aim is to provide an automatic mechanism to compare, in a quantitative manner, a selection of algorithms operating on the same data. PETS Metrics automates the performance evaluation process, and provide to the community an evolving online repository of datasets, metrics and results. The approach is different from related activities such as ETISEO in which the overall coordinator performs the evaluation of submitted results. In PETS Metrics, results are uploaded directly to the website, automatically evaluated and results presented ranked alongside other algorithms. A principal motivation behind PETS Metrics was the evaluation results presented during PETS 2001. At this second PETS workshop, a requirement was set that submitted papers were accompanied with algorithmic results output in XML format. The coordinator then reconstructed the object detection and tracking results from the XML files, which provided for a qualitative comparison of a number of algorithms operating on the same PETS video sequences. A significant outcome of this process was that it allowed for specific sub-problems within the surveillance task, for example, ensuring the maintenance of the identity of tracked objects through partial occlusion, to be studied. Specifically, which algorithms succeeded and failed at this task for a given sequence. This led to recommendations on how to
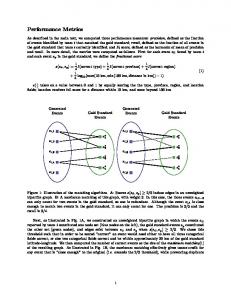
2. PETS Metrics Web Site 2.1. Web Site Overview The PETS Metrics web site, shown in Figure 1, is the interface for researchers to submit their algorithm results and view the algorithm performance against a set of applicable metrics. For each metric the web site publicly shows a ranking table on how the submitted algorithms have performed against each other. The site is scalable to accommodate any number of metrics for any particular research area or activity. The site currently includes, but is not limited to, metrics for motion segmentation as described in [9]. In future the metrics will be extended to cover further visual surveillance research tasks, for example, tracking and categorisation. The site is also scalable to any number of video datasets. Due to the time intensive nature of ground truthing PETS Metrics currently measures algorithms against Dataset 1 Camera 1 of the PETS 2001 dataset. This will be expanded to cover the whole PETS 2001 dataset and further datasets with available ground truth.
2.2. Algorithm Results’ Files Collectively researchers develop their algorithms on differing computing platforms, use a variety of programming languages and typically store their algorithm results in their own data structures. For PETS Metrics to evaluate differing 2
Figure 1: Home page of the PETS Metrics web site researchers’ algorithms there must therefore exist a standard file format for the submission of results. To resolve this issue, PETS Metrics requires that an algorithm’s result file is submitted as an XML file formatted to the PETS Metrics XML Schema. An XML Schema is a definition on how to legally construct an XML file. Figure 2 diagrammatically shows the XML elements used in the PETS Metrics XML Schema2 XML is suited to PETS Metrics’ results submission as it is a non-propriety, internationally recognised, platform and programming language independent data format. Furthermore, XML can be easily generated by a programming language’s normal file writing functions, i.e. fwrite() in C or ofstream in C++3 .
Figure 2: PETS Metrics XML Schema these include: a short name, frames per second (FPS) of the algorithm, speed of the executing computer, description of the algorithm and task the algorithm was developed for (one selection from a list.) It is required to know for what task the algorithm was developed in order to apply the correct metrics to the results file. The FPS and speed of the computer are required to analyse the approximate processing load of the algorithm. To upload a file to PETS Metrics the user selects a file from their computer. Upon upload the PETS Metrics site will validate the XML file. The PETS Metrics XML parser will attempt to extract all valid information. For flexibility the parser is tolerant to certain errors in the formatting of the XML file. However, submitters should not assume the parser is tolerant to all forms of errors. Illegal formatted XML elements are ignored which may affect the algorithms rankings by the site’s metrics. Prior to the confirmation of a successful submission to PETS Metrics, the submitter has a final opportunity to correct any questionnaire entries. On confirmation by the submitter that the questionnaire information is correct, the PETS Metrics web site displays a successful submission web page and starts processing the results file against the appropriate metrics.
2.3. Submission Process Submission of algorithm results to the PETS Metrics web site process consists of five stages. This is summarised below with a generalised flow diagram shown in Figure 3. 1. 2. 3. 4. 5.
Entering your contact details Entering details on the algorithm Uploading the XML Results file Final check of inputted data Confirmation of submission
The submitter will first complete two web form questionnaires in order to submit an algorithm’s results to the site. The first questionnaire captures the submitter’s contact details to allow future correspondence4 whilst, the second questionnaire captures details regarding the algorithm; 2 Details regarding the schema can be found on the PETS Metrics web site located at http://petsmetrics.net 3 C++ code for generating XML files that follow the PETS Metrics schema is available for download from the PETS Metrics site 4 This information will not be publicly displayed on the web site
2.4. Algorithm Ranking Display By selecting the Ranking Table web page of the PETS Metrics web site, a user can view a table of the current metrics 3
Figure 4: Screenshot of a Metric’s Algorithm Evaluation Table
3.1. Ground Truthing Metrics evaluate algorithms against a ground truth that is assumed to be correct. To generate ground truth data is a largely manual repetitive process where semi-automation should be only introduced where it will not bias the ground truth data. In practice, ground truth data collection is subject to the systematic subjective error of individuals collecting the data. For example, in ground truthing object boundaries the quantisation of the real world to pixels and JPEG noise can make it hard to exactly define a boundary. In this case systematic noise is added to ground truth, when comparing individuals, as some may systematically tend to regularly define the object boundary closer or further away from the object. Ideally, a given sequence should be ground truthed a number of times by the same person (or by different people) and the results averaged. This however is usually unrealistic due to the economics and time required. It is therefore practically impossible to state the collected ground truth data will actually be 100% correct. This will therefore always lead to a level of error in the reported results of metrics against the results of an algorithm. Ground Truthing Assumptions. Identifying and informing researchers of assumptions in the ground truth data is of vital importance to ensure all algorithms are evaluated fairly. For example, in annotating scene event data on recognising unattended luggage, one would have to state the minimum distance and time at which the left luggage is defined as unattended in the ground truth data. Information regarding the parameters for a particular surveillance task, used when collecting the ground truth data, are available from the PETS Metrics web site. Ground Truthing Annotation Tools (GTAT) GTATs tools are required to input ground truth data by users to the computer. The first set of metrics implemented for PETS Metrics were for motion segmentation. A tool for obtaining motion segmentation ground truth was selected. Two popu-
Figure 3: Generalised flow diagram on submission process to PETS Metrics
for the web site with their associated description. By selecting a metric a web page will appear showing the algorithm ranking table for that metric, as shown in Figure 4. A particular metric may have many constituent parts, e.g. a value for true positives, false positives, etc. These constituent parts will be displayed as column headers in the ranking table for that metric. The algorithms in the ranking table for that metric can be sorted into different orders depending on the constituent part selected. To supplement the information in the ranking table, a second table of information regarding the algorithms is also shown. The second table information provides the algorithm details captured in the second questionnaire, see Section 2.3. This will allow users of PETS Metrics to identify which computational vision methods are performing better.
3. Example Results of the Service PETS Metrics currently evaluates motion segmentation algorithms using the metrics described in [9]. Currently 240 foreground objects from 100 frames of the test sequence of Dataset 1 Camera 1 of the PETS 2001 Dataset have been ground truthed. 4
lar GTATs, which are freely available, for bounded box segmentation of objects are Viper5 and the CAVIAR6 project tool. Although these are sophisticated tools, for PETS Metrics the Reading University GTAT from the AVITRACK7 project was adapted. This tool, shown in Figure 4, is a multiple video stream bounded box object segmentation and description annotation tool with linear object motion prediction. This tool outputs ground truth annotation in XML. The tool was adapted to allow the inputting of segmentation data for the motion. Ground truthing with the Reading University GTAT was performed in four steps: 1. First ensure each unique physical mobile object is given a unique ID and classification (e.g. person, car, etc.) that references it in each frame. 2. Next, for each unique physical mobile object in each frame, ensure is it encapsulated by an overly large bounded box. The automatic linear motion prediction aided rapid addition of bounding boxes to selected preceding or successive frames.
Figure 5: Ground Truth Annotation Tool developed by The University of Reading. Images curtsy of the AVITRACK project
The first metric, Negative Rate Metric (NR) as shown in Equations 1 to 3, evaluates a false negative rate (N Rf n ) and false positive rate (N Rf p ). This metric is based on a pixel-wise mismatches between the ground truth and observations in a frame [6].
3. Next, segment each object in its bounded box from the background by identifying foreground boundary pixels around the object and using the segmentation foreground “flood fill” feature to fill the pixels inside the boundary.
NR = 4. Next, use the automatic tighten bounding box feature to ensure the bounded box only extends to the minimum and maximum x-y dimension values of the object foreground data.
where
3.2. Experimental Results At present PETS Metrics has four metrics implemented for evaluation of Motion Segmentation, as described in [9]: • • • •
6 7
(1)
N Rf n =
Nf n Ntp + Nf n
(2)
N Rf p =
Nf p Nf p + Ntn
(3)
where Nf n and Nf p denote the number of false negative and false positive pixels respectively. Ntn and Ntp are the number of true negatives and true positives. It should be be noted the Negative Rate Metric can only used to give a general indication of specific object segmentation. The second metric, Misclassification Penalty Metric (MP) as shown in Equations 4 to 6, evaluates an algorithm’s object segmentation against the ground truth on an objectby-object basis. Misclassified pixels are penalised by their distances from the ground truth reference object’s border.
Negative Rate Metric (NR) Misclassification Penalty Metric (MP) Rate of Misclassifications Metric (RM) Weighted Quality Measure Metric (WQM)
For all the Motion Segmentation metrics, the lower the score the better the algorithm is at correctly segmenting foreground that matches the ground truth foreground segmentation. All of the metrics are the sum of two parts: a false positive score and a false negative score. A low false positive score describes good object boundary identification. A low false negative score describes good identification of foreground internal to the object. 5
1 (N Rf n + N Rf p ) 2
1 (M Pf n + M Pf p ) 2 PNf n j j=1 df n M Pf n = D
MP = where
http://viper-toolkit.sourceforge.net http://homepages.inf.ed.ac.uk/rbf/CAVIAR/ http://www.avitrack.net/
PNf p M Pf p = 5
j=1
D
djf p
(4)
(5)
(6)
where djf n and djf p are the distances of the j th false negative and k th false positive pixel from the contour of the reference segmentation. The normalised factor D is the sum over all the pixel-to-contour distances of objects in a frame. This metric describes how well an algorithm can extract a specific physical object by penalising misclassified pixels based on distance from an object’s boundary. If an algorithm has a low M P score it is good at identifying an object’s boundary and segmenting a physical object from the scene. The third metric, Rate of Misclassifications Metric (RM) as shown in Equations 7 to 9, evaluates an algorithm’s average erroneously segmented pixel’s distance to an object’s border in units of pixels. 1 (RMf n + RMf p ) 2 Nf n j 1 X df n RMf n = Nf n j=1 Ddiag
RM = where
RMf p
Nf p 1 X dkf p = Nf p Ddiag
wf n (df n ) = C · df n
PETS Metrics uses the same constant values for B1 , B2 , B3 and C as [9], namely: B1 = 19, B2 = −178.125, B3 = 9.375 and C = 2. The weighting with these parameters values favours algorithms which provide larger foreground estimations over conservative ones. 3.2.1 Metric Evaluation of Submitted Algorithms Seven motion segmentation algorithms, listed below, have been published on the PETS Metrics web site. It should be noted that each algorithm uses the same colour tracking algorithm implementation, as described in [10], which utilises the object’s colour histogram as the colour model to represent objects. HSV colour space is used for the colour model: 2D hue-saturation histogram plus a 1D value-histogram for representing the “colourless” pixels. Tracking algorithms are only used to feedback to the motion segmentation algorithm when an object becomes stationary or recommences motion.
(7) (8)
(9)
1. 2. 3. 4. 5. 6. 7.
k=1
Nf n and Nf p denote the number of false negative and false positive pixels respectively. Ddiag is the diagonal distance of the frame. This metric is similar to the MP metric but uses the number of Nf n or Nf p pixels as the normalising factor for RMf n and RMf p , respectively, opposed to D in Equations 5 and 6. This metric will evaluate the average degree of error when errors occur rather than the average quantity of error that occurs. The fourth metric, Weighted Quality Measure Metric (WQM) as shown in Equations 10 to 14, quantifies the spatial discrepancy between estimated motion segmentation and the ground truthed reference object motion segmentation. This is measured as the sum of weighted effects of false positive and false negative pixels. 1 W QM = ln( (W QMf n + W QMf p )) 2 Nf n where 1 X W QMf n = wf n (djf n )djf n Nf n j=1 W QMf p
Nf p 1 X = wf p (dkf p )dkf p Nf p
Algorithm BC DIF EDG GMM KDE VAR WFL
(10) (11)
False Negative Rate 0.3535 0.3500 0.3293 0.3017 0.3026 0.3308 0.2435
False Positive Rate 0.001381 0.002776 0.001843 0.002203 0.001942 0.001800 0.002336
Negative Rate (NR) 0.1773 0.1764 0.1656 0.1520 0.1523 0.1663 0.1229
Table 2: NR Metric evaluation of algorithms (12) Table 2, the Negative Rate metric (NR), broadly shows a symmetry where algorithms that erroneously over segment objects (high f p) are better at segmenting all of an object’s foreground pixels (low f n), and vice versa. This is to be expected since correctly segmenting nearly all the object’s pixels indicates a resilience to noise yet, this resilience generally creates errors in identifying an object’s boundary; thus over segmentation occurs. The exception is the frame differencing method, relative to the other algorithms, where
where N is the area of the reference object in pixels. Following the argument in the work from Aguilera et al. [9] that the visual importance of false positives and false negatives is not the same, and thus should be treated differently, the weighting functions wf p and wf n are used, where: B2 df p + B3
Brightness and Chromaticity (BC) [11] Five Frame Differencing (DIF) Edge Fusion (EDG) [12] Gaussian Mixture Model (GMM) [13] Kernel Density Estimation (KDE) [14] Colour Mean and Variance (VAR) [15] Wallflower Linear Prediction Filter (WFL) [16]
The PETS Metrics evaluation service was used to evaluate the algorithms against the currently implemented metrics. The results are shown in Tables 2 to 5.
k=1
wf p (df p ) = B1 +
(14)
(13)
6
Algorithm BC DIF EDG GMM KDE VAR WFL
False Negatives MP 0.939 0.459 0.320 0.294 0.321 0.322 0.242
False Positives MP 0.097 9.909 7.928 7.827 5.968 7.736 7.521
Misclassification Penalty (MP) 0.518 5.183 4.123 4.060 3.144 4.029 3.882
Algorithm BC DIF EDG GMM KDE VAR WFL
Table 3: MP Metric evaluation of algorithms Algorithm BC DIF EDG GMM KDE VAR WFL
False Negatives RM 0.342 0.351 0.281 0.276 0.264 0.280 0.278
False Positives RM 0.361 0.171 0.084 0.076 0.076 0.084 0.083
Loge of WQMf n 5.575 5.854 5.701 5.720 5.650 5.698 5.743
Loge of WQMf p 1.236 1.415 1.271 1.217 1.195 1.270 1.056
Weighted Quality Measure (WQM) 5.571 5.837 5.723 5.746 5.666 5.721 5.769
Table 5: WQM Metric evaluation of algorithms
Rate Misclassification Penalty (RM) 0.352 0.261 0.186 0.176 0.170 0.182 0.181
shows that although we know from the other metrics that it has the most errors, the errors on average are not as serious as the Brightness and Chromaticity algorithm. Table 5, the Weighted Quality Measure (WQM) metric, shows evaluation based upon visual appearance of the segmented object where false negative pixels are deemed a worse error than false positive pixels. With the current parameter values, Table 5 reports that the Brightness and Chromaticity motion segmentation algorithm scores well, showing the algorithm tends to over, rather than under, segment objects. However, the WQM scores of the algorithms are all in a similar range which therefore makes a meaningful comparison of the evaluation difficult. Algorithm Ranking. By ranking the algorithms in Tables 2 to 5 and averaging the ranked position, the algorithm’s ranked positions are shown in Table 6:
Table 4: RM Metric evaluation of algorithms poor segmentation is shown as high values for both false positive and false negative rates. Table 3, the Misclassification Penalty metric (MP), shows to a lesser extent the symmetry between false positive and false negative segmentation. However, the MP metric can provide interesting comparisons between the algorithms due to it’s method of measuring boundary distances of erroneous pixels, opposed to NR metric’s method of counting erroneous pixels. According to the NR metric, the Wallflower algorithm responded best in correctly identifying an object’s foreground pixels up to it’s boundary (lowest f n score) yet nearly the worst at over segmenting the object (high f p score). However, the MP metric shows the Wallflower algorithm has again the lowest f n score yet, in contrast to the NP metric, the f p score from the MP metric is lower than most of the submitted algorithms. Relative to the other algorithms, the NR metric shows that the Wallflower algorithm constantly over segments yet the MP shows the over segmentation is quite close to the ground truth segmentation data. Table 4, the Rate of Misclassifications metric (RM), shows the average distance of misclassified pixel to an object’s boundary. This metric shows the best five algorithms KDE, WFL, GMM, VAR and EDG algorithms have approximately the same average distance of erroneously segmented pixel’s to an object’s border. Therefore according to the RM metric, when errors in these algorithms segmentation occur, in what ever number, the errors are approximately of the same degree. Interestingly the Differencing algorithm does not perform the worst in this metric. This
Algorithm BC DIF EDG GMM KDE VAR WFL
Average Ranking 5.75 6.25 4.5 2.5 2.75 4.75 1.5
Position 6 7 4 2 3 5 1
Table 6: Algorithm Ranking For the PETS 2001 Dataset 1 Camera 1 sequence, the WFL algorithm has been shown as the better algorithm for motion segmentation. Although the WLF performed well, for other video sequences created in different conditions8 the algorithm may not perform to the same accuracy. It is an aim of PETS Metrics to increase the number of grounded truthed video sequences. Furthermore, the practicality of algorithms must be considered as the WFL and KDE algorithms run at 3 and 5 frame per second, respectively, and both require approximately 1 GB of memory. In contrast, when run on the same computer, the GMM algorithm, ranked third, ran at realtime and required 60 MB of memory. 8 E.g.
7
inconstant lighting, an indoor scenario, grayscale video, etc.
4. Evaluation of the Evaluation
The paper described the metrics which are currently implemented in the PETS Metrics web site. The paper showed and discussed the results of PETS Metric’s evaluations upon seven submitted motion segmentation algorithms. Future work for the PETS Metrics project includes implementing metrics for further tasks including object categorisation, tracking and event detection.
Parameters of Metrics. Evaluation metrics can contain parameters an algorithm’s result data against the ground truth data. These parameters must be precisely and openly communicated to users of the metric. An example of parameters in a metric is the object-by-object evaluation of the MP metric. Users should be informed on how the metric matches objects found by the algorithm to the objects in the ground truth, e.g. matching by Object IDs or by matching bounding boxes. A poor awareness of the metric’s assumptions could lead to a good algorithm evaluated as poor. An example of this is a researcher who is interested in motion segmentation and not tracking. This researcher may set all Object Ids to the same value. If object matching was performed by Object Id tracking the researcher will receive an unfair evaluation of their algorithm. Furthermore, users of the metric must be informed on what occurs when a metric fails to match ground truth to algorithm result data. Selection of Metrics. To alleviate problems with assumptions in metrics, one could implement various specialised versions of a metric which handled differing assumptions. However, the purpose of metric is to not only to evaluate but to use the evaluation in a meaningful comparison of algorithms. By specialising a metric it may become applicable to a minority of algorithms, thus rendering it difficult to perform a meaningful performance comparison against the majority of algorithms. An ideal evaluation process would be a single metric that could evaluate any algorithm for a particular task. A single score by which to rank algorithms would render easy comparison of algorithms. However, as metrics become generalised, to cover an increasing set of possible algorithms, they can become insensitive to the subtleties of an algorithm’s performance. This leads to problems in creating a meaningful comparison between algorithms as many will score practically the same values. Metrics Discussion Summary. Metrics must be chosen that are neither too specialised to one application nor too generalised to a large set of applications. A number of metrics will therefore have to exist to evaluate a particular problem. For a proper comparison of algorithms, the results from a set of metrics will have to be cross referenced against each other. Care must be taken not to include a large number of metrics as a meaningful comparison can be hampered by too much information to be cross referenced.
References [1] J. M. Ferryman. PETS. IEEE Int. Workshops on Performance Evaluation of Tracking and Surveillance (PETS) http://www.visualsurveillance.org, 20002005. [2] A. Cavallaro et. al. Objective evaluation of segmentation quality using spatiotemporal context. IEEE International Conference on Image Processing, 2002. [3] C. Beleznai, T. Schlgl, H. Ramoser1, M. Winter, H. Bischof and W. Kropatsch. Quantitative evaluation of motion detection algorithms for surveillance applications. 27th Workshop of Austrian Association for Pattern Recognition, pages 205–212, 2003. [4] C-E. Erdem and B. Sankur. Performance evaluation metrics for object-based video segmentation. 10th European Signal Processing Conference (EUSIPCO), 2000. [5] L. M. Brown, A. W. Senior, Y-L. Tian, J. Connell, A. Hampapur, C-F. Shu, H. Merkl and M. Lu. Performance evaluation of surveillance systems under varying conditions. IEEE International Workshop on Performance Evaluation of Tracking and Surveillance (WAMOP-PETS), pages 1–8, 2005. [6] T. Ellis. Performance metrics and methods for tracking in surveillance. 3rd IEEE International Workshop on Performance Evaluation of Tracking and Surveillance (PETS), pages 26–31, 2002. [7] T. Ellis J. Black and P. Rosin. A novel method for video tracking performance evaluation. Joint IEEE Int. Workshop on Visual Surveillance and Performance Evaluation of Tracking and Surveillance (VS-PETS), pages 125–132, 2003. [8] X. Zhu R. Collins and S-K The. An open source tracking testbed and evaluation web site. IEEE International Workshop on Performance Evaluation of Tracking and Surveillance (WAMOP-PETS), pages 17–24, 2005. [9] J. Aguilera, H. Wildenauer, M. Kampel, M. Borg, D. Thirde and J. Ferryman. Evaluation of motion segmentation quality for aircraft activity surveillance. Joint IEEE International Workshop on Visual Surveillance and Performance Evaluation of Tracking and Surveillance (VS-PETS), In this volume, 2005. [10] G. Bradski. Computer vision face tracking for use in a perceptual user interface. Intel Technology Journal, Q2, 1998. [11] T. Horprasert, D. Harwood and L.S. Davis. A statistical approach for real-time robust background subtraction and shadow detection. IEEE ICCV’99 FRAMERATE Workshop, 1999. [12] S. Jabri, Z. Duric, H. Wechsler and A. Rosenfeld. Detection and location of people in video images using adaptive fusion of color and edge information. Proc. IAPR Internation Conference on Pattern Recognition, pages 4627–4631, 2000. [13] C. Stauffer and W.E.L. Grimson. Adaptive background mixture models for realtime tracking. Proc. International Conference on Pattern Recognition, pages 246–252, 1999. [14] A. Elgammal, D. Harwood and L. Davis. Non-parametric Model for Background Subtraction. 6th European Conference on Computer Vision, Dublin, Ireland, 2:751–767, 2000.
5. Summary and Conclusions
[15] C. R. Wren, A. Azarbayejani, T. Darrell and A. Pentland. Pfinder: Real-time tracking of the human body. IEEE Transactions on PAMI, 19(7):780–785, 1997.
This paper has presented a new web based fully automatic service to evaluate the performance of computational visual surveillance algorithms. The paper discussed issues in the ground truthing process and issues to be concerned with the use of metrics.
[16] K. Toyama, J. Krumm, B. Brumitt and B. Meyers. Wallflower: Principles and practice of background maintenance. IEEE International Conference on Computer Vision, pages 255–261, 1999.
8