Indian Society for Non-Destructive Testing Hyderabad Chapter
Proc. National Seminar on Non-Destructive Evaluation Dec. 7 - 9, 2006, Hyderabad
PHASED ADDITION RECONSTRUCTION IN ANISOTROPIC MEDIA Ajith Muralidharan, J. Vishnuvardhan, Krishnan Balasubramaniam, and C.V. Krishnamurthy Centre for NDE and Department of Mechanical Engineering Indian Institute of Technology Madras, Chennai 60 036 Email:
[email protected]
Abstract Structural health monitoring of plate like structures, using transducer arrays located suitably on the structure, finds applications in monitoring aerospace structures. These plates are anisotropic, with wave propagation properties varying with direction. Thus any technique for imaging this plate structure needs to take this into account. In this paper, a phased addition reconstruction algorithm, based on SAFT, is described for imaging reflectors (edges, defects) present on the plate structure. The algorithm takes into account the anisotropy in the material and performs phased reconstruction using appropriate dispersion data depending on the direction of reconstruction. The algorithm can also accurately reconstruct defects present in the near field zone of the array, since it takes exact distances into account. The algorithm can also be used to image for any array configuration and also the domain can be subject to any discretization as required. The Single Transmitter Multiple Receiver (STMR) array was chosen for simulations and experimentations due to its advantages. Simulations were also performed for linear array configuration, to demonstrate the applicability of this algorithm for arbitrary array configurations.
Keywords: Structural Health Monitoring, Phased addition reconstruction, STMR.
NDE-2006
1
Phased Addition Reconstruction In Anisotropic Media
number of modes by working at lower frequencies and using angular excitation.
1. Introduction Structural Health Monitoring (SHM) can be described as the assessment of in-service performance of a structure, using various measurement techniques. It is an emerging field due to its vast potential for building-in reliability and safety into the structure as well as for reducing the maintenance costs. Typically, it involves monitoring the changes in a structure with attached/embedded sensors, and processing the acquired data to arrive at life cycle management decisions. The applications of SHM range from ship and aircraft industries to civil structures [1].
One of the methods for implementation of the guided wave inspection would be the use of Multiple Transmitters and Multiple Receivers (MTMR) Array that can monitor a predetermined area in the plate-like structure. The data is collected and the damage state of the monitored area is 2dimensionally imaged using tomography techniques. Iterative tomography techniques have been popular for image reconstruction [3] with the limited data. SHM using such methods have been shown on isotropic and in anisotropic plates.
Plate like structures often find use in fabrication of wings and other substructures in aircrafts. These plates are predominantly multi-layered composites, which offer favorable properties. These structures are subjected to damages like impacts and delaminations during their service. Conventional NDE techniques prove expensive and time consuming and in many cases, the costs of these inspections are difficult to justify, given that many of the NDT inspections do not reveal any defects that may potentially cause catastrophic damage. Lamb wave based inspection methods have been shown to be well suited for monitoring such structures, since Lamb waves have the capability of traveling large distances without much attenuation, as they are guided by the boundaries of the plate. However, Lamb waves are multi-modal and these modes can be dispersive i.e. the wave velocity varies with frequencythickness product [2]. Much of the research work carried out focuses on using only a single guided wave mode. Measures are taken to minimize the
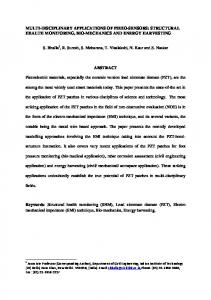
Another method is based on outward monitoring using remotely placed transducer array. Such SHM methods have been reported for quick inspection of large isotropic plates-like structures [4], using a multi transmitters and multi receivers, (MTMR) array. Another configuration is the Single Transmitter Multiple Receiver compact array system (STMR) [5] as illustrated in Fig. 1. A single omni-directional PZT transducer element is employed to excite ultrasonic guided waves in the plate. The transmitter is surrounded by several receiver elements that receive the direct signals (as the wave propagates beneath the receivers) as well as reflected signals from defects and geometric discontinuities in the plate like structure. In these cases, the circular arrays take advantage of the fact that waves propagating are two-dimensional, and can yield information in all the directions. Thus phase shifting and addition of the collected data can be used for imaging the location of reflecting features. Thereby one can
NDE-2006
3
Phased Addition Reconstruction In Anisotropic Media
image the whole structure from a set of sensors fixed at a single location.
where there is no reflector, the addition is random (less constructive), which will diminish the phase added amplitude for the point. As a result the signal to noise ratio is significantly improved. The location of the reflectors is then obtained by plotting the phase added intensity obtained at each point in a 2 dimensional plot.
In this paper, a new phased addition reconstruction technique, based on SAFT is introduced. The STMR array is primarily used for simulations and experiments because of its unique advantages such as compact footprint, complete two-dimensional monitoring and good reconstruction characteristics. Simulations have been carried out and it is observed that near field defects are imaged better using this new algorithm compared to it predecessor[6]. Also the flexibility to image for different array configurations as well as different image domain discretisations has been demonstrated. Experiments for the STMR configuration have also been included to show the applicability of this algorithm.
The first part of the procedure involves acquisition of the time domain data in the form of a T matrix, where each column contains the discrete time domain signals received by each receiver. These signals are subject to a one dimensional Fast Fourier Transform, along the time dimension, to represent the given data in the frequency spectra. The image domain is discretized and a reflector is assumed at every point, and the actual distances traveled by the wave from the transmitter to the reflector and the reflector to the receiver are calculated. In case of the STMR array, as shown in Fig. 1, the wave travels a distance TD from transmitter to the imaging point D and a distance DRi back to the receiver. The wave propagation properties vary for direction of TD and the direction of DRi. Thus the appropriate dispersion properties are taken for the respective distances while calculating time of flight. Also the appropriate mode should be chosen for reconstruction.
2. Reconstruction Algorithm The phased addition reconstruction algorithm images the position of reflectors (typically edges and defects) in the image domain. The reconstruction is performed point by point in the domain. In case of circular θ discretization is preferred arrays, R-θ for efficient imaging while X-Y discretization is preferred for linear arrays. For each point taken, the defect is assumed to be located there, and the received signals are back-shifted to the transmitted point and added. If the defect/reflector is located at the point, then the phase addition will be constructive and the resultant signal will resemble the transmitted signal. In other words, there is constructive phase addition at that point which produces a strong signal while at any other point,
Let D be the position of the imaging point given by the co-ordinates ( n1 , n2 ). Let Sj denote the spectra of the signal received by receiver j. Then the spectra of the phase added signal can be found out using the following formulae.
4
Phased Addition Reconstruction In Anisotropic Media
limits its usage to circular systems with polar discretization. However this formulation has the flexibility in these aspects. Also in the previous formulation, distance between the receiver and the defect was approximated as the perpendicular projection of the actual distance on the line joining Transmitter and the defect, which leads to faulty reconstructions in the “near field”, which extends to a radial distance of 3D-4D (D is the diameter of the receiver array). Here, it is taken into consideration that the transmitted and reflected waves are in different directions. Hence different velocities are taken for time of flight calculations. This difference in direction is not high in “far field” whereas there is a large change of angles in the “near field”.
A( f ) = ∑ S j ( f ) × exp(i 2πft pj ) j
where
tpj = TD
v fp1
+ DR
v fp2
Here TD is the distance between the transmitter and imaging point and DR denote distance between imaging point and the receiver. In this case velocity is a function of frequency as well as direction. Hence corresponding to a frequency f, vfp1 denotes the velocity in the direction of TD and vfp2 denotes the velocity in the direction of DR. Backshifting in time, in the frequency domain (using the appropriate velocity for the particular frequency) counters the dispersion that has occurred as the wave travels. Then A is subjected to an Inverse Fast Fourier Transform to give the back shifted and phase added signal B. The image matrix O can be constructed from B using the formulae
3. Simulations Simulations were performed in a quasi-isotropic plate. The dispersion properties were obtained from DISPERSE for this material and used for both the forward model as well as imaging. Let P denote the spectra of the pulse that is used to excite the Transmitter. Then the spectra of the received signal at jth receiver (Qj) as a function of frequency f is given by
O(n1, n2 ) = B(t ) This is plotted in a logarithmic scale (dB Scale) to obtain the reconstructed image. Time of occurrence of peak in the transmitted signal is denoted as t.
Q j ( f ) = P ( f ) × exp( −i 2πft j )
In the case of multiple transmitters, the matrix O is constructed for each transmitter and then final image matrix O is taken as the sum of the individual matrices.
tj = TD
It is noted that the previous phased addition reconstruction algorithms for reconstruction were developed for STMR array specification, and the formulation of the algorithm
NDE-2006
v f1
+ DR
v f2
The velocity is a function of frequency as well as direction. vf1 and vf2 denote the velocity at the frequency f in the corresponding directions. For
5
Phased Addition Reconstruction In Anisotropic Media
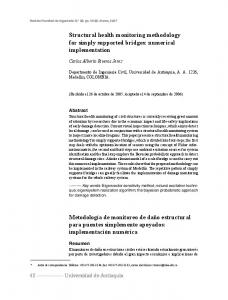
degrees are shown in Fig. 4. A Matec Instruments PR5000 Pulser Receiver was used for exciting the transmitter and receiving the signals. A 20 MHz. Analog-Digital Converter (National Instruments USB 5102) was used for digital signal acquisition. The signals were sampled at 5 MHz and filtered after acquisition using a band pass filter so that high frequency noise and undesirable low frequency components were eliminated. A customized LABVIEW program with additional filters and time averaging was used for saving the signals. The frequency of excitation was chosen to be 200 KHz, in order to minimize the presence of other modes. The S0 mode was used for reconstruction since this was the fastest mode and hence could be time gated. However the direct received A0 mode could not be efficiently time gated because it superimposes with the reflected S0 signals.
simulations S0 mode was chosen and the appropriate dispersion data was used for determining velocities. The signal received by the receiver is the Inverse Fourier transform of the spectra Qj. The T matrix is composed in the same way as described before and is subjected to processing. In the first simulation, the array chosen was the STMR circular array, comprising of a transmitter in the centre of a circular ring of 36 equally spaced receivers at radius 60 mm. Two point defects, one at 0.2 m in 0° direction, and other at 0.3m in 110° direction are chosen. The received signals are simulated as explained above and subject to processing. Fig. 2a shows the reconstructed image. It is noted that both the defects are imaged properly. For comparison, the same is imaged using the “far field” algorithm, as shown in Fig. 2b. The advantages of this algorithm are clearly apparent.
The schematic of the experiment is as shown in the Fig. 5. The array used was a STMR array with a radius of 8 cm and having 24 receivers. It was noticed that the waves traveling in the direction of 90° were comparatively more attenuated because less fibers were aligned along that direction. In imaging for these experiments, the phase added amplitude was multiplied with a weight of r, where r is the radial distance of the imaging point from the centre of the array. This aided in countering radial attenuation. Thus it was possible to capture edges far away from the array without introducing artifacts in the region near the array. The image with this compensation is shown in Fig. 5. The signal received from the array did not contain the signature of the second
In the second simulation, a linear array of transducers is used, which act as transmitter as well as receiver. The transmitters are excited one after another and data is collected at all the receivers. The schematic of the setup is shown in Fig. 3. The reconstructed image, using a Cartesian domain discretization, is also shown in the same figure. This proves the applicability of the algorithm in a general imaging setup.
4. Experiments Experiments were performed on 3.15mm thick graphite-epoxy composite (+45,-45,0,90,0,-45,+45)s. The 3.15 mm thick plate was made using 21 layers of 0.15mm thick graphite fiber. For this case, the dispersion curves at 0 and 90
6
Phased Addition Reconstruction In Anisotropic Media
2. Victorov, I. (1967), “Rayleigh and Lamb waves: Physical Theory and Applications”, Plenum Press, New York.
delamination, probably due to high attenuation. Thus it was not imaged.
5. Conclusions
3. Subbarao, P.M.V., Munshi, P. and Muralidhar, K. (1996) “Performance of Iterative Tomographic Algorithms applied to Non-destructive Evaluation with limited data”, NDT&E, 30(6), 359-370.
In this paper, a new phased addition reconstruction algorithm, based on the conventional SAFT technique has been introduced. This algorithm overcomes the limitation of previous algorithms. It can image defects accurately in the near field as well as far field region of the plate. This algorithm is also flexible and can be used for any array configuration as well as any customized domain discretisations. These advantages were demonstrated using simulations and experiments. A radial weighing method was introduced for imaging in experiments, in order to improve imaging of reflectors positioned far from the array. It is also expected that a similar weighing technique can be developed to counter the angular attenuation in the material.
4. Wilcox, P.D. (2003), “Omni-Directional Guided Wave Transducer Arrays for the Rapid Inspection of Large Areas of Plate Structures”, IEEE Transactions on Ultrasonics, Ferroelectrics and Frequency Control, 50(6), 699-709. 5. Rajagopalan, J., Balasubramaniam, K., and Krishnamurthy, C. V. (2006)” A Single Transmitter Multi Receiver (STMR) PZT Array for Guided Ultrasonic Wave Based Structural Health Monitoring of Large Isotropic Plate Structures” Smart Materials and Structures, 15 (5), 1190-1196.
6. Rajagopalan, J., Balasubramaniam, K., and Krishnamurthy, C. V. (2006) “A phase reconstruction algorithm for Lamb wave based structural health monitoring of anisotropic multilayered composite plates”, J. Acoust. Soc. Am.,Feb,872-878.
6. References 1. Boller, C (2000), “Next generation structural health monitoring and its integration into aircraft design”, Int. J. Syst. Sci, 31,1333–49.
Imaging Point Ri
D
Transmitter
Receivers T
Fig. 1: Schematic and Reconstruction Details for Single Transmitter Multiple Receiver
NDE-2006
7
Phased Addition Reconstruction In Anisotropic Media
(STMR) array system. 0.6 -1 0.4
-2 -3
0.2
-4 ) m ( t si D
0
-5 -6
-0.2
-7 -8
-0.4
-9 -0.4
-0.2
0 0.2 Dist (m)
0.4
0.6
dB
Fig. 2: Reconstruction of simulated defects at 0.2 m in 0° direction and 0.3 m in 110° direction using a) Proposed algorithm b) Far field phased addition algorithm.
Transmitter Placed at centre. 10 Receivers placed on either side of Transmitter
40 cms
12 cms 8 cms
7 cms
21 cms
Fig. 3: Linear array: Schematic and Reconstruction
8
Phased Addition Reconstruction In Anisotropic Media
Fig. 4: Dispersion curve for composite plate along a)0° b)90°
24.5
Delamination
23
43 47.5
14.5 34
NDE-2006
9
Phased Addition Reconstruction In Anisotropic Media
0.6 0.4
-5
Artifact
0.2
) m ( t si D
-10 0 -15
-0.2 Delamination
-0.4
-20
-0.5
0 Dist (m)
0.5
dB
Fig. 5: Schematic and Reconstruction for experiment on a graphite epoxy composite plate.
10