reliance, and to provide a significant technical writing experience. ... Index TermsâEducation, fiber optics, laboratory, laser diodes, laser physics, liquid crystals, ...
194
IEEE TRANSACTIONS ON EDUCATION, VOL. 41, NO. 3, AUGUST 1998
Photonics Laboratory with Emphasis on Technical Diversity Betty Lise Anderson, Senior Member, IEEE, Lawrence J. Pelz, Member, IEEE, Steven A. Ringel, Member, IEEE, Bradley D. Clymer, Senior Member, IEEE, and Stuart A. Collins, Jr.
Abstract—We describe a recently developed laboratory course in photonics aimed primarily at seniors in electrical engineering. Each student performs four out of seven possible experiments during the quarter in changing teams. The experiments were designed with the following goals: expose students to widest possible variety of technologically important topics in optics, allow students the opportunity to use the widest possible variety of laboratory equipment, to foster a healthy respect for potentially dangerous lasers, to encourage individual thinking and selfreliance, and to provide a significant technical writing experience. The experiments themselves are in fiber-optic communication, optical sensing, laser physics, multiple quantum-well detectors, liquid crystals, acoustooptic modulation, and solar cells. We describe here the experiments, the specific equipment needed to perform them, and the structure of our particular course. We also have produced a detailed laboratory manual that is available to other institutions. Index Terms—Education, fiber optics, laboratory, laser diodes, laser physics, liquid crystals, optical sensing, optics, photonics, quantum well, solar cells.
a comprehensive undergraduate optics lab was specifically identified as a needed program that is generally missing from electrical engineering curricula throughout the United States [7]. The SPIE also has conferences devoted to optics education [8]. The Ohio State University has recently made a concerted effort to increase its photonics presence, hiring several new faculty members in the area in recent years and adding new optics-related courses. The Department of Electrical Engineering now offers separate courses in fiber optics, lasers, optoelectronic materials, medical imaging, and coherent optics, all of which are open to both undergraduates and graduates. Of these, only one (coherent optics) has had a laboratory component, even though our department has a high number of laboratory courses in general. We therefore undertook to develop a modern lab course in photonics, aimed at upper level undergraduates (and open to graduate students as well), that would cover state-of-the-art technology in modern engineering-relevant optics.
I. INTRODUCTION
O
PTICS, electrooptics, and optoelectronics, collectively known as photonics, are becoming increasingly important in the engineering world. For example, high-speed data transmission relies on optoelectronic sources and detectors as well as waveguides. The push toward all-optical computing will require electrical engineers to understand the interaction of light with materials, modulation of light, optoelectronic integrated circuits, and integrated optics. Sensing and transduction problems use optical solutions, requiring engineers to understand optical fibers, optical properties of materials, and lasers. Even signal processing tasks and neural networks can be implemented optically. Hence, it is becoming increasingly recognized that there is a critical need in industry for graduates exposed to more photonics topics in the undergraduate curriculum [1]–[5]. In fact, to address this problem, the IEEE TRANSACTIONS ON EDUCATION has devoted a special issue emphasizing the strong need for improved optoelectronics education [6]. In that issue, Manuscript received September 6, 1995; revised May 15, 1998. This work was supported in part by the National Science Foundation, under an Instrumentation and Laboratory Improvement Grant, Award 9351968. B. L. Anderson, S. A. Ringel, B. D. Clymer, and S. A. Collins, Jr. are with the Department of Electrical Engineering, The Ohio State University, 205 Dreese Laboratory, Columbus, OH 43210 USA. L. J. Pelz was with Department of Electrical Engineering, The Ohio State University, 205 Dreese Laboratory, Columbus, OH 43210 USA. He is now with Siemens Telecom Networks, Boca Raton, FL 33487-3527 USA. Publisher Item Identifier S 0018-9359(98)05819-1.
II. OBJECTIVES We had several objectives in developing this course. The first was to give students hands-on experience in the widest possible range of topics in optics. As part of this, we wanted to expose the students to a large selection of optical equipment, so they would have the opportunity to learn about and use spectrometers, lasers, CCD cameras, lock-in amplifiers, detectors, fibers, and so forth. We decided that safety would be stressed and that no one would be allowed to use any of the equipment until he or she had demonstrated adequate knowledge of both the dangers and the safety procedures associated with lasers and chemicals. We also felt strongly that a cookbook style lab would be pointless. We wanted to develop a course in which the students are forced to use the library to get some of the information they need, in which they have the opportunity to explore their own ideas, and in which the goals for the lab are left very general, so each student has to decide to some extent, “What would be meaningful to demonstrate or measure here?” Finally, we decided to make technical writing a large component in the course, since we had observed deficiencies in our students in that area. III. STRUCTURE
OF THE
COURSE
The course is open to seniors, advanced juniors, and graduate students. The prerequisites are semiconductor physics
0018–9359/98$10.00 1998 IEEE
ANDERSON et al.: PHOTONICS LABORATORY WITH EMPHASIS ON TECHNICAL DIVERSITY
(specifically, some basic quantum mechanics, energy-band diagrams, p-n junction theory, and heterojunctions), and dynamic electromagnetics. Ohio State is on the quarter system, and this is a ten-week, four-credit hour course. The students attend one three-hour lab and one hour of lecture per week. The first week of class involves a safety lecture followed by a laboratory demonstration. In this demonstration, we start with a bare table and build up from scratch a couple of setups, for example one to couple a laser beam into an optical fiber. This gives us the opportunity to drive home the laser safety procedures, give the students a feel for some of the optical fixturing equipment (posts, bases, lens holders, fiber chucks, iris diaphragms, etc.), and show them some useful alignment tricks. At this time, all seven of the experiments that will be run in the lab are set up and operating, and students are given some time to look them over and decide which they would be interested in doing. (There is only time in the quarter for the students to do four out of the seven.) After this first class, the students fill out a preference sheet and a schedule is drawn up. There is only one setup per experiment, and all seven are in use at any given time, on a rotating basis. The experiments are done in four two-week cycles beginning the second week. The teams change from cycle to cycle since each student generally has a different list of experiments he or she would like to do. For each experiment cycle, the student must read in advance a chapter of the laboratory manual covering the technology in that experiment. For example, a student doing the acoustooptics lab would read the chapter on acoustooptics. The chapter introduces the fundamentals of (in this case) acoustooptics. There are some homework problems in each chapter to make sure the material has been absorbed, and a library problem. The library problems require the student to find out, on his own, more about the technology in question. For example, the student doing liquid crystals this week might be asked to “Find an example of an application of liquid crystals that is not a display. Explain how it works, and comment on advantages and drawbacks, being sure to discuss competing technologies.” The library problems are typically a couple of pages, the bulk of the time being spent by the students looking at several possible topics before settling on one. They have to show that they understand the article well enough to explain it. When the students arrive in the lab the second week, ready to start their experiments, they find that the benches are bare, and that all the equipment is in the cabinets. The students must decide exactly what equipment they will be needing, how to build and align their particular setup, take care of any calibrations that need to be done (for example, measure the spectrum of a source before using it to measure absorption spectra of other materials). The setup process and fixturing is overwhelming to almost all students, since they have no experience with this equipment. Setting up takes quite a while at first, and the professor and TA walk around providing suggestions and help. By the end of the quarter, however, students are amazingly proficient at it, and can complete their experiments in as little as half the time as needed at the start of the quarter. The experiments themselves are intentionally described to the students in only a general way. For example, we ask the
195
TABLE I LECTURE TOPICS
students to measure the crosstalk in an optical switch, but we do not define crosstalk for them. We require the students to decide what would be a meaningful way to define it for the application in question, and then how to measure it. After the lab is complete, a complete technical report is due. These are based on a model of a monthly report such as might be expected in industry. These reports, as well as the library problems, are graded for technical writing, including grammar, spelling, organization, citations, logic, and scientific worthiness. These are handed back, and one rewrite of each assignment is allowed, the second grade replacing the first. While the writing part of the course proved to be fairly unpopular, the quality of technical writing improved significantly over the course of the quarter, with many later assignments requiring no rewriting at all. During the second offering of the course (when statistics were kept), 44 out of 75 assignments were rewritten, with the average grade over all writing assignments increasing from 75% to 85%. These figures include assignments not rewritten. The lectures in the course are not intended to cover the theory corresponding to the experiments; that theory is learned by the students on their own from the manual and the library. For one thing, students are all doing different experiments at different times, so if we lectured on solar cells the seventh week of the quarter, for example, it would be too late to be of any use to at least two teams. Also, not all students will even do the solar cell experiment. Rather, we decided to use the lectures as an opportunity to discuss general topics in optics not specifically covered in the labs. For example, Table I shows the list of topics discussed during the last offering. IV. THE EXPERIMENTS There are presently seven experiments in the course. The experiments themselves are described below. The specific learning objectives associated with each individual experiment are listed in Table II. A. Fiber-Optic Communication Fiber optics is probably the single most widespread use of optics in technology. Here, students look at how various
196
IEEE TRANSACTIONS ON EDUCATION, VOL. 41, NO. 3, AUGUST 1998
TABLE II LEARNING GOALS ASSOCIATED WITH EACH EXPERIMENT
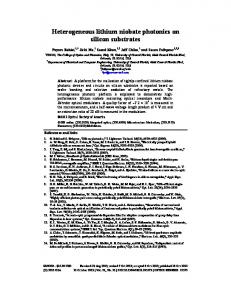
Fig. 1. Fiber-optic communication experiment. During the second part of the experiment, the source and detector are replaced with a pigtailed LED transmitter module and detector module that are part of the bit-error-rate tester (not shown).
types of fiber misalignment (lateral, longitudinal, and angular) affect splice loss, as shown in Fig. 1. Students assemble two different fiber-optic links. In the first, they couple a laser beam into a bare fiber (step-index, multimode) using a microscope objective lens and a bare fiber chuck. In order to do this, they must learn how to strip and cleave the fiber, and judge the cleave quality. A photodetector is used to measure the coupling efficiency as adjustments are made. Then the students break the fiber, cleave the ends, and butt-join the two ends. Next, they build a second link using an in-house-built bit-error-rate (BER) tester with an LED source. The BER tester puts out a 1-MHz pseudorandom bit stream and compares the transmitted stream with the detected stream. The source and detector are commercially available fiber-pigtailed transmitter and detector, with fiber-optic connectors on the back panel of the BER tester. Students examine the BER as a function of splice loss. In fact, this part does not work so well because the BER is exponential in received power, so there is only a tiny range over which any meaningful measurements can be taken. Nevertheless, they learn about the difficulties is measuring both extremely high and not unusually low BER’s. The difficulty in the latter is that for a statistically significant rate to be measured, at least 100 errors must be detected, which can take several days at this data rate. The students also quickly realize that vibrations in the room can interfere with the measurements, and they invariably move the setup to a vibration-isolated optical table.
Specific equipment: low-power HeNe laser (could be any source, really), fiber chucks, fiber-chuck holders, microscope objective, photodetector and amplifier, fiber inspection microscope (not strictly necessary but very helpful), bit-error-rate tester (built in house for about $40, schematics available), vibration-isolated table, translation and rotation stages with Vernier micrometers. B. Optical Sensing Optical sensing is a fast-growing technological area, and is particularly important in environments where electrical devices cannot be used, for example, in explosive environments, or high-voltage and electrically noisy places. This is the most open-ended of the experiments. Students are asked to choose a measurand (temperature, pressure, etc.), figure out a way to measure it optically, implement the design, calibrate it, and report on its resolution, accuracy, linearity, and repeatability. There are no other restrictions, and typically students go through a couple of iterations of improvement on their designs. For example, one group wanted to measure the fluid level in a fuel tank, a problem he encountered on a co-op job. He and his team built a primitive on/off sensor that used a fiber link with a gap, and exploited the changing coupling efficiency across the gap due to the refractive-index difference between the fuel and air. Subsequent iterations involved changing the “fuel,” changing the type of fiber, and experimenting with different gap lengths. Another group built a temperature sensor that used mercury—they put a drop of mercury in the well of a concave lens, and shone a beam from a fiber through the lens. The drop expanded with temperature, blocking more and more of
ANDERSON et al.: PHOTONICS LABORATORY WITH EMPHASIS ON TECHNICAL DIVERSITY
197
the Bragg angle. Thus on the first pass many did not have data that matched the theory. Specific equipment: Acoustooptic cell, crystal driver, power supplies for driver, rotation stage (a good one), two HeNe lasers, radiometer or photodetector. D. Multiple-Quantum-Well Detectors
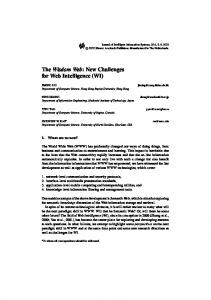
Fig. 2. An acoustooptic optical switch, in which the beams are exchanged spatially (or not) depending whether the acoustic wave is applied to the crystal.
the beam. Another group was interested in measuring seismic activity (again, the result of a co-op experience). Despite our warning to avoid an interferometric sensor because they are touchy and difficult, this team built a sensor that could detect conversations from across the room and display them on an oscilloscope, even though the sensor was sitting on a vibration-isolated table! There is no requirement that any of these sensors be practical, but they do give the students some chances to experiment and play around, and of course become masters of scrounging. Specific equipment: varies from group to group, depending on what they want to do. We expect the students to do some advance planning, and borrow equipment (like pressure gauges) and materials (like antifreeze) from other labs and departments where possible; they also bring things from home frequently. One comment: it was very useful to have fat plastic fiber around; this got used a lot. Anyone planning to run a similar experiment should plan to have a couple of light sources around, detectors, fibers, lenses, and fixturing on hand. C. Acoustooptic Modulation Acoustooptics devices are used in a wide variety of applications, including laser printers, optical spectrum analysis, switching, scanning, and heterodyning applications. Students explore the acoustooptic effect, demonstrating spatial scanning of a beam (by varying the frequency of the acoustic wave) as well as measuring the Bragg angle and looking at diffraction efficiency. Once students have got the hang of aligning the crystal, they build an optical switch using two lasers, whose beams are either exchanged or not depending on the state of the acoustooptic cell, Fig. 2. The possible utility of this approach in optical computing is examined by measuring the crosstalk. As mentioned earlier, the desired crosstalk is not defined, but rather students are required to decide what are appropriate measurements to describe the usefulness of the switch. This experiment seemed to be straightforward for the students, the biggest difficulty being the alignment. One error that occurred frequently was in measuring the Bragg angle, students usually measured the angle between the zero-order and first-order beam, forgetting to divide that by two to get
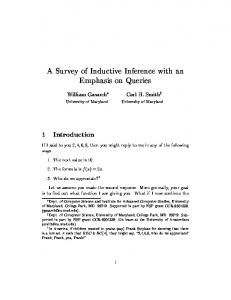
We chose multiple-quantum-well (MQW) devices for an experiment because of their widespread application in lasers, photodetectors, and integrated optoelectronics devices. Students are given three different, and unidentified, semiconductor devices, and asked to identify of what material they are made and whether they are bulk or MQW devices. They do this on the basis of the absorption spectra, measured using a spectrometer, a high-intensity broadband source, a chopper, and a lock-in amplifier to measure the photogenerated current, Fig. 3(a). The circuit diagram used to measure the photocurrent is shown in Fig. 3(b). The devices used are actually a silicon photodiode, a GaAs LED, and an MQW detector. The MQW device exhibits an exciton peak just below the bandgap energy (just above in wavelength). The observation of the exciton peak is generally the first direct confirmation of a quantum effect in the students’ experience, and, of course, is the give-away that they are looking at the MQW device, since bulk devices will not show excitons at room temperature. The GaAs LED has a mysterious peak just below the bandgap (in energy), and we usually have to eventually tell the students that it is due not to a band-toband transition but involves a state in the gap (these states are commonly used in LED’s to increase the efficiency). The responsivity for both of the devices is fairly high, despite the chips being small compared to the Si diode. No particular features of the Si diode’s spectrum are visible, since the spectrometer has a range of only 300–1000 nm which is not near the bandgap of silicon. Also, the responsivity is low despite the huge size of the chip, so those two things together tell the students it is probably the Si diode. Once the identifications have been made, the students then return to the multiple-quantum-well devices, and demonstrate the quantum-confined Stark effect, which causes a shift in the exciton energy under applied electric field (the cell is reverse-biased so that high fields appear across junction). In their reports, they are expected to comment on the extinction ratios they would get using the device as an electroabsorption modulator. Specific equipment: chopper, lock-in amplifier, spectrometer, broadband light source (we use a 300-W bulb from an overhead projector; caution, use a fan), semiconductor devices, power supply for Stark effect. The MQW devices are not yet commercially available, but ours were very generously donated by Bell Northern Research in Canada. E. Solar Cells Solar cells are important as power sources for portable instruments and satellites. We also chose this experiment as a way to include the topic of detection explicitly. Here again the students are given several unidentified devices and expected
198
IEEE TRANSACTIONS ON EDUCATION, VOL. 41, NO. 3, AUGUST 1998
(a)
Fig. 4. In the solar simulator shown, the “sun” is a 300-W light bulb such as are used in overhead projectors. A fan is required to keep the unit from overheating. The vacuum pump that keeps the chips securely on the probe table is not shown.
This experiment generally goes quickly, and we expect to add a component involving the driving of a load using a recently donated solar-cell panel. Specific equipment: probe station, solar simulator (ours is made using a 300-W overhead projector bulb with a fan, mounted over a vacuum-held probe station), vacuum pump, curve tracer, variable transformer.
(b) Fig. 3. (a) The experimental setup for the quantum-well experiment. (b) Schematic for measurement (quantum-well experiment). The voltage source is used to apply a reverse bias to the quantum well devices for observation of the quantum-confined Stark effect. The supply is not necessary for the other devices.
to identify them based on their measurements. We have an in-house built solar simulator built onto a probe station, and the “sun’s” intensity can be controlled by a variable transformer, Fig. 4. The students measure the current–voltage characteristics using a curve tracer under varying lighting, and , the short-circuit current from the open-circuit voltage , and the fill factor, they can reason out the identity of the devices. They can support their deductions by observing the metallization pattern, since short-carrier-lifetime materials require a closely spaced metallization grid pattern, at the expense of blocking more of the light. Presently, we are using an amorphous Si cell, a polycrystalline Si cell, a GaAs cell, and a standard polycrystalline Si calibration cell whose and are already known at a particular sunlight level. Some of the devices have antireflection coatings, and some do not; students determine this as well.
F. Laser Diode Physics Laser diodes are widely used in compact disk players, fiberoptic systems, and many other applications. We selected these to demonstrate laser physics because they are cheap and easy to use, and because we could throw in the thermoelectric cooler as a learning experience. The students mount the electrostatic discharge (ESD)-sensitive laser into a mount using an ESD mat and wrist strap. After measuring the power–current curve, students look at the differences between spontaneous and stimulated emission. In particular, they observe the intensity change at threshold and the change in the spectral width below and above threshold. The setup is shown in Fig. 5. It was intended that they also see the change in the directionality of the stimulated emission over the spontaneous, but since the laser beam is so divergent and must be collimated, and since the intensity is changing dramatically, this turned out to be hard to see qualitatively. After noting the gain curve (spontaneous emission spectrum), someone casually remarks to the students that are they really sure it is a single-longitudinal mode laser? It turns out, of course, that it is oscillating in several longitudinal modes, but they will not see it unless they really close the slits down on the spectrometer to maximize the
ANDERSON et al.: PHOTONICS LABORATORY WITH EMPHASIS ON TECHNICAL DIVERSITY
199
(a) Fig. 5. The equipment used in the laser diode physics experiment. The static mat and wrist straps are not shown; they are only needed while the diode is actually being installed in the mount.
resolution (and unfortunately minimize the throughput). From the mode spacing they can also calculate the chip length. The students are also asked to demonstrate that the Fabry–Perot cavity resonant frequencies change as the mirror spacing is changed. The only way to move the facets on the chip is to change the crystal temperature, causing the students to learn to use the thermoelectric cooler and thermistor. Specific equipment: spectrometer, laser-diode driver, thermoelectrically cooled laser diode mount, static map and wrist straps, radiometer. G. Liquid Crystals Liquid-crystal devices are used primarily for displays but also have some optical switching applications. The addition of this experiment allowed us to teach the students about birefringence and states of polarization. Students fabricate a liquid-crystal light shutter, using cleaned indium–tin–oxidecoated (ITO) glass and a Mylar spacer to make a cavity, and injecting liquid-crystal material. The cell is held together with binder clips (Fig. 6(a)), and is not sealed, so these cells last a couple of days. Detailed instructions on the cell fabrication are in the laboratory manual, available from the authors. An electric field is applied from a function generator via alligator clips, and an ac source is used to prevent the electrodes from deplating. When polarizers are placed before and after the cell, it acts as an on/off switch depending on the applied electric field. The students compare the contrast of this home-made cell to the contrast of a commercial display (in our case, a reflective display). For the reflective case, we also ask them to look at the viewing angle, a request that is actually nontrivial since it requires eliminating all ambient light, and controlling the angle of the incident and reflected light carefully. In our particular lab we use a charge-coupled device (CCD) video camera and laser-beam analyzer to analyze the images,
(b) Fig. 6. (a) Assembly of the liquid-crystal cell. A U-shaped Mylar spacer is clamped between two specially cleaned pieces of glass with the conductive coatings on the inside. The liquid-crystal material is injected into the cavity, and electrical connections are made with alligator clips. (b) The setup for the liquid-crystal experiment.
Fig. 6(b), and compare the relative brightness of various points on the display. Students are asked to demonstrate Malus’s law (which says that the light transmitted through two polarizers is proportional to the cosine of the angle between their axes) as a way to get started, since this helps them realize they will have problems with ambient light, and that they will need a diffuser to even out the light. Specific equipment: ITO glass (can be obtained from a number of sources, including Thin Film Technology and Cerac, Inc.), liquid crystal (obtained from Merck Industries), ultrasonic cleaner, fume hood, polarizers, light source, diffuser, function generator, detector (we use a CCD camera and laserbeam analyzer).
200
IEEE TRANSACTIONS ON EDUCATION, VOL. 41, NO. 3, AUGUST 1998
TABLE III NUMBER OF STUDENTS MAKING PARTICULAR COMMENTS IN EVALUATION FORMS AFTER EACH OFFERING
not enjoy doing the library problems, and did not hang around trying out ideas when the lab goals had been completed. On the other hand, most students seemed to enjoy being challenged and being given engineering freedom. One wrote (in the evaluations): This is one of the best learning experiences I’ve had while in college. I was very encouraged to strike out on my own and explore areas of my own personal interest.
V. RESULTS The course has been offered twice, to date. The course has a teaching assistant and a professor present during the laboratory hours (3 h a week per section). Although we can handle 21 students (assuming three per each of seven stations), enrollment has been lower, partially because of a recent curriculum change that made technical electives slightly less elective. There were 13 students the first offering, and 12 the second. Of these 25 students, 2 were graduate students. We obtained student response to the course in three ways: First, we passed out mid-quarter questionnaires asking for specific and anonymous feedback. Second, we relied on the student teaching evaluation forms passed out at the end of every course; these ask several questions pertaining to the course itself. Third, we asked the students in casual conversations what suggestions did they have, how was the course going, etc. In addition to the student evaluations, we make some instructor’s observations. Starting with the student feedback, only one mid-course questionnaire was returned; the student suggested we add some sort of load to the solar cell experiment so that students could see the cells power something, an excellent suggestion. A nontrivial suggestion, too, since the cells are too small to power much of anything. We recently acquired a solar-cell panel through a donation from Rockwell, and we plan to put this on the roof and add this dimension. After the first offering, 10 students responded to the end-ofcourse evaluation, although only 7 made comments relevant to the course. The second offering, 9 students responded to the questionnaire but only 5 made comments relevant to the course. The comments are tabulated in Table III. Several changes were made after the first offering: the manual was reorganized and many typographical errors corrected. Also, the library problems were reduced for some of the experiments, and they were counted for a higher percentage of the students’ grade. Our experience during the classes was that in general, a particular student either liked being asked to figure things out on his or her own or else did not. A few (but only a few) expressed disappointment or frustration when confronted with generalized lab goals rather than specific recipes. Those preferring to be told what to do also tended to be those that did
Others expressed their enjoyment of their course informally—one student remarked on the first day of class, when he first saw the lab, “I feel just like a kid in a candy store!” Another student decided at the last minute to pursue graduate school because, he said, he had not found anything in electrical engineering that he really liked until he took this course (and our fiber optics course). Concerning the last item in Table II, several students asked for permission to come back and do the missed experiments as independent study, and these are ongoing during the quarters the course is not offered (in fact, even when it is, with clever scheduling). One student even offered, even though he had already graduated, to help paint the lab in exchange for permission to do another experiment. VI. SUMMARY
AND
CONCLUSIONS
A new photonics laboratory course was developed, with experiments in fiber optics, optical sensing, laser diode physics, liquid crystal, multiple-quantum-well detectors, acoustooptic modulation, and solar cells. Students choose four out of the seven to perform. There is one setup for each experiment, and all experiments are running all the time, with the students cycling among them. Experiments were designed to give the widest possible exposure to both optical technologies and optical equipment, and enable a student to become well versed in diverse optical skills. Strong emphasis was placed on safety, independent thinking, and technical writing. By and large the course is very popular with the students, particularly the more mature ones. We have observed dramatic improvements in optical lab skills, from zero to competence in 10 weeks, and marked improvement in technical skills as well. Students have been very diligent about observing sound safety practices. All of the experiments seemed to be equally popular. The quantum well experiment seemed to be the most difficult, but no experiment required any student to spend more than 3 h on two separate days to complete. The solar cell experiment as described here is too short, and was invariably completed in about 2 h. The students saw the instructors formally for 4 h a week (one 3-h lab and one 1-h lecture). They occasionally came during office hours to ask questions but did in fact rely primarily on the lab manual and the library. We do not have actual data but estimate from talking to the students that the average student spent about 10–12 h a week outside of class. This time was primarily used in writing the lab reports and researching the library problems. A laboratory manual containing an introduction to the theory relevant to each of the experiments was produced. This 288-
ANDERSON et al.: PHOTONICS LABORATORY WITH EMPHASIS ON TECHNICAL DIVERSITY
page manual also contains a chapter on laser safety, homework problems, library problems, principles of operation of lockin amplifiers, spectrometer, bit-error-rate testers, and so forth. Copies of the manual are available from the authors for the cost of copying and mailing. Incidentally, the figures in this paper are not in the manual—the students devise their own setups (with friendly suggestions from the instructors when appropriate). The current experiments were chosen based on their technological importance and the expertise of the faculty. We plan to add two more experiments, one on holography and one on optical spatial filtering.
VII. BIBLIOGRAPHY For background material on each of the optical technologies, please see: Laser Safety: J. A. Smith, Laser Safety Guide, 8th ed. Orlando, FL: Laser Inst. of America, 1992. A. Mallow and L. Chabot, Laser Safety Handbook. New York: Van Nostrand, 1978. D. C. Winburn, Practical Laser Saftey, vol. 11. New York: Marcel Dekker, 1986. O. J. McAteer, Electrostatic Discharge Control. New York: McGraw-Hill, 1990. Fiber Optics G, Keiser, Optical Fiber Communications, 2nd ed. New York: McGraw-Hill, 1991. Optical Sensing E. Udd, Fiber Optic Sensors: An Introduction for Engineers and Scientists. New York: Wiley, 1991. Acoustooptics B. E. A. Saleh and M. C. Teich, Fundamentals of Photonics. New York: Wiley, 1991. Multiple-Quantum-Well Detectors B. E. A. Saleh and M. C. Teich, Fundamentals of Photonics. New York: Wiley,1991. Solar Cells M. A. Green, Solar Cells. Englewood Cliffs, NJ: PrenticeHall, 1982. A. L. Fahrenbruch and R. H. Bube, Fundamentals of Solar Cells. New York: Academic, 1983. B. E. A. Saleh and M. C. Teich, Fundamentals of Photonics. New York: Wiley, 1991. Laser Diode Physics B. E. A. Saleh and M. C. Teich, Fundamentals of Photonics. New York: Wiley, 1991. J. T. Verdeyen, Laser Electronics. Englewood Cliffs, NJ: Prentice-Hall, 1989.
201
Liquid Crystals B. E. A. Saleh and M. C. Teich, Fundamentals of Photonics. New York: Wiley, 1991 ACKNOWLEDGMENT This lab was supported under a Laboratory and Instrumentation Grant from the National Science Foundation. We would also like to thank the following companies for their generous donations to this lab: Bell Northern Research, Corning, Rockwell International Corporation, and Spiricon, Inc. REFERENCES [1] C. M. Penney and M. G. Jones, “Commercial/industrial lasers in a demanding environment,” IEEE Potentials Mag., pp. 29–34, 1985. [2] W. T. Cathey, “Recommendations for optoelectronics education,” Opt. Phot. News, pp. 15–18, 1991. [3] A. A. Bergh, “American optoelectronics: Pavement for a bumpy economic road,” IEEE Circuit Devices, pp. 32–38, May 1990. [4] S. M. Lord, “A new approach to teaching electronics: content and methodology,” in Proc. 24th Conf. Frontiers in Education, 1994, pp. 146–150. [5] J. Corones, “Fiber optic experiments for electrical/optical engineering technology laboratories,” in Proc. 24th Conf. Frontiers in Education, 1994, pp. 123–1127. [6] W. T. Cathey, Ed., IEEE Trans. Educ. (Special Issue on Optoelectronics Education), vol. 35, pp. 101–143, 1992. [7] J. C. Palais, N. C. Gallagher, and H. Stark, “Photonics enrichment of the EE curriculum,” IEEE Trans. Educ., vol. 35, pp. 103–108, 1992. [8] See, for example, Proc. SPIE Conf. Education in Optics, vol. 2525, 1995.
Betty Lise Anderson (S’75–M’79–SM’95) received the B.S. degree in electrical engineering from Syracuse University, Syracuse, NY, in 1978, and the M.S. and Ph.D. degrees from the University of Vermont, Burlington, in 1988 and 1990, respectively, both in materials science/electrical engineering. Between receiving the B.S. degree and attending graduate school, she worked at Tektronix in Oregon, and GTE Laboratories and Draper Laboratories in Boston. She is an Associate Professor at The Ohio State University, Columbus, where she has been since 1990. Her current research interests include coherence and modal properties of lasers, semiconductor optical devices, optical true time delay systems, and fiber optic sensors. Her web page can be viewed at http://eewww.eng.ohio-state.edu/ anderson.
�
Lawrence J. Pelz (S’92–M’95) received the Ph.D. degree in electrical engineering from The Ohio State University, Columbus, in 1996. He was with Sprint’s Technology, Planning and Integration group where he directed research into emerging optical communication technologies. He is currently a Distinguished Member of the Technical Staff at Siemens Telecom Networks and is involved in the development of ultrahigh capacity optical transport products.
Steven A. Ringel (S’84–M’91) received the B.S. degree in electrical engineering and the M.S. degree in engineering science from the Pennsylvania State University, University Park, in 1984 and 1986, respectively, and the Ph.D. degree in electrical engineering from the Georgia Institute of Technology, Atlanta, in 1991. In 1991, he joined the faculty in the Department of Electrical Engineering at the Ohio State University, Columbus, where he is currently an Associate Professor. He developed and directs the Ohio State Molecular Beam Epitaxy facility as well as the electronic and photovoltaic materials research labs. His research interests include growth of compound semiconductor heterostructures by molecular-beam epitaxy for basic studies and for optoelectronic devices; III-V photovoltaics for space applications; defects in lattice-mismatched materials and in wide-bandgap semiconductors; integration of highly dissimilar electronic materials; thermophotovoltaics; and interdisciplinary aspects of electronic materials education. He has published over 90 papers in these areas, including one patent and two book chapters. Dr. Ringel is a recipient of the National Science Foundation National Young Investigator Award, in 1994.
202
Bradley D. Clymer (M’88–SM’91) received the B.S.E.E. and M.S. degrees in electrical engineering from The Ohio State University, Columbus, in 1981 and 1982, respectively, and the Ph.D. degree in electrical engineering from Stanford University, Stanford, CA, in 1987. From 1981 to 1983 he worked in the Advanced Subsystems Department of Hughes Aircraft Company Space and Communications Group in El Segundo, CA. He presently holds the position of Associate Professor of Electrical Engineering at The Ohio State University. His current research activities are medical imaging and image processing, digital processing of biological signals, mathematical models of human hearing perception for robotic control, optical interconnects, Fourier optics, crossbar switching systems, and linear systems.
IEEE TRANSACTIONS ON EDUCATION, VOL. 41, NO. 3, AUGUST 1998
Stuart A. Collins, Jr. did his undergraduate work in physics at St. Lawrence University, Canton, NY, and received the Ph.D. degree from the Massachusetts Institute of Technology, Cambridge, both in physics. He worked at Sperry Gyroscope Company for six years before coming to The Ohio State University, Columbus, in 1964. He retired in 1992 but still has a strong presence there. His areas of interest include teaching, atmospheric propagation of light (refractive index effects), electromagnetic theory of optics, optical computing, and the application of photonics to the control of phased-array radars.