Physicochemical characterization and solubility enhancement studies of allopurinol solid dispersions Jagdale Swati Changdeo, Musale Vinod , Kuchekar Bhanudas Shankar, Chabukswar Anuruddha Rajaram Maharashtra Academy of Engineering and Educational Research, Maharashtra Institute of Pharmacy, Maharashtra, India
Allopurinol is a commonly used drug in the treatment of chronic gout or hyperuricaemia associated with treatment of diuretic conditions. One of the major problems with the drug is that it is practically insoluble in water, which results in poor bioavailability after oral administration. In the present study, solid dispersions of allopurinol were prepared by solvent evaporation, kneading method, co-precipitation method, co-grinding method and closed melting methods to increase its water solubility. Hydrophilic carriers such as polyvinylpyrrolidone, polyethylene glycol 6000 were used in the ratio of 1:1, 1:2 and 1:4 (drug to carrier ratio). The aqueous solubility of allopurinol was favored by the presence of both polymers. These new formulations were characterized in the liquid state by phase solubility studies and in the solid state by differential scanning calorimetry, powder X-ray diffraction, UV and Fourier Transform Infrared spectroscopy. Solid state characterizations indicated that allopurinol was present as an amorphous material and entrapped in polymer matrix. In contrast to the very slow dissolution rate of pure allopurinol, the dispersion of the drug in the polymers considerably enhanced the dissolution rate. Solid dispersion prepared with polyvinylpyrrolidone showed highest improvement in wettability and dissolution rate of allopurinol. Mathematical modeling of in vitro dissolution data indicated the best fitting with Korsemeyer-Peppas model and the drug release kinetics primarily as Non-Fickian diffusion. Therefore, the present study showed that polyvinylpyrrolidone and polyethylene glycol 6000 have a significant solubilizing effect on allopurinol. Uniterms: Allopurinol. Polyethylene glycol 6000. Solid dispersions. Closed melting method. Dissolution enhancement. Alopurinol é fármaco comumente utilizado no tratamento de gota crônica ou hiperuricemia associada com o tratamento em condições diuréticas. Um dos maiores problemas com o fármaco é que este é praticamente insolúvel em água, o que resulta em baixa biodisponibilidade na administração oral. No presente estudo, dispersões sólidas de alopurinol foram preparadas pela evaporação do solvente, pelos métodos de amassamento, de coprecipitação, de comoagem e fusão fechada para aumentar sua solubilidade em água. Transportadores hidrofílicos, como polivinilpirrolidona, polietilenoglicol 6000 foram utilizados nas proporções de 1:1. 1:2 e 1:4 (fármaco: transportador). A solubilidade aquosa do alopurinol foi favorecida pela presença de ambos os polímeros. Estas novas formulações forma caracterizadas no estado líquido pelos estudos de solubilidade de fase e no estado sólido pela calorimetria diferencial de varredura, difração de Raio-X, espectroscopia de UV e de IV com transformada de Fourier. As caracterizações do estado sólido indicaram que o alopurinol estava presente como material amorfo e embebido em matriz polimérica. Ao contrário da velocidade de dissolução lenta do alopurinol puro, a dispersão do fármaco nos polímeros aumentou consideravelmente a taxa de dissolução. A dispersão sólida preparada com polivinilpirrolidona mostrou as maiores melhorias na molhabilidade e taxa de dissolução do alopurinol. A modelagem matemática dos dados da dissolução in vitro indicou o melhor ajuste ao modelo de Korsemeyer-Peppas e a cinética de liberação do fármaco primariamente como difusão não-Fickiana. Assim, o presente estudo mostrou que a polivinilpirrolidona e o polietilenoglicol 6000 têm efeito significativo na solubilização do alopurinol. Unitermos: Alopurinol. Polietilenoglicol 6000. Dispersões sólidas. Método de fusão fechada. Aumento da dissolução. *Correspondence: Dr. Swati C. Jagdale. Department of Pharmaceutics, MAEER’s Maharashtra Institute of Pharmacy, S.No 124, MIT Campus, Kothrud, Pune - 411 038, Maharashtra, India. E-mail:
[email protected]
Article
Brazilian Journal of Pharmaceutical Sciences vol. 47, n. 3, jul./sep., 2011
514
INTRODUCTION Allopurinol (ALLO), chosen in the current study, is a poorly water-soluble drug known to demonstrate limited dissolution- or solubility-limited absorption (Ahuja et al., 2003). Based upon aqueous solubility and various dissolution parameters, several methods have been employed to improve the solubility of poorly water soluble drugs including increasing the particle surface area available for dissolution by milling (Habib et al., 1985) improving the wettability with surfactants or doped crystals, (Chow, 1995) decreasing crystallinity by preparing a solid dispersion (Flego, 1988), use of inclusion compounds such as cyclodextrin derivatives (Pitha, 1985), use of polymorphic forms or solvated compounds (Sekiguchi, 1973), and use of salt forms. The enhancement of the bioavailability of poorly water-soluble drugs is one of the greatest challenges of drug development and several pharmaceutical technologies have been investigated to this end. Amongst them is the solid dispersion of one or more active ingredients in inert carriers at solid state prepared by fusion, solvent, or solvent-fusion methods (Damian et al., 2000). In solid dispersions, the particle size of the drugs was reduced, and the wettability and the dispersibility of the drugs were enhanced. Consequently, drug dissolution was improved markedly (Craig, 2002). Solid dispersion is a promising approach to improve the dissolution and bioavailability of hydrophobic drugs (Abdul-Fattah et al., 2002). Hydrophilic polymers have been commonly used as carriers for preparing solid dispersions. Among them, polyvinylpyrrolidone (PVPk30) has been widely employed for its high aqueous solubility, high physiological tolerance, and low toxicity. Polyethylene glycols (PEGs) are semi crystalline polymers that have been used extensively in solid dispersion preparations for their wetting, solubilizing and surface active properties (Sethia et al., 2004). In recent years, interest in incorporating a surfaceactive carrier into solid dispersion has increased greatly and a high improvement in drug dissolution was reported (Serajuddin, 1999; Pathak et al., 2008). This approach has been reported to enhance the solubility, dissolution and bioavailability of many poorly water soluble drugs using various techniques including melting agglomeration and melting. The present study was planned to improve the aqueous solubility and dissolution rate of ALLO by preparing the solid dispersion with polyethylene glycol 6000 (PEG 6000) and PVPk30 employing various methods such as solvent evaporation (SE), co-precipitation (CP), co-grinding (CG), kneading (KN) and the closed melting method (CM). The study further aimed to characterize the
S. C. Jagdale, V. Musale, B. S. Kuchekar, A. R. Chabukswar
interaction of ALLO with PEG 6000 and PVP K30 in the solid state by Fourier Transform Infrared Spectroscopy (FTIR), Differential Scanning Calorimetry (DSC), and Powder X-Ray Diffraction (PXRD) to check the dissolution behavior of solid dispersions.
MATERIAL AND METHODS Material
Allopurinol (ALLO) was kindly supplied by Nicolas Piramal, (Pitampur, India) and PVPk30 was obtained from Oxford Laboratory (Mumbai, India). PEG 6000 was purchased from Analab Fine Chemicals (Mumbai, India). All other chemicals and solvents were of analytical reagent grade. Freshly prepared distilled water was used throughout the study. Methods Phase solubility studies Solubility measurements were performed in triplicate using the method reported by Higuchi and Connors (Higuchi et al., 1965). An excess amount of ALLO was added to the aqueous solutions of each carrier containing increasing concentrations of the individual carrier (i.e., 0, 1, 5, and 10 % w/v). The flasks were then maintained at 25 °C for 7 days with continuous stirring by a magnetic stirrer. The saturated solution was sonicated for 20min. and then centrifuged; the supernatant were filtered through a whatman filter paper no. 1. The filtrate was suitably diluted and analyzed spectrophotometrically at λmax 250 nm on a Varian carry 100, UV–Vis Spectrophotometer, Australia (Ahuja et al., 2007). Preparation of physical mixture and solid dispersions
· Physical mixtures (PM) For the sake of comparison, physical mixtures (PM) of ALLO were prepared by mixing accurately weighed amounts of ALLO with carriers (ratio of drug: carrier was 1:1, 1:2 and 1:4) in a mortar by simple trituration. · Solvent evaporation method (SE) SDs were prepared by dissolving accurately weighed amounts of ALLO and PEG 6000 in ethanol. After complete dissolution of ALLO and PEG 6000 in ethanol the solution was sonicated for 20 minutes, and then solvent was evaporated under reduced pressure at room temperature in a dessicator. Subsequently, the solid mass was ground through sieve no. 40. The sieved
Physicochemical characterization and solubility enhancement studies of allopurinol solid dispersions
ground powders were kept in an oven for 48 hrs at 60 ºC (George et al., 2006). · Co-grinding method (CG) ALLO was triturated with the minimum quantity of ethanol in a glass mortar until dissolved. PEG 6000 was then added and the suspension triturated rapidly at room temperature until the solvent evaporated. The resulting powder was passed through sieve no 40 (Nokhodchi et al., 2007). · Kneading method (KN) A mixture of ALLO and PEG 6000 was wetted with water and kneaded thoroughly for 30 minutes in a glass mortar. The paste formed was dried under vacuum for 24 hrs. Dried powder was passed through sieve no. 40 and stored in a dessicator until further evaluation (Modi et al., 2006). · Co-precipitation method (CP) SDs were prepared by dissolving accurately weighed amounts of PEG 6000 in water and drug in ethanol. After complete dissolution, the aqueous solution of the carrier was then poured into the ethanolic solution of the drug. The solvents were then heated and evaporated under reduced pressure at room temperature in a dessicator. Subsequently, the solid dispersions were passed through sieve no. 40 and kept in an oven for 48 hrs. at 60 ºC (Dixit et al., 2007). · Closed Melting method (CM) One gram of physical mixture of PEG 6000 was weighed into glass ampoules (20 ml) which were sealed and then heated for 30 minutes in a water bath to prepare the solid dispersions. After slow cooling, the ampoules caps were opened and the solid dispersions collected. All dispersions were pulverized with a pestle and mortar, passed through sieve no. 40 and dried in an oven for at least 48 hrs. at 60 ºC (Hasegawa et al., 2005). Similar procedures were carried out to prepare solid dispersions containing PVP K30. Due to the hygroscopic nature of PVP K30 sticky lumps are formed by CP and CM methods. Therefore, these solid dispersions are not applicable for evaluation and characterization studies. Characterization of solid dispersions
All the formulations were evaluated by phase solubility studies and in-vitro dissolution studies. Solid dispersions are also characterized by UV, FTIR, DSC and PXRD analysis.
515
· Fourier Transform Infrared spectroscopy (FTIR) studies FTIR spectra of pure ALLO, PVP, PEG, solid dispersions and physical mixture were recorded on a 640 IR, Varian device, Australia, using the KBr pellet method involving trituration of 10 mg of solid dispersions with 10-20 mg of dry KBr powder and filling of pellets with this for scanning at 4000 to 400 cm-1. · UV-Visible Spectroscopy UV-Visible Spectroscopy was performed by weighing solid dispersions accurately and dissolving in dilute NaOH solution, sufficiently diluting with distilled water to produce a final concentration of 10 µg/ml (Londhe et al., 1999). These solutions were scanned spectrophotometrically in the UV region at 260 nm on a Varian carry 100, UV–vis Spectrophotometer, Australia. · Differential Scanning calorimetry (DSC) studies A differential scanning calorimeter (DSC-823e, Mettler Toledo, Switzerland) was used to obtain the DSC curves of ALLO, its physical mixtures and solid dispersions. About 10mg of sample was weighed in a standard open aluminum pan, and scanned from 20-450 °C at a heating rate of 10 °C/minute while being purged with dry nitrogen (Samy E.M., 2000). · Powder X-ray diffractometry (PXRD) studies Powder X-ray diffraction (PXRD) patterns were traced employing an X-ray diffractometer (Philips PW 1729 Netherlands.) for all the samples, using an Ni filter, Cu K (α) radiation, a voltage of kV, a current of 20 mA and a receiving slit of 0.2 inches. The samples were analyzed over a 2θ range of 5° to 60°, with a scan step size of 0.020° (2θ) and scan step time of 1 second (Samy E.M., 2000). In vitro dissolution studies
Release from the solid dispersions was determined in a calibrated 8-station USP XXII apparatus (paddle method), TDT-08L Electrolab, Mumbai, India. Samples of drug, solid dispersions and physical mixture equivalent with 10 mg of drug were packed into thin cloth thimbles and then immersed in the dissolution medium consisting of 900 ml 0.1 N HCl maintained at 37 ºC. The duration of the test and the rate of paddle stirring were 90 min and 75 rpm, respectively. At a time intervals of (5, 10, 15, 20, 30, 45, 60 and 90 minutes), 5 ml samples were withdrawn, and replaced with 5 ml of fresh dissolution medium. The samples were filtered through a whatman filter paper No. 1 and analyzed spectrophotometrically at 250 nm on a Varian carry 100, UV–vis Spectrophotometer, Australia.
516
S. C. Jagdale, V. Musale, B. S. Kuchekar, A. R. Chabukswar
Cumulative percentages of the drug dissolved from the preparations were calculated (Pignatello et al., 2002; Mahaparale et al., 2006). Data analysis
·
Phase-solubility studies The values of apparent stability constant, Ks, between each drug-carrier combination were computed from the phase-solubility profiles, as described below: Ks = Slope / Intercept (1- slope) The values of Gibbs free energy of transfer, ∆Gotr of ALLO from aqueous solution of the carriers were calculated according to the following relationship ∆Gotr = - 2.303RT.log So/Ss
43.46 and 130.38, for slope 3.78 ×10⁻⁴ and 1.16×10⁻³ with R2 values 0.9874 and 0.9823, for PEG 6000 and PVPk30, respectively. Negative ∆Gotr values indicate favorable conditions. These values also indicated that the extent of improvement in solubility was greater with PVP K30 compared with PEG 6000. The solubility enhancement of ALLO obtained with various carriers in water followed the rank order of PVP K30> PEG 6000. TABLE I - Phase solubility parameters of Allopurinol at 25 ºC
Sr. Polymer concentration No. (%w/v) 1 2 3
1 5 10
Gibb’s free energy of transfer ΔGtr0 (joules/mol) PEG 6000 PVP K30 – 2.7 – 4.2 – 5.2 – 7.0 – 7.6 – 8.5
Where So and Ss are the molar solubilities of ALLO in 1 % w/v aqueous solution of the carrier, respectively. In vitro drug release data was fitted to four popular models of data treatment for the formulations as follows: 1) Zero order: F = k X t 2) First order: ln F = k X t 3) Higuchi’s model: F= k√ t 4) Korsmeyer and Peppas model: F= ktn Where F is the fraction of drug release, k is the release constant, t is the time and n is the diffusional coefficient. The value of n is related to the geometrical shape of the delivery system and determines the release mechanism from various polymeric drug deliveries.
RESULTS AND DISCUSSION Phase solubility studies
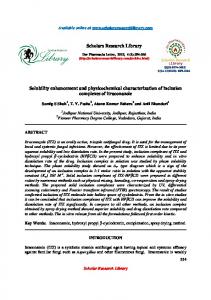
The current study showed that PVPK30 and PEG 6000 have a significant solubilizing effect on ALLO. Figure 1 shows the phase-solubility curve of ALLO in the presence of PVPK30 and PEG 6000. The solubility of ALLO in water at R.T. (25 °C) is 137 µg/mL; therefore, ALLO can be considered a water-insoluble drug. From this curve, it can be seen that the apparent solubility of ALLO increased with greater carrier concentrations. Both carriers show an AL type of linear graph with increasing concentration of carriers. The obtained values of Gibbs free energy transfer (∆Gotr) (Table I) for apparent stability constants (Ks) were
FIGURE 1 - Solubility of Allopurinol (g/100ml) in aqueous
solutions of (A) PEG 6000 and (B) PVP K30 in water at 25ºC
Characterization of solid dispersion UV- Visible Spectroscopy studies UV absorption spectra of ALLO and its solid dispersions were determined in 0.1 M NaOH by scanning the sample solutions in the range 240 nm to 300nm at a 1 cm path length. ALLO showed maximum absorption (λmax) at 260 nm. Figure 2 shows UV Spectra of allopurinol solid dispersions with PVP K30. The solutions of physical mixture and solid dispersions showed absorbance at the same λmax i.e. 260 nm but all formulations showed slight difference in absorbance compared to allopurinol. The decrease in absorbance showed by all solid disper-
Physicochemical characterization and solubility enhancement studies of allopurinol solid dispersions
sions (except KN2-K30 and CG4-K30 that exhibited increased absorbance) was due to method variation and considered practical errors such as formation of sticky lumps. This indicates there is no significant evidence of chemical interaction between ALLO and PVP K30. The shift in wavelength might be due to the complete incorporation of drug into the carrier.
FIGURE 2 - UV Spectra of Allopurinol SDs with PVP k30
Figure 3 shows the UV spectra of ALLO and its solid dispersions with PEG 6000. The UV absorption spectra of ALLO and its solid dispersions in PEG 6000 were obtained at the same scanning rate as PVPk30. All the dispersions exhibited decreased absorbance but the spectra of all solid dispersions were shifted to the higher wavelength due to the high polarity of the solvent i.e. NaOH as shown in Figure 3. This is considered significant evidence of chemical interaction between ALLO and PEG 6000.
517
vibrations of pyrimidine ring), 3400 cm−1 (NH stretching band), respectively. Important vibrations detected in the spectrum of PEG 6000 are C–H stretching at 2890 cm −1 and C–O (ether) stretching at 1125 cm−1. The spectra of the physical mixture (PM2-P60) can simply be regarded as the superimposition of those of ALLO and PEG 6000 (Figure 4). No difference was observed in the position of the absorption bands of ALLO and PEG 6000. The characteristic peaks of PEG 6000 were present at almost the same positions, while the absence of shifts in the wave numbers of the FTIR peaks of the solid dispersions vis-a-vis the PM indicate the lack of significant interaction between the drug and the carrier in the solid dispersions. Thus, these results confirm the absence of any well-defined interaction between ALLO and PEG 6000. Figure 5 displays the FTIR spectra of pure ALLO, PVP K30, PM and solid dispersions prepared by KN, CG and SE methods. PVP K30 exhibited peaks of C-H stretch vibration (2955 cm−1) and –C=O stretch vibration (1663 cm−1). The solid dispersions of all ratios (1:1, 1:2 and 1:4) showed that the principle peaks of ALLO i.e. 1700 and 1763 cm−1 (CO stretching vibration of the keto form of the 4-hydroxytautomer), 3060 cm−1 (CH stretching vibrations of pyrimidine ring), 3400 cm−1 (NH stretching band) were smoothened, weakened and splits. These observations indicated intermolecular hydrogen bonding via N-H, C-H and C-O groups of ALLO and –C=O stretch vibration of PVP. This result confirms significant drug-polymer interaction (Shah et al., 2007; Gurusamy et al., 2006).
FIGURE 3 - UV Spectra of Allopurinol SDs with PEG 6000
Fourier Transform Infrared spectroscopy (FTIR) studies The FTIR spectrum of ALLO exhibited characteristic signals at 790, 811, 915, 1159, and 1232 cm−1 (CH in plane deformation), 1590 cm−1 (ring vibration), 1700 and 1763 cm−1 (CO stretching vibration of the keto form of the 4-hydroxytautomer), 3060 cm−1 (CH stretching
FIGURE 4 - FT-IR spectra of Allopurinol, physical mixture and
its solid dispersions in PEG 6000 by CG and KN methods.
518
S. C. Jagdale, V. Musale, B. S. Kuchekar, A. R. Chabukswar
The shift and breadth of the endothermic peaks probably results from the partial reduction in crystallinity of ALLO, which can be confirmed in PXRD studies.
FIGURE 5 - FT-IR spectra of Allopurinol, physical mixture and
its solid dispersions in PVP K30 CG, by KN and SE methods.
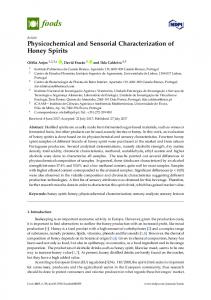
Differential Scanning Calorimetry (DSC) studies The DSC curve of ALLO and PEG 6000 showed sharp endothermic peaks at 379.5 ºC and 62.7 ºC respectively, due to fusion (Figure 6) corresponding to its melting point. The DSC curve of (CM4-P60) solid dispersion prepared by CM showed that the sharp endothermic peak was equivalent to the addition curves of PEG 6000 and crystalline drug (ALLO). It indicates lower crystallinity because of less cross-linking between ALLO and PEG 6000. The physical mixture and solid dispersion prepared by the solvent evaporation method (SE2-P60) showed an ALLO and PEG 6000 derived endothermic peak with lower intensity than pure ALLO. The possibility of drug dissolution in the melting carrier has been previously reported (Okonogi et al., 2006) Therefore, DSC results suggested that crystalline ALLO in the ALLO-PEG solid dispersions were dissolved in melting PEG during the DSC scan. Figure 7 shows the DSC curves of ALLO, PVPk30 and solid dispersions (KN4-K30, SE1-K30 and CG2K30). ALLO and PVPk30 show endothermic peaks at 379.5 ºC and 80ºC, respectively. The sharp endothermic peaks corresponding to melting of ALLO becomes broad in DSC thermograms of solid dispersions. However, solid dispersion (KN4-K30) showed the ALLO-derived endothermic peaks with greater intensity than pure ALLO. This might be due to the amorphous form of ALLO in the solid dispersion or dissolution of crystalline ALLO into the molten carrier.
FIGURE 6 - DSC Thermographs of SDs with PEG 6000; a)
ALLO, b) PEG 6000, c) PM-P60, d) SE2-P60, e) CM4-P60.
FIGURE 7 - DSC Thermographs of SDs with PVP K30; a)
ALLO, b) PVP K30, c) KN4-K30, d) SE1-K30, e) CG2-K30.
Powder X-ray diffractometry (PXRD) studies The diffraction peaks of ALLO, carriers, PM and solid dispersions were given for comparative purposes. The PXRD patterns of ALLO, PEG 6000 and its binary systems are compared in Figure 8. The diffraction pattern of pure drug reveals its highly crystalline nature, as indicated by the numerous distinctive peaks. The PEG 6000 alone exhibited two high intensity peaks at 19º and
Physicochemical characterization and solubility enhancement studies of allopurinol solid dispersions
519
23º. The lack of the numerous distinctive peaks of the drug in the PM and solid dispersions demonstrated that a high concentration of the drug was dissolved in solid state carrier matrix in an amorphous state. This suggests the ALLO present in the solid dispersion is mostly in an amorphous state with only few partially crystallized drug molecules. PXRD patterns of ALLO, PVP K30, PM and solid dispersions are shown in Figure 9. In the X-ray diffractograms of ALLO, sharp peaks at a diffraction angle (2θ) of 7.01º, 9.66º, 11.5 º, 19.21º, 20.08 º and 35.07 º indicate the presence of crystalline drug, while PM and solid dispersion show a single sharp peak at 24.88 º. These data revealed that the diffraction patterns of all the samples of solid dispersions have peaks due to PVP but the typical drug crystalline peaks are totally absent, thus indicating the crystalline nature of ALLO converted to an amorphous state (Shah et al., 2007; Gurusamy et al., 2006).
FIGURE 9 - PXRD pattern of SDs with PVP K30; a) ALLO, b)
PVP K30, c) PM-K30, d) SE1-K30, e) KN4-K30.
FIGURE 8 - PXRD pattern of SDs with PEG 6000; a) ALLO, b)
PEG 6000, c) PM4-P60, d) CM4-P60, e) CG2-P60.
In vitro dissolution study
The dissolution rate of pure ALLO was very poor and during a 90-minute period, a maximum of around 54.53 % of drug was released. The reason for the poor dissolution of pure drug could be poor wettability and/or agglomeration.
Figure 10, Figure 11 and Figure 12 show the plot of cumulative per cent drug released as a function of time for different formulations. In vitro release studies revealed that there was a marked increase in the dissolution rate of ALLO, in the range of 65.8 to 99.8 %, from all Physical mixtures and solid dispersions compared to pure ALLO except for CP2-P60, KN1-P60 and CM1-P60 (Figure 10, Figure 11 and Figure 12). This might be secondary to the improper distribution of drug in these formulations due to the method variation. Among the different ratios prepared, the enhancement of dissolution rate was found to be 1:4>1:2>1:1. The results revealed that the solid dispersions produced by co-grinding and solvent evaporation techniques have higher dissolution rates of pure ALLO at all ratios compared with the samples produced by KN, CP and CM methods. This could be due to molecular dispersion of drug in the samples and drug amorphization. Hence, the present study showed the SE and CG techniques are more efficient than KN, CP and CM techniques for increasing the dissolution of ALLO by using PEG 6000 as a hydrophilic carrier. Figures 13 and 14 show comparative in vitro release profiles of pure ALLO, physical mixture and various solid dispersions of ALLO with PVP K30, prepared by the KN, CG and SE methods. In vitro release studies revealed a marked increase in dissolution rate of ALLO from all
520
S. C. Jagdale, V. Musale, B. S. Kuchekar, A. R. Chabukswar
in dissolution rate may be the result of solubility enhancement by improving the wettability of drug particles due to its surfactant property.
FIGURE 10 - In vitro Drug release profile of ALLO-PEG 6000
binary systems by Co-precipitation method.
FIGURE 13 - In vitro Dissolution profile of ALLO-PVP K30
binary systems by kneading and Co-grinding methods.
FIGURE 11 - In vitro Drug release profile of ALLO-PEG 6000
binary systems by kneading and Co-grinding methods.
FIGURE 14 - In vitro Drug release profile of ALLO-PEG 6000
binary systems by Closed melting and Solvent evaporation methods.
FIGURE 12 - In vitro Drug release profile of ALLO-PEG 6000
binary systems by Closed melting and Solvent evaporation methods.
solid dispersions when compared to pure ALLO. Based on the release profile, 1:2 ratios of KN and CG methods showed consistency in the release pattern of drug after 20 minutes without increasing the further release of drug. This stoppage in the dissolution rate may be due to the increase in the viscosity of coating material. The increase
Kinetic treatment of dissolution data The coefficient of determination was considered the main parameter for interpreting the results. The n values of all formulations are as reported in Table II and III. All formulations of solid dispersions were not fitting to a specific model (Patel et al., 2008). Only two formulations, i.e. KN4-P60 and CG1-P60, followed first order kinetics with R2 values of 0.9708 and 0.9838, respectively. Formulations KN1-P60, CM1-P60, CP1-P60, CP2-P60, and SE1-P60 follow Higuchi kinetics with R2 values 0.9874, 0.9954, 0.9848, 0.9897 and 0.9938, respectively. The release kinetic analyses of all formulations are as shown in Table 2. For formulations containing PEG 6000, KN1-P60, CM1-P60, CM2-P60 and SE1-P60, n values were 1.0495, 1.036, 1.0372 and 1.2869, respec-
521
Physicochemical characterization and solubility enhancement studies of allopurinol solid dispersions
TABLE II - Kinetic treatment of dissolution data of allopurinol Solid Dispersions in PEG 6000
Formulation Code
Coefficient of determination(r2) Zero order
First order
Higuchi square
Korsemeyer Peppas
Korsemeyer n (release exponent)
ALLO
0.9251
0.9197
0.8711
0.9262
0.5134
PM4-P60
0.9809
0.9557
0.9726
0.9821
0.69
KN1-P60
0.9699
0.9222
0.9874
0.9815
1.0495
KN2-P60
0.9879
0.9184
0.978
0.9527
0.7282
KN4-P60
0.9533
0.9708
0.8855
0.9209
0.6052
CM1-P60
0.9721
0.9527
0.9954
0.9804
1.036
CM2-P60
0.9455
0.9249
0.878
0.8901
1.0372
CM4-P60
0.8822
0.5627
0.9201
0.9285
0.2174
CP1-P60
0.9937
0.9731
0.9848
0.9967
0.1648
CP2-P60
0.9422
0.9051
0.9897
0.9785
0.7042
CP4-P60
0.8929
0.5736
0.9278
0.9219
0.2272
SE1-P60
0.9609
0.8303
0.9938
0.9531
1.2869
SE2-P60
0.9771
0.9566
0.9279
0.9552
0.6311
SE4-P60
0.6414
0.6498
0.521
0.6878
0.093
CG1-P60
0.9639
0.9838
0.9021
0.9037
0.5974
CG2-P60
0.9811
0.7955
0.9717
0.9684
0.4817
CG4-P60
0.9212
0.9141
0.8369
0.8497
0.6573
Kinetic treatment for PEG 6000 solid dispersions
tively, indicating that the release mechanism from these systems was super case II transport. Formulations KN2P60, KN4-G50, CP2-P60, SE2-P60, CG1-P60, CG2-P60 and CG4-P60, had n values ranging from 0.4817 to 0.7282 indicating that the release mechanism from these systems was the anomalous type (Non Fickian transport), which refers to a combination of both diffusion and erosion controlled-drug release. Kinetic treatment for PVP K30 solid dispersions Only one formulation i.e. SE2-K30, followed first order kinetics with an R2 value of 0.9827. Formulations KN1-K30 and KN4-30 followed Higuchi kinetics with R2 values of 0.983 and 0.988, respectively. The release kinetic analyses of all formulations are as shown in Table 3. All formulations showed n values ranging from 0.5207 to 0.7361 except KN2-K30 and CG2-K30, whose n values were less than 0.5 and hence their release mechanism is not understood. Given these n values, it is concluded that the release mechanism from these systems was the anomalous type (Non Fickian transport), which refers to
a combination of both diffusion and erosion controlleddrug release.
CONCLUSION Finally, based on the above study, it was concluded that the solid dispersion technique was shown to be a successful approach for improving the dissolution rate of allopurinol. The nature and amount of the carrier used played an important role in the enhancement of the dissolution rate. The increased solubility and dissolution rate of ALLO provided the rapid onset of action.
ACKNOWLEDGEMENTS The authors are grateful to the Maharashtra Institute of pharmacy, Pune for providing essential laboratory conditions for the research work. Also, an author acknowledges the Department of Physics, University of Pune, for allowing the X-ray Diffraction and Differential Scanning Calorimetric studies.
522
S. C. Jagdale, V. Musale, B. S. Kuchekar, A. R. Chabukswar
TABLE III - Kinetic treatment of dissolution data of allopurinol Solid Dispersions in PVP K30
Formulation Code ALLO PM2-K30 KN1-K30 KN2-K30 KN4-K30 CG1-K30 CG2-K30 CG4-K30 SE1-K30 SE2-K30 SE4-K30
Zero order 0.9251 0.9532 0.9839 0.574 0.9925 0.9532 0.6414 0.9217 0.9499 0.7576 0.9826
Coefficient of determination(r2) Higuchi Korsemeyer First order square Peppas 0.9197 0.8711 0.9262 0.9611 0.8778 0.9147 0.6239 0.983 0.9736 0.6111 0.4881 0.6336 0.7554 0.988 0.9486 0.9685 0.8793 0.9161 0.6498 0.521 0.6878 0.9172 0.8373 0.8501 0.8294 0.906 0.8879 0.9827 0.6478 0.7078 0.7535 0.9329 0.9248
REFERENCES ABDUL-FATTAH, A.M.; BHARGAVA, H.N. Preparation and in vitro evaluation of solid dispersions of halofantrine. Int. J. Pharm., v.235, p.17-33, 2002. AHUJA, N.; KATARE, O.; SINGH, B. Studies on dissolution enhancement and mathematical modeling of drug release of a poorly water-soluble drug using water-soluble carriers. Eur. J. Pharm. Biopharm., v.65, p.26-38, 2007. AHUJA, N.; SINGH, A.; SINGH, B. Rofecoxib: an update on physicochemical, pharmaceutical, pharmacodynamic and pharmacokinetic aspects. J. Pharm. Pharmacol., v.55, p.859-894, 2003. CHOW, A.H.L. Assessment of wettability and its relationship to the intrinsic dissolution rate of doped phenytoin crystals. Int. J. Pharm.,v.126, p.21-28,1995.
Korsemeyer n (release exponent) 0.5134 0.5207 0.7361 0.1144 0.7158 0.5227 0.093 0.6579 0.7044 0.4681 0.8008
DIXIT, R.P.; NAGARSENKAR, M.S. In vitro and in vivo advantage of Celecoxib surface solid dispersion and dosage form development. Ind. J. Pharm. Sci., v.69, p.370-377, 2007. FLEGO, C. Dissolution rate of griseofulvin from solid dispersion with poly(vinylmethylether: maleic anhydride). Drug Dev. Ind. Pharm., v.14, p.1185-1202, 1988. GEORGE, Z.; BIKIARIS, D.; KARAVAS, E. Effect of physical state and particle size distribution on dissolution enhancement of nimodipine/PEG solid dispersions prepared by melt mixing and solvent evaporation. AAPS PharmSciTech., v.8, p.E623-E631, 2006. GURUSAMY, S.; VIJAY, K.; MISHRA D. Preparation, characterization and in vitro dissolution studies of solid dispersions meloxicam with PEG 6000. Yakugaku Zasshi., v.126, p.657-664, 2006.
CRAIG, D.Q.M. The mechanisms of drug release from solid dispersions in water-soluble polymers. Int. J. Pharm., v.231, p.131-144, 2002.
HABIB, F.S.; ATTIA, M. A. Effect of particle size on the dissolution rate of monophenylbutazone solid dispersion in presence of certain additives. Drug Dev. Ind. Pharm., v.11, p.2009-2019, 1985.
DAMIAN, F.; BLATON, N.; KINGET, R.; NAESENS L.; BALZARINI, J.; AUGUSTIJNS, P.; VAN DEN MOOTER, G. Physicochemical characterization of solid dispersions of the antiviral agent UC-781 with polyethylene glycol 6000 and Gelucire 44/14. Eur. J. Pharm Sci., v.10, p.311-322, 2000.
HASEGAWA, S.; HAMAURA, T.; FURUYAMA, N. Effects of water content in physical mixture and heating temperature on crystallinity of tropiglitazone- PVP K30 solid dispersions prepared by closed melting method. Int. J. Pharm., v.302, p.103-112, 2005.
Physicochemical characterization and solubility enhancement studies of allopurinol solid dispersions
HIGUCHI, T.; CONNORS, K.A. Phase solubility techniques. Adv. Anal. Chem. Instr., v.4, p.117-212, 1965. LONDHE, V.Y.; NAGARSENKAR, M.S. Solid dispersion of hydroxypropyl β- cyclodextrin and carbamazepine: study of complexation and in vitro dissolution profile. Indian drugs, v.36, p.15-20, 1999. MAHAPARALE, P.R.; GUDSOORKAR, V.R.; GAJELI, G.B. Studies on solid dispersions of meloxicam. Ind. J. Pharm. Educ. Res., v.40, p.241-244, 2006. MODI, A.; TAYADE, P. Enhancement of dissolution profile by solid dispersion (kneading) technique. AAPS PharmSciTech., v.7, p.E1-E6, 2006.
523
PIGNATELLO, R.; FERRO, M.; PUGLISI, G. Preparation of solid dispersions of non-steroidal anti-inflammatory drugs with acrylic polymers and studies on mechanisms of drug-polymer interactions. AAPS PharmSciTech., v.3, p.1-11, 2002. PITHA, J. Amorphous water-soluble derivatives of cyclodextrins: nontoxic dissolution enhancing excipients. J. Pharm. Sci., v.74, p.987-990, 1985. SAMY, E.M. Improvement of availability of allopurinol from pharmaceutical dosage forms I – suppositories. Eur. J. Pharm. Biopharm., v.49, p.119-127, 2000.
NOKHODCHI, A.; TALARI, R.; VALIZADEH, H. An investigation on the solid dispersions of chlordiazepoxide. Int. J. Biomedical. Sci.,v.3, p.211-217, 2007.
SEKIGUCHI, K. Dissolution behavior of solid drugs. III. Determination of the transition temperature between the hydrate and anhydrous forms of phenobarbital by measuring their dissolution rates. Chem. Pharm. Bull., v.21, p.15921600, 1973.
OKONOGI, S.; PUTTIPIPATKHACHORN, S. Dissolution improvement of high drug-loaded solid dispersion. AAPS PharmSciTech.,v.7, p.52, E1-E6, 2006.
SERAJUDDIN, A. T. M. Solid dispersion of poor water-soluble drugs: early promises, subsequent problems, and recent breakthroughs. J. Pharm. Sci., v.88, p.1058-1066, 1999.
PATEL, N.; CHOTAI, N.; PATEL, J. Comparison of in vitro dissolution profiles of oxcarbazepine-HP b-CD tablet formulations with marketed oxcarbazepine tablets. Dissol. Technol., v.15, p.28-34, 2008.
SETHIA, S.; SQUILLANTE, E. Solid dispersion of carbamazepine in PVP K30 by conventional solvent evaporation and supercritical methods. Int. J. Pharm., v.272, p.1-10, 2004
PATHAK, D.; DAHIYA, S.; PATHAK, K. Solid dispersion of meloxicam: factorially designed dosage form for geriatric population. Acta Pharm., v.58, p.99-110, 2008.
SHAH, T.J.; AMIN A.F.; PARIKH J.R. Process optimization and characterization of poloxamer solid dispersions of a poorly water-soluble drug. AAPS PhaemScitTech., v.8, p.E1-E7, 2007. Received for publication on 6th December 2010 Accepted for publication on 12th May 2011