through sources as diverse as email and ecommerce has proven to be useful for .... The advertisement for the experiment made it clear that none of their data ...
2011 IEEE International Conference on Privacy, Security, Risk, and Trust, and IEEE International Conference on Social Computing
pieTime: Visualizing Communication Patterns Tiffany Ng, Ou Jie Zhao, Dan Cosley Information Science Department Cornell University Ithaca, NY 14850 USA {tyn2, oz23, drc44}@cornell.edu
Abstract—This paper explores how aggregated behavioral data might help people reflect on patterns in their lives using pieTime, a visualization that presents communication activity aggregated at levels from hours in a day to months in a year. pieTime builds on recent work in conversation visualization and lifelogging by focusing on rhythms rather than details and supporting reflection across different media. An evaluation with 15 people supports findings from prior work about the importance of particular details and storytelling in tools that support reflection, even when the design goals emphasize higher-level patterns. Still, aggregate patterns provide additional insight into personal behavior, suggesting that systems that integrate both particulars and patterns may be especially valuable, especially when they also help people build and manage their identities.
II.
Keywords-information visualization; reflection; lifelogging
I.
Communication Visualization. Visualizations of email are one common design for supporting reflecting on behavior. A number of systems use timelines as an organizing principle, including Themail [19] and PostHistory [18]. These timelines often present words or events that characterize a given period, which tends to focus people’s attention on particular events. Other systems have attempted to look at regular patterns in behavior by using spirals [2] and stacked timelines [3] to present communication behavior over the long term. Such interfaces balance aggregating behavior and providing access to details, normally a desirable attribute for visualizations.
INTRODUCTION
Visualizations and analyses of behavior in social media and computer-mediated communication tools like email aim to help both researchers and users move from raw records of recorded activity to insights about their communities, relationships, and lives. Harvesting the information people already generate through sources as diverse as email and ecommerce has proven to be useful for generating insight about communities [6][8] and individuals [14][19]. In general, when people are given tools that visualize such information, they focus on specific events rather than higherlevel patterns. Our interest was to see whether appropriate designs might focus people’s attention on larger-scale patterns of activity in their lives. Sociologists recognize time as a major factor in social matters [16], and we hypothesized that focusing people’s attention on temporal rhythms of communication would help them learn more about these aspects of themselves.
Temporal Rhythms. These aggregate rhythms, and time more generally, are a major factor in social matters [16]. Researchers have explored how temporal patterns manifest at the community level in IRC [8] and Facebook messaging [6]. These patterns can also give insight into social networks, both for predicting relationships and roles [4][5]. III.
To this end, we developed pieTime (Fig. 1), a visualization that helps people compare their behavior across communication media at scales from hours of the day to months of the year. Thus, rather than focusing on specific events in the past, pieTime aggregates these events into regular cycles to support long-term self-discovery, although it also chooses characteristic keywords associated with each time period and medium. An evaluation of pieTime with 15 people shows that these rhythms have some value, but many people still preferred to focus on specific events even though pieTime presents few details of those events. This suggests that storytelling about events is a fundamental way that people think about the past that designs for lifelogging and reflecting on the past must consider. 978-0-7695-4578-3/11 $26.00 © 2011 IEEE DOI
RELATED WORK
Reflective Technologies. Technology designed for reflecting and self-informing is an emerging area within human-computer interaction. Studies have recognized the value of noticing patterns in behavior for fostering self-awareness [14] and self-control [12]. Lifelogging, or capturing, analyzing, and visualizing daily behavior [9], is one strategy for finding these patterns. For example, Mycrocosm [1] lets users share graphs of personal data such as “how many people irritated me today”, which people found enjoyable and useful for connecting to their data. Reminiscing using previously created social media data, as in Pensieve [11] or photos of daily life captured with SenseCam [15], has also been found to be useful for supporting reflection on one’s behavior [10].
SYSTEM DESIGN
pieTime’s goal is to help people reflect on patterns in their behavior in ways that complement existing approaches to visualization and reflection described above. In particular, our goal was to focus attention on the aggregate temporal patterns and away from the details of specific events. Below, we discuss the major features of pieTime that support reflecting on aggregate behavior at varying timescales in multiple media. The Pie. As described earlier, spirals and timelines are commonly used to visualize both serial and periodic data. However, we were inspired by more traditional representations of time, such as the analog clock. These circular forms are familiar, and we used the clock metaphor as a starting point for 720
developing the pie. The goal of the pie was to emphasize sections as parts of a whole—recurring periods, or meaningful “slices” of one’s life.
example, pieTime showed an unexpected spike of activity for one user between 11pm and 12am. He had been taking late night ice cream trips with a friend and had not realized how frequently they were occurring. pieTime was able to highlight this because it accumulates activity over time.
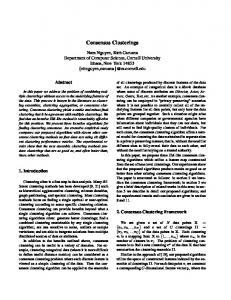
pieTime aggregates the amount of activity in each time slice by counting the number of timestamps corresponding to each incoming and outgoing communication, presenting time periods as pie slices of varying radii (Fig. 1). The radii are scaled so that the piece representing maximum activity for that timescale extends to the edge of the invisible circle that encloses the pie. Each pie slice consumes 1/n of the circumference, where n is the number of time divisions. Although this makes active periods look disproportionately large, we hoped the aesthetic visuals would outweigh the need for precision in comparing exact levels of activity.
Multiple Media. pieTime was designed to help people see patterns of activity using existing communication activity—but which media? We wanted media where data were readily available and quick to download, widely used, and had rich enough representations to suggest meaningful insights. We considered a number of potential sources and in the end chose email and phone bills. Email was a natural choice given its ubiquity and the amount of prior research that has used it, while phone bills (including texts) capture data that is not often used in reflection tools but that represents an important element of interaction, especially for younger people [7].
Multiple timescales. Our initial thought was that since daily rhythms are some of the most basic ones we experience, we should focus on time divisions that give people insight into the structure of their day. Thus, our first prototype showed activity aggregated by either hour or half hour. This led to some expected regularities, such as mealtimes and sleep patterns— and this may not be bad. For instance, “obvious” suggestions from recommender systems may not help people find new movies to watch, but do help to build trust in the system [17]. As we will see, people need cues to help them trust visualizations of conversation as well.
Users of early prototypes expressed a strong interest in being able to compare their data sets. We first tried presenting two visualizations side-by-side, but users had trouble moving between them. Since concentric circles work well for visual comparisons [13], we used them to establish a common time scale and to extend the “pieces of a whole” metaphor by “stacking” the two data sets. Fig. 1 shows the stacking in action. We did no scaling to favor either email or phone data as some users may communicate more through either medium, but we combined the raw number of phone calls with the number of text messages into “texts or calls made” and ignored the length of communication because we were primarily concerned with frequency of communication rather than duration.
People reacting to the first prototype thought they would like to see patterns in changes in activity at larger timescales. We took this suggestion, as well as prior work that divides time into months and years, and allow users to segment the pie into 24, 31, 7, and 12 pieces representing hours of the day, days of the month, days of the week, and months of the year, with hourly as the default. We hoped that these scales might each reveal, and prompt reflection on, regular events: daily coffee, weekly meetings, monthly club activities, or the way that fiscal years or seasonal weather all shape people’s lives. For
Representative keywords. Early prototype users sometimes had trouble interpreting spikes of activity. To support this, and to help create connections between user and data as suggested by [18], we extract representative keywords for each time slice. For emails we focused on subject lines for speed; for phone bills we used location data about SMS messages and calls, as this was the only qualitative data we could retrieve. For each time slice, timescale, and medium, we trained a Bayesian spam filter that treated content from that medium and time slice as “ham” and everything else as “spam”. We then returned the four words that had the highest relative probability of appearing in content associated with that medium and time slice. For example, in Fig. 1, the words nytimes and burlington are most uniquely identified with emails and phone activity between 8am and 9am. Four is a somewhat arbitrary choice that happened to fit well in the allotted space. IV.
EVALUATION
We used the version of pieTime shown in Fig. 1 to evaluate how well it supported reflection on patterns of activity. We recruited a total of 15 Cornell University students (3 female, 12 male). The advertisement for the experiment made it clear that none of their data would be kept and that the researchers would only see the visualization if the participant gave permission. Participants were compensated with either course credit or a piece of pie. Each session was conducted by two experimenters. After obtaining consent, we told participants that the goal was to “evaluate a tool that visualizes people’s communication
Figure 1. pieTime, showing hourly email and phone activity. The slice representing 8am-9am is highlighted.
721
go coordination: “During the holidays I texted and called a lot. I was traveling and coordinating with people.” (P7)
patterns.” We then helped them download their Gmail content and phone bills and explained the experimental procedure. We first asked participants to “play around” with the tool while thinking aloud. One experimenter observed; the other used a list of questions to guide participants and help them notice different parts of the system. We probed them to describe what they thought they were seeing, what they were thinking, whether any of the data or their interpretations of it surprised them, and whether they felt any connection between what they saw and what has happened in their life.
A handful of users were especially intrigued by the keywords, scanning through each time slice’s set of words and creating stories to explain why the words may have appeared. They were able to jump through a series of quick anecdotes while mumbling through each keyword: “Freetoll: that’s from me trying to figure out many minutes I have left…[Laughs] June keywords: “burning” and “exposed” all have to do with me getting sunburned—I peeled twice.” (P8)
After they finished exploring the interface, we asked a series of follow-up questions about their reactions to the system as a whole. These include questions about the usability of the visualization, which features were interesting, useful, or confusing, prior experience with similar tools or visualizations, and so on. Sessions averaged approximately 45 minutes. To analyze the data, we created affinity diagrams based on our observations in order to find major themes that shaped participants’ experience and their reactions to features. Quotes below are attributed with that participant’s id number. V.
Somewhat like the nagging feeling of being unable to remember the answer to a trivia question, participants were annoyed or puzzled when they couldn’t explain what they saw: “I don’t think I’ve ever called Toronto at 3pm” (P5). One user (P2) kept returning to a mysterious spike in emails and obscure words at 3am, until he finally sighed in relief, realizing it was a daily mailing list for dictionary and SAT words. Both expected and unexpected patterns are useful. Compared to the keywords, reactions were mixed about the utility of patterns. Some participants claimed they didn’t learn anything that they didn’t already know after using the tool, though others made observations about their lives they hadn’t explicitly considered before: “Apparently I text everybody in the world at 4pm…Yeah that sounds about right. It's when I get out of work. It’s also right before I go to workouts.” (P4)
RESULTS
Our data suggested several main themes. First, although our goal was to focus attention on patterns, people first looked to the keywords to orient themselves and to convince themselves that pieTime reflected their identity. Second, they looked for anomalies, both in the keywords and in levels of activity, and then constructed explanations for them. Third, people did detect and reflect on both expected and unexpected activity patterns revealed by the visualization.
People’s reactions to the timescales varied. The default hourly breakdown gave users a direct, “nice and well-labeled” (P15) way of looking at their daily patterns, though one described it as “too granular” (P11) to reflect anything in his randomly ordered schedule. Most users spent their time looking at hourly, weekly, and monthly views, though a few spent so much time interpreting each hour of the default timescale that they had little time to explore the others. Users spent the least time on days of the month, which had few discernable patterns. Viewing by days of the week led many people to consider weekly patterns of work and play, observing that they had a significantly higher amount of emails sent and received from Sunday through Tuesday compared to the rest of the week: “Friday is the day I don’t wanna do any work. Saturday is not as busy ’cause you’re waiting for Sunday. Thursday—early partying…” (P2)
Personal connection matters. Despite our goal of focusing attention on higher-level patterns, people tended to spend much more time analyzing keywords than noticing patterns. This may be because there is more information in the keywords than the frequencies: as one user (P2) pointed out, switching from one hour to the next would produce a set of four new keywords (“livermore_ca, sunnyvale_ca, newyork_ny, camden_nj”, for phone data), whereas only one frequency number (“80 texts or calls made”) would be updated. However, many users had trouble connecting keywords to their own lives, and a few wondered if we were showing them someone else’s data, because their intuition was that keywords should be the most commonly occurring words: “I email my mother a lot…I would really expect to see my mom’s keywords because that’s really important to me.” (P11) We suspect that this may be a by-product of the algorithm, because it chooses the most identifying keywords for a given time slice, rather than the most common ones, and these were sometimes obscure (as with the keyword “671x543” in one case).
The visualizations also prompted some to reflect on their habits and lifestyles: “The keywords at 4am—guess that tells me I’ve been up too late working on that project. Definitely the most useful piece of info I’ve seen so far. Working on a project at 4am in the morning is kinda bad.” (P5) Overall Reactions. All users found the tool interesting—a “cool new concept” (P1). Only two participants had looked at a similar tool in the past or regularly checked their phone logs, while nine users “didn’t care about this stuff before” (P2) or “hadn’t thought about it” (P7). Most users said they enjoyed playing with the visualization, and four were deeply curious about their statistics down to each hour, with one claiming he could “stare at this all day” (P11). They suggested a number of interactive features such as the ability to zoom into a specific date or time, or a play button that animates the accumulation of
On the other hand, recognition led to connection: “Oh, the 27th day of the month shows up with my girlfriend’s last name.” (P5) Suddenly, the data was his, and he was able to make sense of the system. People seek, and create, explanations. Once people understood the data was theirs, they started to use the keywords and patterns to think about life events. For instance, high levels of phone activity around certain days were attributed to birthdays, holidays, or travel periods that required more on-the-
722
VII. CONCLUSION
communication activity over time as a way to give a glimpse into how temporal patterns form.
We designed pieTime to visualize personal communication data in an effort to reveal temporal rhythms in behavior and encourage reflection on those rhythms. Putting our work into the context of prior efforts suggests that personalization, reminiscence, detail, and storytelling are fundamental to how people think about their pasts and that systems should support these ideas across a wide range of designs and goals.
Five users saw some use for the tool, ranging from repeated use “once a week” (P1) to more practical goals around selfmonitoring. One user found his phone usage “alarming” (P5) after realizing it was roughly even throughout the day, citing it as a good reminder to watch his use of limited free daytime minutes before 9pm. Another user (P8) wanted to cancel his texting services after seeing how little he actually texted each month while paying for an unlimited texting plan. Three users claimed to see no practical application for the tool (“don’t need it to survive” (P6)), while seven others said it wasn’t useful but “good for reminiscing” (P3) or playing with out of curiosity. VI.
ACKNOWLEDGMENT We would like to acknowledge Erica Horowitz and Mitchell Davis for their work in helping to evaluate pieTime, and the NSF for support through a grant, IIS 08-35451. REFERENCES
DISCUSSION [1]
Our experience suggests that, although pieTime was interesting and supported reflection, it did not accomplish its primary goal of focusing attention on patterns of behavior. Here, we would like to take a step back from pieTime and talk about why this is, and how our results apply to the larger collage of tools for reflection on communication and behavior.
[2] [3] [4]
Patterns complement particulars. Our work gives further evidence to the importance of helping people reflect on particular events as a way to understand their pasts. We had hoped to focus attention on rhythms by downplaying individual events in our design, to encourage people to process the past in the aggregate and in the large. However, as with other such tools (e.g., [18][19]), people often used the data to reflect on specific experiences. This suggests that people use specific incidents and events as a fundamental way of reminiscing, reflection, and understanding the past, and that even if the goal is seeing a “bigger picture”, details are important in design.
[5] [6] [7] [8] [9] [10]
Support storytelling and data collection. pieTime users were happier when they could make personal connections with the data that reflected their identities. Taking this a step farther, visualizations might allow users to add interpretations to the data, as with Pensieve’s diary feature that allows people to write about social media content from their past [11]. For instance, a visualization of Facebook data might allow people to integrate a variety of media and content to tell stories about their relationships, a kind of manually curated version of its existing “See Friendship” feature.
[11] [12] [13] [14] [15]
Rhythms do support awareness. Still, pieTime users did find value in awareness of their rhythms, noticing both mundane and unexpected patterns. While our study did not directly compare the use (or lack of use) of other data display tools with pieTime, it suggests the value of revealing rhythms. These include even “obvious” ones, as with the user who regularly checked his phone bill, yet found motivation from pieTime to change his service plan when he saw his usage habits visualized, rather than as a list of numbers. Thus, designers of tools for reflection should consider features that help people see these aggregated rhythms while still having access to particulars. One strategy would be to allow filtering by communication partner, by time period, by topic, or by location, to allow people to see aggregations that might be more meaningful to them.
[16] [17] [18] [19]
723
Assogba, Y., Donath, J. (2009). Mycrocosm: Visual microblogging. HICSS. Carlis, J., Konstan, J. (1998). Interactive visualization of serial periodic data. Proc. UIST. Dörk, M. et al. (2010). A visual backchannel for large-scale events. Proc. InfoVis, (16)6, 1129-38. Eagle, N., Pentland, A. (2006). Reality mining: sensing complex social systems. Personal and Ubiquitous Computing, 255-268. Fisher, D., Dourish, P. (2004). Social and temporal structures in everyday collaboration. Proc. CHI, 551-558. Golder, S., Wilkinson, D., Huberman, B.A. (2007). Rhythms of social interaction: Messaging within a massive online network. Proc. C&T. Grinter, R.E., and Eldridge, M.A. (2003). Wan2tlk?: Everyday text messaging. Proc. CHI, 441-448. Jones, Q., et al. (2008). Empirical evidence of information overload constraining chat channel community interactions. CSCW, 323-332. Li, I., Dey, A.K., Forlizzi, J.F. (2010). A stage-based model of personal inforamatics. Proc. CHI, 1549-1552. Lindley, S.E., et al. (2009). Reflecting on oneself and on others: Multiple perspectives via SenseCam. CHI workshop on Designing for Reflection on Experience. Peesapati, S.T., et al. (2010). Pensieve: Supporting everyday reminiscence. Proc. CHI, 2027-2036. Rachlin, H. (1995). The value of temporal patterns in behavior. Curr. Directions in Psych. Sci. 4(6), 188-192. Riche, Y., Mackay, W. (2010). PeerCare: supporting awareness of rhythms and routines for better aging in place. JCSCW, 19(1), 73-104. Schwarz, J., Mankoff, J., Matthews, H.S. (2009). Reflections of everyday activities in spending data. Proc. CHI, 1737–1740. Sellen, A., et al. (2007). Do life-logging technologies support memory for the past? An experimental study using SenseCam. Proc. CHI, 81-90. Sorokin, P., Merton, R. (1937). Social time: a methodological and functional analysis. American Journal of Sociology, 42(5), 615-629. Swearingen, K. Sinha, R. (2002). Interaction design for recommender systems. Proc. DIS. Viegas, F., et al. (2004). Digital artifacts for remembering and storytelling: PostHistory and social network fragments. Proc. HICSS. Viegas, F., Golder S., Donath, J. (2006). Visualizing email content: Portraying relationships from conversational histories. Proc. CHI, 979988.