Planning for wastewater reuse Fresa F., Melli F., Piccinni A.F., Santandrea V., Specchio V. in Lamaddalena N. (ed.), Bogliotti C. (ed.), Todorovic M. (ed.), Scardigno A. (ed.). Water saving in Mediterranean agriculture and future research needs [Vol. 2] Bari : CIHEAM Options Méditerranéennes : Série B. Etudes et Recherches; n. 56 Vol.II 2007 pages 129-147
Article available on lin e / Article dispon ible en lign e à l’adresse : -------------------------------------------------------------------------------------------------------------------------------------------------------------------------http://om.ciheam.org/article.php?IDPDF=800183 -------------------------------------------------------------------------------------------------------------------------------------------------------------------------To cite th is article / Pou r citer cet article -------------------------------------------------------------------------------------------------------------------------------------------------------------------------Fresa F., Melli F., Piccinni A.F., Santandrea V., Specchio V. Plan n in g for wastewater reu se. In : Lamaddalena N. (ed.), Bogliotti C. (ed.), Todorovic M. (ed.), Scardigno A. (ed.). Water saving in Mediterranean agriculture and future research needs [Vol. 2]. Bari : CIHEAM, 2007. p. 129-147 (Options Méditerranéennes : Série B. Etudes et Recherches; n. 56 Vol.II) --------------------------------------------------------------------------------------------------------------------------------------------------------------------------
http://www.ciheam.org/ http://om.ciheam.org/
PLANNING FOR WASTEWATER REUSE
F. Fresa *, F. Melli **, A.F. Piccinni *, V. Santandrea *** and V. Specchio * * Polytechnic of Bari, via E. Orabona 4 70126 Bari –
[email protected] ** SOGESID s.p.a., *** IPRES Istituto Pugliese di Ricerche Economiche e Sociali
SUMMARY- This paper presents the results of a research work aimed at defining useful criteria for planning treated wastewater reuse. All the possible forms of reuse are preliminarily analysed, supplementary treatments required for different uses are identified according to reclaimed water characteristics, and the additional costs required to adjust the treatment plants to the reuse purposes are estimated; the implications related both to the organizational and management problems of the treatment-reclamation system and to the methodological and technical aspects relative to waterpricing policies are also analysed. INTRODUCTION Faced with worsening environmental problems, planning and management strategies of wastewater reuse both as an additional resource to keep up with increasing demand and as environmental protection tool to turn wastes into resources are a must. Correct knowledge of the dynamics related to water reuse and the resulting possible scenarios are a prerequisite for correct planning of actions on the territory; local as well as regional and national planning has necessarily to consider problems related to the definition of wastewater quality standards and optimal treatments to make waters adequate for different uses, to the definition of the environmental benefits and risks related to reuse policies and, in cost-benefit terms, to the identification of an economic return threshold for the required reuse works to be implemented. In that sense, the main obstacle to treated wastewater reuse is the treated wastewater cost to be charged to users, since distribution costs add up to treatment costs. On the contrary, if we consider reuse as a wastewater disposal tool, or better to say a “non-disposal” tool, in that it is by itself an environmental benefit, it can be assumed that part of treatment costs should be borne by the community, that being the primary beneficiary of pollution abatement. Such an assumption is in line with the Directive 2000/60/EEC (that establishes a framework for the community action in the matter of waters and that follows on the directive 91/271/EEC) where art. 9 (Recovery of costs for water services) states in paragraph 1: “Member states shall take account of the principle of recovery of the costs of water services, including environmental costs …, and in accordance in particular with the polluter pays principle” Such preliminary remarks that anticipate some of the conclusions of this paper, are needed to justify the spirit and approach of this work that moves through broad though not fully and explicitly reported evaluations to recognize wastewater reuse an environmental rather than an economicproduction value. In agriculture, for instance, wastewater reuse will be a small amount of the resource globally necessary but it will be strategic for some areas with severe water scarcity. The strategic value of such a resource is related to its being a substitute for the water currently used, thereby contributing to reduce indiscriminate abstraction. Of course, in areas subject to significant groundwater withdrawal, the use of wastewater has to be accompanied by a plan to prevent on-going abstraction. SECTORS OF POSSIBLE REUSE The possible sectors of wastewater reuse mainly fall into four categories: agricultural, industrial, urban and environmental-recreational. Table 1 shows the main uses within each of these categories each of them having specific and different characteristics both in terms of water quality and distribution modes, with inevitable effects on the technologies to be adopted (starting from advanced treatments downstream the standard treatment). 129
In any case, implementing wastewater reuse requires defining quality criteria to comply with two fundamental conditions: − −
To make water suitable for the specified reuse; To protect in any case the involved population and workers from direct or indirect sanitary risks related to reuse as well as, more generally, to protect the environment from contamination risks.
Table 1. Reuse categories – major risks and constraints
AGRICULTURAL
CATEGORIES OF REUSE Wood production Fodder production Fruit production Production of processed and cooked food Production of food to be eaten fresh
LANDSCAPE
Irrigation of public and private green areas Municipal uses (water closet effluents) Wash of roads, buildings, vehicles
INDUSTRIAL
ENVIRONMENTAL
Air conditioning
Groundwater recharge Control of salt water intrusion Control of subsidence phenomena Artificial wetland or supply in wetland Impoundments and ponds for recreational purposes (fishing, bathing…) Cooling water Boiler feed water Process water
MAJOR RISKS AND CONSTRAINTS TO DEFINE EFFLUENT QUALITY REQUIREMENTS AND MODES OF USE Possible health-sanitary risks due to the presence of pathogens (viruses, bacteria and parasites); possible soil and groundwater pollution (persistent organic compounds, nitrates, metals, dissolved solids); product acceptability on the market Possible health/sanitary risks due to the presence of pathogens; corrosion effects, dirtying and plugging of delivery systems; possible interconnection with drinking water waterworks with possible resulting health/sanitary risks Possible health/sanitary risks due to the presence of pathogens; possible groundwater pollution. Possible eutrophication; toxicity to aquatic life Possible health/sanitary risks for the production of aerosols in cooling towers; effects of corrosion, dirtying and plugging; interference in the process.
In the economic analysis we considered the types of reuse more easily feasible, among the reported ones, and for which the economic factor plays a fundamental role, that is agricultural and industrial reuse. In the case of reuse for industrial purposes, the operation cycle of facilities can be planned on yearly basis, whereas reuse for agricultural purposes concentrates the regime operation cycle of facilities in the irrigation season that generally extends from April to October, each month having different climatic patterns and precipitation regimes. In the framework of optimal management of reused water for irrigation purposes, reuse could serve to meet the basic demand and water from other sources could supplement the water resource in peak periods: we refer to such practice as “supplemented irrigation”; as explained later, it allows reusing greater amounts as compared to the assumption of meeting the irrigation demand through wastewater only. The following tables gives the monthly consumption coefficients used in the three assumptions of use and the resulting reuse potential. Of course, the reuse potential with respect to the discharge potential is minimum in the case of reuse for irrigation, and maximum in the case of reuse for industry. 130
Table 2. Consumption coefficients per type of use Months
Irrigation (%) (1)
Supplemented irrigation (%)
Industrial
April May June July August September October
0.22 0.61 0.96 1.00 0.96 0.48 0.13
0.36 1.00 1.00 1.00 1.00 0.80 0.20
300 days/year
(1) Viparelli’s assumption, 1981 Based on these assumptions, the reuse potential is lower than the discharge potential in a percentage that differs depending on the type of use (Table 3).
Table 3. Reuse potential with respect to the discharge of facilities Type of use
% rate of use
Industrial
82.1
Supplemented irrigation
44.2
Irrigation
34.0
POTENTIALS OF REUSE FACILITIES The economic evaluation of the cost of reuse, both in terms of investment and of management costs, was performed on the basis of the type of reuse (irrigation and industry) as well as of the plant potentials, of the pre-existing treatment chain, of the possible supplemental treatment technologies depending on the quality of discharge (into the soil or receiving water) and of operational environmental conditions. Facilities were subdivided into two macro-categories, depending on the effluent quality threshold levels and thus of the treatment components required to achieve them: − −
Type A facilities: those for which effluents are discharged into large receiving water or into the sea and where the effluent denitrification and tertiary treatment unit is not present; Type B facilities: those for which effluents are discharged into the soil, and where effluent denitrification and tertiary treatment are present (filtration).
Then, wastewater treatment facilities were subdivided into potential classes, determined according to the number of inhabitants served and of three assumptions of water discharge, defined on the basis of the assigned water supply value, “low”, DI1, “medium”, DI2, and “high”, DI3 (Table 4). Table 4. Values of water supply assumed in the computation example. Values are expressed in litre/inhabitant*day. Population class
Number of inhabitants
Computation assumption DI1
DI2
DI3
1
Smaller than or equal to 10,000
250
300
350
2
Greater than 10,000 and smaller than or equal to 100,000
350
400
450
3
Greater than 100,000
450
500
550 131
Actions to adapt the effluent treatment lines for reuse were defined by taking as a “basic” facility a scheme that ensures biological removal of biodegradable organic matter, diversified by the presence or absence of primary sedimentation and of the tertiary treatment stage related to the quality of discharge. Based on the pollutant concentration limits established under the European regulation in force and taking into account “conventional” technologies and treatment processes, the following supplementary treatment stages were considered:
− −
Biological stage to remove nitrogen; Chemico-physical stage to remove fine solids and pathogenic micro-organisms.
The first treatment is assumed to be implemented by integrating an active sludge scheme with a pre-denitrification stage; the second treatment is assumed to be accomplished through “direct” filtration on granular beds, with in line coagulation, followed by a disinfection stage. In particular, for the filtration stage, economic comparisons led to choose pressure filters for class 1 and class 2 facilities, and gravity filters for higher potential facilities, i.e. class 3. As for disinfection, two different treatment lines were analysed: the first one included only one chlorination stage, whereas the second one included two stages in series: a stage with ultraviolet radiations followed by a stage with the addition of peracetic acid as safety disinfectant. We didn’t consider the adaptation interventions relative to the processing units that do not require substantial additional building or operational works, like the primary and secondary sedimentation stages and the whole sludge treatment line. In this respect, we should consider that for the considered facility schemes, the increase in sludge production, attributable to greater efficiency in the removal of suspended solids, is substantially compensated by lesser production of biological sludge as a result of older sludge adopted in nitrification-denitrification processes. Finally, assuming reuse for irrigation purposes, the nitrification-denitrification process was designed for an average temperature of 20°C (reuse in the spring-summer period), whereas in the case of industrial reuse (all year around) the design temperature was assumed to be 13-15°C in the winter period and constantly 20°C under summer operation conditions. This differentiation resulted in a considerable increase of the denitrification volume since these processes highly depend on temperature. In the Table 5, the supplementary actions to comply with the limits for reuse established under the Italian regulation are reported according to the effluent quality of the existing treatment facility.
Table 5. Conventional treatments required for adapting treatment facilities depending on the discharge quality for reuse purposes. Treatment stages required for complying with the effluent quality limits for reuse Biological treatments Chemicophysical treatments
132
Nitrogen removal
Quality of treated discharge Type A
Type B
Nitrification
REQUIRED
NOT REQUIRED
Denitrification
REQUIRED
NOT REQUIRED
REQUIRED
NOT REQUIRED
REQUIRED
POSSIBLE ADAPTATION
Defosfatation Removal of Filtration suspended Coagulation solids Disinfection
REQUIRED ADAPTATION
TECHNICAL-ECONOMIC ANALYSIS The technical-economic analysis was performed referring to the cost indexes of 2004 and thus, the corresponding costs were assessed as to that date; the use of the data referred to different time horizons have to be discounted through adjustment indexes. However, this is a marginal aspect since the aim of this research is to define planning criteria for wastewater reuse, and comparing scenarios is thus more important than considering the absolute value of each single cost unit. The analysis of wastewater treatment facilities concerned: a) b)
The identification and estimate of the additional costs required to adapt treatment facilities, depending on the effluent quality (Type A/Type B), to the parameters imposed for reuse; Aspects related both to the organization and management problems of the treatment-reclamation system and to the methodological and technical aspects relative to water-pricing policies.
Such a distinction is important in that, for the time being and in theory, it is possible to have three different management bodies for the reuse cycle: one for the treatment facilities, another for the reuse facilities and another one for the facilities of use. Of course, such a structure should not affect the fixation of cost regimes and, consequently, of water-pricing. Cost analysis was based on the assumption of considering not the capital and management costs of a completely new reclamation facility, but the additional capital and management costs to reach, from standard quality parameters effluent, the reference parameters for reuse. Cost analysis has taken into consideration the “additional” treatment for reuse (Table 6), subdivided into two major items:
− −
Investment/capital costs, estimated as a function of public funding or through borrowing from the financial market; Operational costs
and further broken down into:
− −
Fixed costs, i.e. the costs independent of the type of reuse: the costs falling within this category are those that do not vary in size with the variation of the amount of reuse of treated effluents; Variable costs, i.e. the costs dependent on the kind of final use: the costs that fall within this category are those that vary in size with the variation of the amount of reuse of treated effluents.
Table 6. Breakdown of additional costs FIXED COSTS • •
Capital costs/ Financial costs Building works Electromechanical supplies
• •
Operational costs Personnel Maintenance and replacement of parts
VARIABLE COSTS • •
Operational costs Energy costs Reactants
Table 7 shows the different additional cost items of treatment stations.
133
134 Table 7. Cost items of treatment stations WATER TREATMENT PROCESSE S
COSTS
BIOLOGICAL TREATMENT ADAPTATION OF FACILITIES
OPERATION COSTS
ELECTROMECHANICAL SUPPLIES
INVESTMENT COSTS
BUILDING WORKS
POWER CONSUMPTION
REMOVAL OF ORGANIC MATTER AND NITROGEN
REMOVAL OF PHOSPHORUS
SUSPENDED SOLIDS REMOVAL
DISINFECTION
PRE-DENITRIFICATION
NITRIFICATION
CHEMICAL PRECIPITATION
COAGULATION
PRESSURE FILTERS
GRAVITY FILTERS
CHLORINE COMPOUNDS ADDITION
ULTRAVIOLET RADIATION
REACTOR
INCREASE IN VOLUME OF THE OXIDATION REACTOR
---
---
BACKWASHING TANKS
FILTRATION TANKS AND FITTINGS
INCREASING CONTACT TANK
INCREASING CONTACT TANKS
ACCUMULATION OF REACTANTS
TANK OF RAPID MIXTURE OF REACTANTS
BACKWASHING FACILITIES
----
INGCREASING RADIANT LAMPS
BACKWASING OF FILTERS
----
INCREASE IN RADIATION PRODUCTION
---
INCREASE IN THE DISINFECTANT AGENT AND REACTANTS DECHLORINATION
---
RECIRCULATION OF MIXED LIQUOUR AND INCREASE IN SLUDGE RECYCLE
SUBMERGED MIXERS
INCREASED AERATION (COMPRESSORS AND DIFFUSERS)
RECIRCULATION OF MIXED LIQUOR AND SLUDGE MIXING OF BIOLOGICAL SLUDGE
CONSUMPTION OF CHEMICAL REACTANTS
CHEMICO-PHYSICAL TREATMENTS
---
ADDITIONAL AERATION
---
DOSAGE OF REACTANTS
METER PUMP OF REACTANTS AND RAPID MIXER
DOSAGE AND MIXING OF REACTANTS
DOSAGE AND MIXING OF REACTANTS
PRECIPITATION OF PHOSPHORUS
COAGULATION AGENT
PRESSURIZED RESERVOIRS FEED PUMPS
BACKWASHING UNIT
LIFTING FOR PRESSURIZED SUPPLY BACKWASHING OF FILTERS
---
Analysis of capital costs Capital costs analysis has taken into consideration the building works and electromechanical supplies. The costs of building works are evaluated net of possible costs for expropriating new areas. The considered works are illustrated in the following box: Table 8. Schematic capital costs* analysis Types of costs Building works Excavation / backfills, impoundments, flooring asphalt, fencing Pressure filters Gravity filters Electromechanical supplies blowers mixers mixed liquor pumps pressurized filtration: − filters - lifting plant for filtration − lifting plant for backwashing − blowers gravity filtration: − nozzles − hydraulic valves − electrical facilities − lifting plant for filters − lifting plant for backwashing − filter blowers − miscellaneous UV lamps Electromechanical supplies relative to reactants: Meter pump
Measurement Unit
Unit cost €
€/m3
150
€/m3 €/m3
150 400
€/Nm3/g €/N €/KWh
min 0.21-max 2.81 min 5.08–max 16.67 min 5.05-max 16.66
€/m2 €/kWh €/kWh Nm3/g
min 8,560-max 10,700 min 648-max 1,500 min 648-max 1,500 min 0.21-max 2.81
units €/filter €/filter €/kWh €/kWh nm3g €/m3 units
0.70 15,000 1,500 min 648-max 1,500 min 648-max 1,500 min 0.21-max 2.81 4,80 min 2,500-max 11,750
units
900
/
N.B. for type B facilities the additional costs concern UV lamps and dosage unit
Table 9. Adaptation costs of type A facilities Facility potential (AE)
Building works [€]
Electromechanical supplies [€]
Total [€]
2,000
33,835
114,862
148,697
5,000
84,588
172,223
256,811
10,000
169,176
210,153
379,329
20,000
330,496
438,532
769,028
30,000
495,744
615,104
1,110,847
40,000
633,792
779,777
1,413,568
50,000
792,240
955,307
1,747,547
70,000
1,109,135
1,301,753
2,410,888
100,000
1,584,479
1,722,855
3,307,334
250,000
6,089,005
1,645,931
7,734,936
500,000
11,430,915
2,010,982
13,441,897 135
The minimum and maximum values indicated in the table basically depend on the potential of facilities. Based on such assumptions, the costs of investments were determined separately for the building works and for electromechanical supplies depending on the size of facilities per IE. Table 9 gives, for instance, the results obtained in the case of adaptation of type A facilities and assuming a more onerous operation of the existing facility, that is in the presence of primary treatment, at a temperature of 15°C, assuming to adopt the UV + peracetic acid scheme for disinfection. Based on the previous results, the cost of investments per IE was determined, again assuming type A facilities.
Table 10. Unit adaptation costs of type A facilities - €/IE Type of biological treatment / IE
2,000
50,000
500,000
15°
20°
15°
20°
15°
20°
With primary treatment
74.35
65.85
34.95
26.97
26.88
20.01
Without primary treatment
78.57
66.93
38.43
28.82
31.61
19.80
These results point to: 1. a considerable difference in the cost per inhabitant equivalent depending on the size of facilities (difference of about 50 euros between small and bigger size facilities); 2. the cost difference (€/IE), depending on the presence or absence of primary sedimentation, ranges between 12.9% and 34.4% at 15°, between 17,4% and 59.6% at 20°. Similarly for type B facilities, considering the costs given in table 4.3, the investments costs briefly illustrated in table 4.6 are obtained.
Table 11. Additional costs for the adaptation of type B facility Facility potential (IE)
Electromechanical supplies [€]
2,000
48,724
50,000
252,136
500,000
512,847
The comparison between Tables 8 and 9 shows considerable reductions with respect to the previous assumptions - they are significant in absolute values – since we move from about 100,000 € for facilities of 2,000 IE to about 13,000,000 € for facilities of 500,000 IE for the overall investment costs.
Analysis of operational/management costs The analysis of operational costs considered the following items: − Personnel costs; − Cost for dosage of reactants; − Power consumption; − Costs for maintenance and replacement of parts; − Financial costs. In the global calculation, the economic return of investments was not taken into account, since increases in return are fixed as objectives of the Institutional Bodies in charge of determining both the water price and its variation. 136
The gain in productivity objectives were not taken into account, since they are fixed by the Institutional Bodies in charge. For the purposes of the global impact on water price, the two above-mentioned components produce opposite effects: economic return produces an increase in the total cost per m3, whereas gain in productivity produces a reduction; therefore, the global effects depend on how big or how small such values are. From the performed analysis, it came out that depending if adaptation works refer to type A or type B facilities, and thus depending on the importance of adaptation interventions for reuse purposes, substantial changes are observed for these items of costs. In the case of additional interventions on type B facilities, the following cost items considerably decrease: − − −
The costs for the personnel, in that it necessitates a minimum amount of working hours for chemical control; nevertheless, it is more profitable to have management performed by the managing body of the treatment facility rather than using external entities. The costs for power consumption, since they concern the consumption relative to UV lamps and the operation of dosage facilities; Financial costs, so much so to make the difference between public and no public funding not significant; this occurs because investment costs are almost non-existent.
No significant variations are observed for the costs of reactants used in the two assumptions. Analysis of personnel costs The analysis of the cost of the personnel was based on two assumptions: 1. Management of works, of reclamation facilities and the corresponding control performed by the managing body of the treatment facilities; 2. Management of works, of reclamation facilities and corresponding control performed by a body other than the managing body of the treatment facilities. This double assumption is based on the consideration that some saving could be possible in the use of the existing personnel of the treatment facility managing body, as compared to the second assumption. In the first assumption, an additional activity was assumed only for the head of the facility since the other professional profiles (chemists, facility maintenance personnel) can be suitably employed without additional costs. In the second assumption, i.e. entrusting this task to an external management body, it requires a dedicated organization that inevitably leads to higher costs per facility. The comparison between the first and the second hypothesis highlights possible saving in the use of existing personnel in favour of the manager of the treatment facilities.
Analysis of reactant costs The analysis of additional costs of reactants has taken into account three types of reactants needed to adapt the existing facilities to reuse parameters: − − −
Aluminium polychloride at 15% for coagulation in line; Sodium hypochlorite at 12% of Cl2 for disinfection; or alternatively Peracetic acid in solution at 15%, with bacterio-static function to be combined with UV rays treatment.
Costs of power consumption The costs of power consumption were calculated as a function of the potentials of facilities and of reference temperatures for nitrification and denitrification (15° and 20°C), attributing a unit cost of 0.1 137
€/KWh, on the basis of the subscribed demand and the corresponding power consumption for each of the electromechanical supplies. Power consumption and corresponding costs were estimated for the following machinery: blowers, mixers, return pumps, UV rays, pressure filters (filters, lifting plant for filters, lifting plant for backwashing, blowers), gravity filters (electrical equipment, lifting plant for filters, lifting plant for backwashing, blowers), machinery relative to additional reactants (dosage plant).
Maintenance costs and replacement of parts Maintenance costs of building works and electromechanical supplies were estimated on the basis of the following assumptions: − −
building works: a life cycle of the investment equal to about 25 years was assumed, with a maintenance cost equal to an average yearly rate of 1% on the amount of the whole cost of specific investment; electromechanical supplies, in view of both increased wear and tear in operation and of the need of replacing mechanical parts, an average life cycle of 8 years was assumed, with a yearly maintenance rate of 5% out of the amount of the whole specific investment cost.
Table 12. Maintenance and replacement of parts Yearly maintenance rate
Type of works
Life cycle
Building works
25 years
1%
Electromechanical machinery
8 years
5%
Financial costs Capital costs fall within the operational/management costs in the form of financial and depreciation costs in relation to the type of funding of building works and electromechanical supplies. Therefore, these costs were estimated on the basis of the following assumptions: − −
with public funding of the investment, in this case financial costs concerned only linear technical depreciation with the assumption of building up the invested public capital; without public funding of the investment, in this case the financial costs concerned, on one hand, the share in the capital and, on the other hand, the share of interests, with the assumption of having recourse to funding through loan.
A further and more complex hypothesis, i.e. having recourse to external funding with venture capital, was not considered since it also requires assumptions on the type of legal structure of the managing body and the subdivision of risk for the determination of risk rates to be included in the financial costs. The assumptions for the two considered hypotheses are shown in Table 13.
Table 13. Hypothesis of financial cost of investments
138
Type of works
Life cycle
Yearly rate of interest 7% (a)
Linear depreciation rate (b)
Building works
25 years
Financial rate 0.0858
Depreciation rate 4%
Electromechanical machinery
8 years
Financial rate 0.1674
Depreciation rate 12.5%
A significant cost incidence difference is evident between the two hypotheses: • •
building works – difference of 115% per year electromechanical supplies – difference of 34% per year.
GLOBAL RESULTS OF ANALYSES Based on the assumptions and hypotheses illustrated in the previous chapters, a general picture of the economic analysis is outlined. The final results are presented, first for the hypothesis of type A facilities and then for type B facilities, assuming the presence of primary treatment, temperature of 15°, dosage of reactants combined with UV. The last hypothesis is more onerous than the others. First of all, the results of the annual costs in absolute values and in m3 for the three types of small (2,000 IE), medium (50,000 IE) and big size (500,000 IE) are given. The analyses were performed assuming three types of possible uses (industrial, irrigation and supplemented irrigation) to which correspond - the facility being equal - different values of reclaimed water volumes with respect to which the unit cost is evaluated.
Table 14. Total yearly cost for the adaptation and management of type A facilities – Primary treatment – 15° - Without public funding – Internal Management – Hypothesis of UV reactants – Values in € OPERATIONAL COSTS /IE A. Fixed costs A.1 Operational costs Personnel Maintenance and replacement of parts A.2 Financial costs (1) Building works Electromechanical supplies TOTAL (A1+A2)
2,000
50,000
500,000
36,801 30,720 6,081 22,131 2,903 19,228 58,932
78,728 23,040 55,688 227,893 67,974 159,918 306,620
230,218 15,360 214,858 1,317,411 980,773 336,638 1,547,629
B. Variable costs for industry Electrical power Reactants C. Variable costs for supplemented irrigation Electrical power Reactants D. Variable costs for irrigation Electrical power Reactants
12,771 4,926 7,845
384,095 122,606 261,490
3,817,732 549,112 3,268,620
6,845 2,640 4,205 5,568 2,148 3,420
205,875 65,717 140,158 167,466 53,456 114,009
2,046,304 294,324 1,751,980 1,664,531 239,413 1,425,118
TOTAL (A+B) INDUSTRY TOTAL (A+C) SUPPLEMENTED IRRIGATION TOTAL (A+D) IRRIGATION
71,703 65,777 64,500
690,716 512,495 474,086
5,365,361 3,593,933 3,212,160
C/m3 industry C/m3 supplemented irrigation C/m3 irrigation
0.55 0.95 1.14
0.16 0.22 0.27
0.10 0.12 0.14
139
From Table 14, in the case of type A facilities, the following is found: −
A sharp reduction in the cost per m3 per year moving from small to large size facilities;
−
A significant difference in cost between the different types of uses. This difference decreases both in absolute terms and as percentage, depending on the size of the potentials of facilities. The difference is about 0.6 euros per m3 between industrial and irrigation use for small size facilities (2,000 IE) and about 0.04 euro per m3 for large size facilities (500,000 IE)
−
Among variable costs, a significant increase in the cost of reactants.
Table 15. Incidence of costs out of the total for type A facilities - % values. OPERATIONAL COSTS / IE
2,000
50,000
500,000
82.2
44.4
28.8
Industry
10.9
37.9
60.9
Supplemented irrigation
6.4
27.3
48.7
Irrigation
5.3
24.0
44.4
A. Fixed costs B. Variable costs of reactants
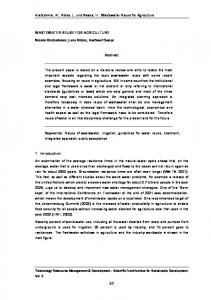
The first effect is to be attributed to scale economy; the second one to higher consumption of reactants related to a higher use of treated wastewater, for larger size facilities. Secondly, minimum economic return thresholds for further interventions are possible for facilities greater than 50,000 IE. Quite significant results are obtained for facilities greater than 100,000 IE. In the following graphs the additional costs for the three types of reuse assuming adaptation of type A facilities without funding are given together with the possible saving per m3 of reuse treated water when adaptation works are made through public funding.
Industry
Suppl. Irrig.
Irrigat.
1.30 1.20 1.10 1.00 0.90 0.80
€/m3
0.70 0.60 0.50 0.40 0.30 0.20 0.10 -
AE 2 000
5 000
10 000
20 000
30 000
40 000
50 000
70 000
100 000
250 000
500 000
Fig. 1. Adaptation costs for reuse and management of type A facilities – Hypothesis without public funding. 140
Supplemented irrigation
Industry
Irrigation
1.30 1.20 1.10
€/m3
1.00 0.90 0.80 0.70 0.60 0.50 0.40 0.30 0.20 0.10 2 000
5 000
10 000
20 000
30 000
40 000
50 000
70 000
100 000
IE
250 000 500 000
Fig. 2. Adaptation costs for reuse and management of type A facilities – Hypothesis with public funding
Similarly, as for the adaptation costs of type B facilities, Table 16 illustrates the results of annual costs in absolute values and per m3 for three types of small-size (2,000 IE), medium-size (50,000 IE) and large-size facilities (500,000 IE).
In this respect, the following is observed: – The sharp reduction in the cost per m3 per year from small-size to large-size facilities; – The significant cost difference between the three types of uses; this difference decreases with size.
This effect, also in this case, is basically due to the scale economy of facilities.
141
Table 16. Total annual cost for adaptation and management of type B facilities – Hypothesis of reactants combined with UV – Values in € OPERATIONAL COSTS /AE
A. Fixed costs A.1 Operational costs Personnel Maintenance and replacement of parts A.2 Financial costs (1) Building works Electromechanical supplies TOTAL (A1+A2)
2,000
50,000
6,276 3,840 2,436 8,156
16,449 3,840 12,609 42,208
-
-
500,000
29,512 3,840 25,672 85,851 -
8,156 14,433
42,208 58,657
85,851 115,363
B. Variable costs for industry Electrical power Reactants
8,745 900 7,845
276,190 14,700 261,490
3,452,520 183,900 3,268,620
C. Variable costs for supplemented irrigation Electrical power Reactants
4,687 482 4,205
148,037 7,879 140,158
1,850,550 98,570 1,751,980
D. Variable costs for irrigation Electrical power Reactants
3,812 392 3,420
120,418 6,409 114,009
1,505,298 80,180 1,425,118
23,177 19,120 18,245
334,846 206,694 179,075
3,567,883 1,965,914 1,620,662
TOTAL (A+B) INDUSTRY TOTAL (A+B) SUPPLEMENTED IRRIGATION TOTAL (A+B) IRRIGATION C/m3 industry C/m3 integrated irrigation C/m3 irrigation
0.179 0.275 0.323
0.078 0.089 0.100
0.066 0.068 0.072
As shows the Fig. 3, economic return is already evident for the small-size facilities (20,000 IE for the two types of irrigation service; 10,000 IE for industry).
Industry
Suppl. Irrig.
Irrig.
0.350
0.300
€/m3
0.250
0.200
0.150
0.100
0.050
-
2 000
5 000
10 000
20 000
30 000
40 000
50 000
70 000
100 000
250 000
AE 500000
Fig. 3. Adaptation costs for reuse and management of Type B facilities – Hypothesis without public funding
142
Since the capital costs have considerably reduced, in this case the double hypothesis of public funding/no public funding is negligible, as shown in the next figure.
Industry
€/m3
Supplem. Irrigation
Irrig.
0.350
0.300
0.250
0.200
0.150
0.100
0.050
-
AE 2 000
5 000
10 000
20 000
30 000
40 000
50 000
70 000
100 000
250 000
500 000
Fig. 4. Adaptation costs for reuse and management of type B facilities – Hypothesis with public funding
COMPARATIVE ANALYSIS BETWEEN THE TWO TYPES OF INTERVENTION Based on the results of the analyses, a comparison was made of the cost estimates of adaptation of facilities and their management according to the effluent quality, i.e. of type A or type B. The following came out: − the presence of possible significant differences in additional costs for the two different effluent qualities analysed; − the presence of possible economic return thresholds and/or the indifference between both. Table 17.Additional costs* for the adaptation of facilities – UV combined reactants – 15°C Costs €/m3 Type of use / IE
2,000
Industry Supplemented irrigation Irrigation
0.55 0.95 1.14
Industry Supplemented irrigation Irrigation
0.18 0.28 0.32
50,000 Type A facility 0.16 0.22 0.27 Type B facility 0.08 0.09 0.10
500,000 0.10 0.12 0.14 0.07 0.07 0.07
*hypothesis without public funding, with primary treatment
143
Firstly, the comparative analysis shows that for small-size facilities adaptation and management costs of type A facilities are more than 3 times greater than the corresponding costs of type B facilities; for larger size facilities, a greater value – from 30% to 50% - was achieved depending on the type of use. Secondly, a great difference in cost is observed between the two uses, in particular between industrial and irrigation use. The differences in cost are equal to 0.37 €/m3 for industrial use, to 0.82 €/m3 for irrigation use for facilities of 2,000 IE; respectively of 0.03 €/ and 0.07€/m3 for larger size facilities (500,000 IE). Depending on the size of facilities, these differences tend to be smaller in absolute terms, but not in relative terms. Moreover, such differences are expectedly smaller in absolute terms when considering the hypothesis of public funding of investments. Therefore, scale economy of facilities, when assuming to use reclaimed wastewater, results in a considerable reduction in additional cost differential in absolute terms but not in percentage terms. This is quite evident from Fig. 5 In other terms, beyond 100,000 IE facilities, the difference in cost for adaptation and management of facilities with respect to the two discharge hypotheses is considerably reduced.
Industry
€/m3
Suppl. Irrig.
Irrig.
0.90
0.80
0.70
0.60
0.50
0.40
0.30
0.20
0.10
0.00 2 000
5 000
10 000
20 000
30 000
40 000
50 000
70 000
100 000
250 000
500 000
Fig. 5. Cost difference per m3 assuming no public funding for type A and type B facilities.
Secondly, the differences in cost between public funding and no public funding are significant: − − −
For industrial uses for facilities up to 20,000-30,000 IE; For supplemented irrigation uses for facilities up to 50,000-60,000 IE; For irrigation purposes for facilities up to 60,000 IE.
Beyond such thresholds, additional cost differentials, though existing, are not significant. In conclusion, the economic analysis highlights the following: 144
AE
In terms of investments: a) There is a significant difference in capital cost per IE to adapt type A facilities to reuse parameters. As observed, these costs vary from a peak of about 79€ per IE for facilities of 2,000 IE to a minimum of about 20€ per IE for facilities of 500,000 IE. Capital costs are present in the operational/management costs function through the financial costs of the invested capital. In this case, the capital costs accounted for about 80% of total costs for large size facilities (500,000 IE); b) Capital costs to adapt type B facilities to reuse parameters are not significant, since they are almost completely negligible with respect to operational costs. In terms of operational/management costs: c) There are significant differences in additional cost per treated m3 for type A facilities smaller than 50,000 IE. Such cost differentials are greater for irrigation use as compared to industrial use. Such differences in cost are not significant for facility threshold greater than 50,000 – 60,000 IE and concern the three analysed uses. Moreover, significant cost differentials are observed between investment funding through public resource and bank loans for facilities up to about 50,000 IE; beyond this threshold no significant absolute differences are evident. d) Adaptation costs of type A facilities are considerably greater than the adaptation costs of type B facilities. However, if measured in absolute terms, cost differentials of adaptation of the two types of facilities are significantly higher for facilities around 50,000 IE. For larger size facilities, economies of scale have significant effects, with the fundamental and crucial assumption of effective use of treated wastewater.
MANAGEMENT ASPECTS Finally, the management model and the procedures for water-pricing regimes were examined. The wastewater reclamation process for reuse is one step of the Integrated Water Service. Based on this assumption, the IWS would consist of four components: waterworks, sewage, treatment, and additional advanced treatment for reuse. Based on such considerations, the following situations might exist, with reference to the management model and the fixation of the corresponding tariffs to cover capital and management costs:
The holder of the treatment facility is the same as for the reclamation facility The holder of the treatment facility is different from the holder of the reclamation facility
Water price fixed by the holder of the treatment facility; in this case, the price to recover additional costs are intended to be charged to the integrated water service, or to the community; therefore, treatment price fixation includes the additional cost for reclamation; Water price to cover the additional installation and management costs of reclamation, fixed by the holder of the latter; Price charged to the holder of the treatment facility, or to the community.
According to this scheme, in the first case where the holder of treatment facilities is the same as for reclamation facilities, the additional price to cover the reclamation costs for reuse can be: − Charged to the integrated water service (positive increase in price); − Paid through increasing productivity (no effect on the cost recovery); 145
−
Charged to the State or the Regions that cover additional reclamation costs through public contribution (no effect on the value and variations of prices).
In the second case, where the holder of the treatment facility is not the same as for reclamation facility, the additional water price to cover reclamation costs for reuse can be:
−
−
Charged to the holder of the treatment facility (effect to be analysed on the values and the variations of global water price, depending on the gain in productivity objectives of the integrated water system, on the implementation of possible scale economies of the facilities, etc.); Charged to the State or the Regions that cover the additional costs of reclamation through public contribution (no effect on the values and variations of global water price).
The performed analysis highlighted that there is an economic-management return in the case of a single holder of the IWS whose competence is also extended to wastewater reclamation. First of all, the reclamation process has an additional impact in terms of physical investment, of chemical treatments and type of management with respect to the on-going treatment process, so that scale economies can be adopted especially for some fixed installation and management costs and depending on their size. Secondly, with a single holder of the IWS extended to the reclamation stage, the process of covering additional costs for reclamation would be more properly solved. In fact, from the economic viewpoint, assuming that investment costs in fixed capitals are public, a double question is raised: 1. “who pays for the additional reclamation costs” of reclaimed waters; 2. additional costs for reclamation, as shown by the economic analysis, cannot be “transferred” downstream to the end user, as it is the case under the present regulation of some countries including Italy, and they have thus to be covered “upstream the process”. In the case of a single holder, the reclamation cost should be part of the methodology to define the model for price fixation of the IWS and, subsequently, of the determination of the price cap procedure for the price variation depending on the different objectives (productivity, quality, social sustainability, etc.).
CONCLUSIONS All the above can hardly lead to some conclusions since, in any case, planning of investments on reuse cannot be solely based on technical-economic considerations. “Choosing reuse” cannot leave aside some contingent aspects related, for instance, to irrigation suitability and environmental condition of the territory where actions are taken; therefore, attention is drawn on some indications that could orient planning in order to make choices and fix priorities.
− Priority should be given to the areas subject to groundwater impoverishment: supplying a − − − −
146
substitute, economically competitive resource is the first step towards reclamation. In the cases where reuse is to the benefit of existing irrigation areas, a double benefit would be obtained: a reduction in the cost of intervention and immediate use of the resource since the irrigation practice will be consolidated. Investment economies will be possible in the facilities for which reuse treatment units are already present but where the facilities for use have not been identified yet. Planning should also take into account the huge irrigation demand of some highly suitable agricultural areas that, due to their geographic location and bad groundwater conditions, have no other resource available. Works in need of structural integrations need to be completed to be operational: in order not to make the performed investments fruitless and to prevent rapid degradation of the implemented works, such interventions are a priority.
− In the case of small potential facilities, combining the effluents of several facilities is desirable to get a quantitatively significant reuse resource.
− The “non disposal” benefit for the areas highly suitable for tourism should be taken into account. This list of considerations is not ranked in a priority order deliberately. Planning of interventions for reuse has to start always and in any case from a cost-benefit analysis that should also include the environmental benefits that are not always quantifiable.
REFERENCES Cavallo L., Coco G., (2002) La remunerazione del capitale investito nelle imprese soggette a regolazione, in Economia Pubblica, anno XXXII, n. 4. Cesari G., Lotti C. (1999). Riutilizzo delle acque reflue per l’irrigazione. Giornata mondiale dell’acqua, Roma, 29 marzo. Colombo M.G., (1997). La struttura tariffaria dei servizi di acquedotto, fognatura e depurazione, PROAQUA Paper n. 97/09. Commissione CE COM 477/2000 del 26.07.2000 Fazoli R, Tiraoro L.. (2003). La regolazione Italiana dei servizi idrici nell’attività del NARS – Ministero del Tesoro e nelle deliberazioni CIPE, in Economia e Politica Industriale, n. 118. Hamdy A. Irrigation with Wastewater. In Atti del Corso Avanzato su “Riutilizzo delle Acque Reflue in Agricoltura”, Bari, 8-10 Giugno, 1992; Istituto Pugliese di Ricerche economiche e Sociali. Fabbisogni e disponibilità idriche per uso industriale in Puglia, Bacini Idrici, Regione Puglia, Aprile, 1999; Lucchetti R., Robotti L. (2000). Aspetti economici della depurazione delle acque reflue, in Economia Pubblica, anno XXX. Percolo M. (2003). cL’efficienza tecnica nel settore dei servizi idrici, in Economia Pubblica, anno XXXIII, n.5. Takashi Asano, Wastewater Reclamation and Reuse, in particular Chapter 29 “The cost of Wastewater Reclamation and Reuse”, CRC Press, 2001;
147