first, we present multiple ways to capture the cost-aware application placement .... predicted workload for each application, we resize the virtual machine hosting.
pMapper: Power and Migration Cost Aware Application Placement in Virtualized Systems Akshat Verma1 , Puneet Ahuja2 , and Anindya Neogi1 1
IBM India Research Lab 2 IIT Delhi
Abstract. Workload placement on servers has been traditionally driven by mainly performance objectives. In this work, we investigate the design, implementation, and evaluation of a power-aware application placement controller in the context of an environment with heterogeneous virtualized server clusters. The placement component of the application management middleware takes into account the power and migration costs in addition to the performance benefit while placing the application containers on the physical servers. The contribution of this work is two-fold: first, we present multiple ways to capture the cost-aware application placement problem that may be applied to various settings. For each formulation, we provide details on the kind of information required to solve the problems, the model assumptions, and the practicality of the assumptions on real servers. In the second part of our study, we present the pMapper architecture and placement algorithms to solve one practical formulation of the problem: minimizing power subject to a fixed performance requirement. We present comprehensive theoretical and experimental evidence to establish the efficacy of pMapper.
1
Introduction
Resource provisioning or placement of applications on a set of physical servers to optimize the application Service Level Agreements (SLA) is a well studied problem [6,24]. Typically, concerns about application performance, infrequent but inevitable workload peaks, and security requirements persuade the provisioning decision logic to opt for a conservative approach, such as hardware isolation among applications with minimum sharing of resources. This leads to sub-optimal resource utilization. Bohrer et al. have studied real webserver workloads from sports, e-commerce, financial, and internet proxy clusters to find that average server utilization varies between 11% and 50% [3]. Such inefficient provisioning leads to relatively large hardware and operations costs when compared to the actual workload handled by the data center. However, recently two important trends, viz. server virtualization and the heightened awareness around energy management technologies, have renewed interest in the problem of application placement. The placement logic in the middleware now need to look beyond just application SLAs into increasing energy-related operations costs. In this paper, we investigate the Power-aware Application Placement problem and V. Issarny and R. Schantz (Eds.): Middleware 2008, LNCS 5346, pp. 243–264, 2008. c IFIP International Federation for Information Processing 2008 �
244
A. Verma, P. Ahuja, and A. Neogi
present pM apper, an application placement controller that dynamically places applications to minimize power while meeting performance guarantees. System management costs have escalated rapidly with the growing number of densely packed under-utilized machines in the data center. Virtualization is seen as a solution that can provide the required isolation layer to consolidate applications running on a large number of low utilization servers to a smaller number of highly utilized servers. The virtualization layer typically provides flexible runtime mechanisms for fine grain resource allocation. In fact, high speed live migration of virtual machines is also possible between the physical servers in a cluster. This enables applications in virtual machine containers to be moved at runtime in response to changing workload to dynamically optimize the application placement on physical servers. Thus mechanisms to allow dynamic resizing and migration of virtual machine containers among physical servers enables research in dynamic application placement middleware beyond static provisioning. A second trend that is important for dynamic application placement is the growing awareness about energy consumption in data centers and the significant adverse impact on the environment in terms of CO2 emissions from the cooling systems. The current power density of data centers is typically around 100 Watt per sq.ft. and growing at the rate of 15 − 20% per year [17]. Thus, it is increasingly being realized that inefficient use of servers in a data center leads to high energy costs, expensive cooling hardware, floor space, and also adverse impact on the environment. There is a large initiative in the industry as well as academia to develop technologies that will help to create “green” or environment-friendly data centers that will optimize energy consumption and consolidate hardware resources, besides being sensitive to application performance and availability SLAs. To this extent, a dynamic application placement controller can use virtualization to resize VM containers of applications or migrate VMs at runtime to consolidate the workload on an optimal set of physical servers. Servers unused over a period of time can be switched to low power states to save energy. Further, we observed a fairly large dynamic power range (e.g., the static power of an IBM HS-21 blade was 140Watt and the dynamic potentially non-linear power range was almost 80Watt for the daxpy benchmark). Hence, even in scenarios where servers can not be switched off by consolidation, power savings can be obtained by packing the servers at optimal target utilization. The use of power management techniques during application placement has its own implications. A dynamic application placement controller uses live migration and we found from our testbed experimentation that the cost of live migration is significant, and needs to be factored by the dynamic placement controller. For example, a 512MB VM running HPC benchmarks require almost a minute to migrate and causes a 20-25% drop in application throughput during the live migration. We also observed that a large number of live migrations are required for dynamic placement, thus emphasizing the importance of taking migration cost into account.
pMapper: Power and Migration Cost Aware Application Placement
245
Contributions: In this paper, we make the following contributions to advance the state of the art. We describe the architecture and implementation of a poweraware application placement framework, called pMapper, which can incorporate various scenarios involving power and performance management using virtualization mechanisms. pMapper provides the solution to the most practical possibility, i.e. power minimization under performance constraints. We have implemented the framework, some algorithms, and the interfaces with an existing commercial IBM performance-oriented workload manager. We have benchmarked applications on virtualized server platforms to create utilization-based power models of application and server combinations and quantify the virtualization related costs. The characterization study provides us with insights into the structure of the power-aware placement problem that can be used to design tractable application placement solutions. We used the power models, migration cost models, and power-aware placement algorithms to design a dynamic placement controller that, under various assumptions, performs better than a static or load balancing placement controller with increasing heterogeneity of the server platforms, i.e. their power models. All input models and assumptions in pMapper have been validated on a testbed using a set of benchmark applications. The various algorithms implemented in pMapper have been compared through simulation on real utilization trace data obtained from a large production environment. The rest of the paper is organized as follows. Section 2 describes the various flavors of the problem and the tool architecture. Section 3 discusses the assumptions made in the formulation and validates the assumptions through testbed experiments. Section 4 provides the details of the algorithms. Section 5 describes our implementation and a trace-driven evaluation study of our algorithms. Section 6 presents a comparative discussion with the related work.
2
pMapper: Power and Migration Cost-Aware Application Placement Framework
In this section, we present the pM apper application placement framework for power management and the various optimization formulations for power-aware application placement. We first present the pM apper architecture framework that leverages power management techniques enabled by virtualization. 2.1
Architecture
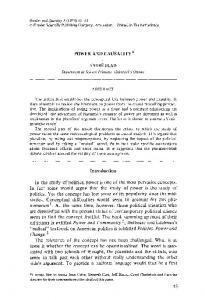
We have designed the pMapper framework to utilize all the power management capabilities available in virtualized platforms. As per the terminology used in [15], power management actions can be categorized as (i) soft actions like CPU idling in the hypervisor, (ii) hard actions like DVFS or throttling and (iii) consolidation actions. Commercial hypervisors drop all the power management actions that are taken by the OS. Further, for multi-tiered applications, a single VM instance may not be able to determine the application end-to-end QoS thus necessitating the need for a power management channel from the the management
246
A. Verma, P. Ahuja, and A. Neogi
CHARACTERIZATION
Placement
ARBITRATOR
ENGINE
Middleware
VM Sizes Benefit Estimate
Power Power Minimizing Estimate Allocation
Mig Cost Estimate PERF MODEL Migration Action
POWER
PERFOMANCE MANAGER
POWER MODEL
MIGRATION
MANAGER
MANAGER
MIG MODEL KNOWLEDGE BASE
VM Sizes VM PERFORMANCE
PMC
Migration Action
POWER DATA
HYPERVISOR PM C
HYPERVISOR PM C
HYPERVISOR PM C
MONITORING ENGINE
VIRTUALIZATION MANAGER
VM
VM
VM
SERVER FARM
Fig. 1. pM apper Application Placement Architecture
middleware. In pMapper, all the power management actions are communicated by three different managers, with an arbitrator ensuring consistency between the three actions. The soft-actions like VM re-sizing and idling are communicated by the Performance Manager, that has a global view of the application in terms of QoS met and performance SLA. Power Manager triggers power management at a hardware layer whereas a Migration Manager interfaces with the Virtualization Manager to trigger consolidation through VM live migration. The resource management flow of pMapper starts with the Monitoring engine, which collects the current performance and power characteristics of all the VMs and physical servers in the farm. Performance Manager looks at the current performance and recommends a set of target VM sizes based on the SLA goals. In case, the target VM sizes are different from the current VM sizes, it also presents an estimate of the benefit due to resizing. Similarly, Power Manager looks at the current power consumption and may suggest throttling (by DVFS or explicit CPU throttling). The central intelligence of pM apper lies in Arbitrator, which explores the configuration space for eligible VM sizes and placements and implements an algorithm to compute the best placement and VM sizes, based on the estimates received from Performance, Power and Migration managers. Performance Manager supports interfaces using which the Arbitrator can query for the estimated benefit of a given VM sizing and placement (for all the VMs). In order to cater for heterogeneous platforms, the Performance Manager consults a Knowledge Base to determine the performance of an application, if one of its VM is migrated from one platform to another. Similarly, Power Manager supports interfaces using which Arbitrator can get the best power-minimizing placement for a given set of VM sizes. Also, Power Manager uses a power model in the Knowledge Base to determine the placement, as well as estimate the power for a given placement. Migration Manager estimates the cost of moving from a given placement to a new placement and uses the Migration Model for making the estimate. Once the Arbitrator decides on a new configuration, Performance Manager, Power Manager, and Migration Manager execute the VM sizing, server throttling and live migration operations, respectively.
pMapper: Power and Migration Cost Aware Application Placement
247
We note that for standalone applications running on power-aware virtualized platforms such as [15], our framework can make use of the OS hints by passing them on to the Arbitrator. Hence, our framework and proposed algorithms (Section. 4) can also be used in other power management frameworks [15,23]. 2.2
Optimization Formulations
We now formulate the problem of placing N application on M virtualized servers that have power management capabilities. The power-aware application placement problem divides the time horizon in time windows. In each window, we compute the application placement that optimizes the performance-cost tradeoff, i.e., maximizes performance and minimizes cost. The cost metric may consist of management cost, power cost or the application cost incurred due to the migrations that are required to move to the desired placement. We next present various formulations of the application placement problem. Cost Performance Tradeoff. The generic formulation of the problem solves two sub-problems: (i) application sizing and (ii) application placement. Given a predicted workload for each application, we resize the virtual machine hosting the application and place the virtual machines on physical hosts in a manner such that the cost-performance tradeoff is optimized. In this paper, we focus on the power and migration costs only. Formally, given an old allocation Ao , a performance benefit function B(A), a power cost function P (A), and a migration cost function M ig for any allocation A, we need to find an allocation AI defined by the variables xi,j , where xi,j denotes the resource allocated to application Vi on server Sj , such that the net benefit (defined as the difference between performance benefit and costs) is maximized. maximize
N � M �
B(xi,j ) −
i=1 j=1
M �
P (AI ) − M ig(Ao , AI )
(1)
j=1
Cost Minimization with Performance Constraint. Data centers today are moving towards an SLA-based environment with fixed performance guarantees (e.g., response time of 100 ms with throughput of 100 transactions per second). Hence, in such a scenario, performance is not a metric to be maximized and can be replaced by constraints in the optimization framework. In practice, it amounts to taking away the VM sizing problem away from the Arbitrator. The VM sizes are now fixed by the Performance Manager based on the SLA and the Arbitrator only strives to minimize the overall cost of the allocation. Hence, the optimization problem can now be formulated as minimize
M � j=1
P (AI ) + M ig(Ao , AI )
(2)
248
A. Verma, P. Ahuja, and A. Neogi
Performance Benefit Maximization with Power Constraints. A third formulation for the application allocation problem is to maximize the net performance benefit given a fixed power budget for each server, where the net benefit is computed as the difference between the performance benefit and migration cost. N � M � B(xi,j ) − M ig(Ao , AI ) (3) maximize i=1 j=1
We next present the various model assumptions that pM apper needs to make to solve the application placement problem.
3
Model Assumptions and Experimental Reality
In this section, we study the various underlying model assumptions and the feasibility of constructing estimation models required by the three formulations of the application placement problem. Our testbed to experimentally validate the model assumptions consists of two different experimental setups. The first setup is an IBM HS-21 Bladecenter with mutiple blades. Each blade has 2 Xeon5148 dual-core Processors and runs two compute-intensive applications from an HPC suite, namely daxpy and f ma and a Linpack benchmark HP L [16] on VMWare ESX Hypervisor . Each blade server has an L2 cache of 4MB, FSB of 1.33 GHz, with each processor running at 2.33 GHz. The second setup consists of 9 IBM x3650 rack servers running VMWare ESX with L2 cache of 4MB. Each server has a quad-core Xeon5160 processor running at 2.99 GHz. This setup runs the Trade6 application as well as the two HPC applications daxpy and fma. The overall system power is measured through IBM Active Energy Manager APIs [13]. We now list the key model assumptions and our experimental findings on the veracity (or the lack of it) of the assumptions. We use these findings to investigate the practicality of the optimization formulations discussed earlier. 3.1
Performance Isolation in Virtualized Systems
Virtualization allows applications to share the same physical server by creating multiple virtual machines in a manner such that each application can assume ownership of the virtual machine. However, such sharing is possible only if one virtual machine is isolated from other virtual machines hosted on the same physical server. Hence, we first studied this fundamental underlying assumption by running a background load using f ma and a foreground load using daxpy. The applications run on two different VMs with fixed reservations. We varied the intensity of the background load and measured the performance (throughput) of the foreground daxpy application (Fig. 2(a)). One can observe that the daxpy application is isolated from the load variation in the background application. However, we conjectured that applications may only be isolated in terms of CPU and memory, while still competing for the shared cache. To validate this conjecture, we increased the memory footprint of
pMapper: Power and Migration Cost Aware Application Placement 300
600 Time taken on x3650(daxpy) Time taken on HS21(daxpy) Time taken on HS21(HPL)
Time taken on HS21 (daxpy) Time taken on x3650 (daxpy)
250
500
200
400
Time
Time
249
150
300
100
200
50
100
0
0 0
10
20
30 40 50 Background Utilization
60
70
(a)
80
0
20
40 60 Background Utilization
80
100
(b)
Fig. 2. Running Time of 30 Billion daxpy operations with change in background load on HS-21 and x3650 systems at (a) low memory footprint and (b) high memory footprint
both the foreground daxpy and background f ma. We observed that as the size of the arrays being operated exceeded the L2 cache size (4M B), the applications were no longer isolated (Fig. 2(b)). The throughput of the foreground application decreases with increase in background traffic as a result of the large number of cache misses, which are due to increased cache usage by the background application. However, as one increases the memory footprint of each application beyond the cache size, the applications are no longer able to use the cache even in isolation. Hence, we concluded that for a large range of application use (small and large working set sizes), virtualization is able to successfully isolate two VMs from each other. 3.2
Migration Cost Modeling
We have proposed the application placement problem as a continual optimization problem, where we dynamically migrate the live virtual machines from one physical server to another in order to optimize the allocation. The migration of virtual machines requires creation of a checkpoint on secondary storage and retrieval of the VM image on the target server. Applications can continue to run during the course of migration. However, the performance of applications is impacted in the transition because of cache misses (hardware caches are not migrated) and possible application quiesces. Thus, each migration is characterized by a migration duration and a migration cost. The Migration Manager in pM apper needs to estimate this migration cost for use by the Arbitrator. Hence, we next studied the feasibility of characterizing migration cost for an application and study the parameters that affect this cost. We observed (Fig. 3) that the impact of migration was independent of the background load and depends only on the VM characteristics. Hence, the cost of each live migration can be computed a priori. This cost is estimated by quantifying the decrease in throughput because of live migration and estimating the revenue loss because of the decreased performance (as given by SLA). Hence,
250
A. Verma, P. Ahuja, and A. Neogi
Background Load (CPU) Migration Duration Time (w/o Mig) Time (With Mig) 0 60 210s 259s 12 70 214s 255s 30 63 209s 261s Fig. 3. Impact of Migration on application throughput with different background traffic
we conclude that it is possible to estimate the cost of live migration of each application for use by pMapper. 3.3
Power Modeling
The power-aware application placement controller explores various candidate placements and needs to estimate the overall power drawn for each candidate placement while selecting a good placement. This estimation is especially required to solve the power-constraints and power-performance tradeoff formulations. We next study the feasibility of modeling the power for a server given a mix of applications running on it. Give a set of N applications and M servers, we can potentially mix a large variety of applications on each server. Further, any optimization algorithm may seek to change the ratio of various applications on a server. Hence, creating a model for all mixes of all applications on all the servers is practically infeasible. Thus, we may be able to estimate the power drawn by a server only if it is independent of the applications running on it. We next conducted experiments to validate this assumption by creating power models for various applications on the two testbeds. We found (Fig. 4(a)) that the power drawn by a server varies with the applications running on it. Hence, an algorithm that requires an exact power model
400
30 (fma,fma,hs21) (fma,daxpy,hs21) (daxpy,daxpy,hs21) (daxpy,fma,hs21) (daxpy,daxpy,x3650) (fma,fma,x3650)
350 25 300 20 Marginal Power
Power
250
200
15
150 10 100 daxpy on x3650 fma on x3650 Trade6 on x3650 daxpy on HS21 fma on HS21
50
5
0
0 0
20
40
60 Utilization
(a)
80
100
0
20
40 60 Background Utilization
80
100
(b)
Fig. 4. (a) Power drawn by various applications with change in server utilization. (b) Marginal Power consumed by HPC applications on various platforms with change in background load and background mix. (A, B, C) denotes incremental power drawn by A with background traffic of B on platform C.
pMapper: Power and Migration Cost Aware Application Placement
251
for each allocation may be infeasible in practice. Further, since migration takes a significant amount of time, any measurement-based strategy that tries to learn the power models for all used application mixes is also practically infeasible in a dynamic consolidation setting. We concluded that the power-capping and power-performance tradeoff frameworks, though interesting in theory, are not feasible in practice as they need one to compute the exact power consumed by an application. However, we note that an algorithm to solve the power minimization problem does not need actual power numbers. The problem that the power minimization framework solves is to minimize power, without really knowing what the exact power would be. Hence, an algorithm that can be listed out as a sequence of steps, where each step is a decision problem for some application to determine which of the candidate servers the application should be placed on, does not need estimates of power values. Instead, if the algorithm can figure out which server minimizes the incremental increase in total power due to the new application being placed, then it can place the application appropriately. One may, however, note that this approach restricts the algorithm choices to only those algorithms that take a local view of the problem, and hence can be locally optimal in the best case. Further, one still needs to solve the ordering problem, where for any given placement of N − 1 applications on M servers, we should be able to estimate the best server (in terms of power minimization) to place the N th application. We next investigate two properties such that even if any one of them holds, one can make this decision. Definition 1. Ordering Property: For any two applications V Mi and V Mi� and servers Sj and Sj � at loads ρj and ρj � respectively, if the server Sj is more power efficient than Sj � for V Mi , then Sj is more power-efficient than Sj � for all V Mi� as well. Hence, the slopes for any two servers satisfy a uniform ordering across all applications. Definition 2. Background Independence Property: An application and a server are said to satisfy that Background Independence Property if the incremental power drawn due to the application on the server depends only on the background load intensity and is independent of the traffic mix in the background. We next investigate if these properties can be made to hold in certain situations where we know about the class of applications we are placing. For example, if we restrict ourselves to consider only HPC applications or only J2EE applications in a cluster we can demonstrate that these properties hold. We ran two applications on the two testbeds for various mixes of background traffic picked from the HPC benchmarks. We observed the Ordering Property to hold for the two applications on the two testbeds. We noted (Fig. 4(b)) that the x3650 platform is more powerefficient (incrementally) for both the applications. This is true even when we changed the background traffic from daxpy to f ma on the HS21 Blades. We also observe that the incremental power drawn by daxpy for both the background traffic at any given background load value is almost same. Hence, one can assume the Background Independence Property to hold at a coarse granularity in most
252
A. Verma, P. Ahuja, and A. Neogi
scenarios. We next propose algorithms that use these properties to solve the power-minimization optimization problem.
4
Application Placement Algorithms
In this section, we describe the various placement algorithms designed for minimizing the overall cost, while meeting a fixed performance SLA. The algorithms assume that a performance manager provides them with a VM size for each application, that can meet its performance goals. We start with a brief description of the key ideas behind the algorithms. 4.1
Algorithm Idea
Our application placement algorithms that minimize the power and migration costs are based on three key observations 1. Estimating the power cost of a given configuration may not be possible because power drawn by a server depends on the exact application mix on a server. 2. Background Independence Property and Ordering Property allows one to pick a server for an application that will minimize the incremental power due to the new application. Hence, local searches are feasible. 3. The above properties may not hold always if servers are equally loaded. However, the properties will definitely hold if we compare an idle server with a loaded server. The first two observations dictate the design of algorithms to be based on local searches. One can view the application placement problem as a bin-packing problem with differently sized bins. The servers represent the bins and the virtual machines represent the balls. The power drawn by a server is represented as the cost of the bin and the power-minimizing allocation is a packing that minimizes the cost of the packed bins. Since power drawn by a server depends on the actual mix of applications, the cost of packing a bin varies depending on the balls being packed in the bin. Bin packing has many local search algorithms like First-Fit Decreasing(FFD) [25], Best-Fit and Worst-fit. We took a close look at FFD, where balls are ordered by size (largest first). The balls are then packed in the first bin that can accommodate them. We observed that if servers are ordered based on power efficiency (static power per unit capacity), then the FFD algorithm can employ the Ordering property to minimize power. This is because FFD unbalances load, and as per our third observation, the Ordering property always holds if we are comparing an idle server with a loaded server. Further, by placing servers based on their power efficiency, we ensure that more power efficient servers are the ones that are utilized first. Finally, FFD has good theoretical bounds and is also known to perform well in practice [25]. Hence, we focus on adapting First Fit to work for different sized bins with ball-dependent cost functions.
pMapper: Power and Migration Cost Aware Application Placement
4.2
253
Algorithm Details
We first present an algorithm min Power Parity (mP P ) in Fig. 5 to place the VMs on the given set of servers in a manner such that the overall power consumed by all the servers is minimized. The algorithm takes as input the VM sizes for the current time window that can meet the performance constraints, a previous placement and the power model for all the available servers. It then tries to place the VMs on the servers in a manner that minimizes the total power consumed. algorithm mP P
Input : ∀iV Mi , Allocold Output = Allocnew ∀Serverj Allocj = φ, U sedj = 0 Sort VMs by size in decreasing order for i = 1 to N ∀Serverj compute Slope(U sedj ) Pick the Servermin with the least Slope Add V Mi to Allocmin , U sedmin + = Size(V Mi ) End For Allocnew = F F D(Used) returnAllocnew end mPP Fig. 5. Power-minimizing Placement Algorithm
mP P works in two phases: In the first phase, we determine a target utilization for each server based on the power model for the server. The target utilization is computed in a greedy manner, where we start with a utilization of 0 for each server. We then pick the server with the least power increase per unit increase in capacity. We continue the process till we have allocated capacity to fit all the VMs. Since we may not be able to estimate the server with the least slope for all possible background traffic mixes, we pick an arbitrary traffic mix to model the power for each application and use this model in the selection process. We will later show that modeling based on an arbitrary background traffic mix also leads to a good solution. In the second phase, we call the bin-packing algorithm F F D based on First Fit Decreasing to place the VMs on the servers, while trying to meet the target utilization on each server. The bins in our version have unequal capacity, where the capacity and order of each bin is defined in the first phase whereas standard FFD that works with randomly ordered equal-sized bins. Theorem 1. If the Ordering Property or the Background Independence Property hold for a given set of servers and applications, then the allocation values obtained by mP P in its first phase are locally optimal. Proof. Let there be any two servers Sj and Sk such that we can shift some load between the two. For simplicity, assume that the load shift requires us to move
254
A. Verma, P. Ahuja, and A. Neogi
algorithm iFFD Input : Alloco , Used Output = Allocn Donors = φ, Receivers = φ F or all servers Sj P revj =sum of VMs in Sj byAlloco If (P revj > Usedj ) Add Sj to Donors Migj = P revj − Usedj Else Add Sj to Receivers End − F or F or all Sj in Donors Pick the smallest VMs that add upto Migj and add them to MigList End − F or Sort MigList based on size F or all V Mi in MigList Place V Mi on the first Donorj that can pack it within Usedj End − F or Return Allocn
(a)
algorithm pM aP Input : Alloco , V Mi Output : Migs Allocn = mP P H(Alloco , V Mi ) MList = getMigList(Alloco , Allocn ) ∀Serverj with no VMs placed in Allocn V Gj =VMs placed on Serverj in Alloco Add V Gj toMList ∀migi ∈ MList Costi = getMigrationCost(migi ), Benef iti = getBenef it(migi ) Sort MList by Benef iti /costi (decreasing) migbest = most profitable entry in MList while(prof itbest > costbest )AND(MList�= Φ) Migs = Migs ∪ migbest Delete migbest from MList Recompute Cost and Benefit for MList End While return Migs end pMaP Algorithm
(b)
Fig. 6. (a)History Aware Packing Algorithm, (b) Migration Cost-aware Locally Optimal Placement Algorithm
the VM V Mi from Sj (at load ρj ) to Sk (at load ρk ). Also, since we had selected Sj over Sk for the additional load, there exists some VM V Mi� for which the slope of Sj at load ρj is less than the slope for the server Sk at load ρk . However, by the Ordering assumption, such a VM V Mi� can not exist. This leads to a contradiction and proves the required result. The proof for the Background Independence Property is straightforward. If this property holds, then the incremental load due to application V Mi is independent of the workload mix, and as a result, we can always compute the exact increase in power on all candidate servers for V Mi and pick the best server. Hence, the shares allocated to the servers are locally optimal. This completes the proof. One may also observe that if all the power models are concave, then the utilization allocation obtained is globally optimal as well. However, we did not observe this property to hold in our experiments and concluded that mP P can provably lead to locally optimal allocations only. The mP P algorithm is designed to minimize power. However, it is oblivious of the last configuration and hence may entail large-scale migrations. This may lead to a high overall (power + migration) cost. Hence, we next propose a variant of F F D called incremental FFD (iF F D) for packing the applications on physical servers, given a fixed target utilization for each server in Fig. 6(a). iF F D first computes the list of servers that require higher utilization in the new allocation, and labels them as receivers. For each donor (servers with a target utilization lower than the current utilization), it selects the smallest sized applications to migrate and adds them to a VM migration list. It then runs F F D
pMapper: Power and Migration Cost Aware Application Placement
255
with the spare capacity (target capacity - current capacity) on the receivers as the bin size and the VM migration list as the balls. iF F D has the nice property that it starts with an initial allocation, and then incrementally finds a set of migrations that will help it reach the target utilization for each server. Hence, the packing algorithm migrates VMs only to the extent required to reach the target utilization for each server. We use iF F D to design a power-minimizing placement algorithm that includes history, and is aptly named as min Power Placement algorithm with History mP P H. It works identically as mP P in the first phase. For the second phase, it invokes iF F D instead of F F D, thus selecting a placement that takes the earlier placement as a starting point. mP P H algorithm tries to minimize migrations by migrating as few VMs as possible, while moving to the new optimal target utilization for the servers. However, even though it is migration aware, it does not compromise on the power minimization aspect of the algorithm. Hence, if the target utilization for servers change significantly in a time-window, mP P H still resorts to large scale migrations to minimize power cost. We next propose an algorithm P M aP that takes a balanced view of both power and migration cost, and aims to find an allocation that minimizes the sum of the total (power + migration) cost. pM aP (Fig. 6(b)) continually finds a new placement for VMs in a fashion that minimizes power, while taking the migration cost into account. The algorithm is based on the fundamental observation that all the migrations that take us from an old power-minimizing placement to a new power-minimizing placement may not be optimizing the power-migration cost tradeoff. Hence, the algorithm first invokes any power-minimizing placement algorithm (mP P H is our choice) and gets a new power-minimizing placement. It then computes the difference between the two placements (the set of migrations that will change the old placement to the new placement) and determines a subset to select. The selection process is based on sorting all the migrations based on their incremental decrease in power per unit migration cost. We note that a set of multiple migrations may be atomic and have to be separately considered en masse as well, while estimating their incremental decrease in power per unit migration cost. We then select the most profitable migration if the power savings due to migration is higher than the migration cost. We repeat the above procedure till no migrations exist that optimize the power-migration cost tradeoff. We prove the following Local Optimality property for P M aP along the same lines as Theorem 1. Lemma 1. If pM aP at any given time has a placement P , then the next migration selected by P achieves the highest power-migration cost tradeoff. Hence, every iteration that selects the next migration in pM aP is locally optimal.
5
pMapper Implementation and Experimental Validation
We now present our implementation of pM apper and an experimental study to demonstrate its effectiveness.
256
5.1
A. Verma, P. Ahuja, and A. Neogi
Implementation
We have implemented pM apper to solve the cost minimization problem described in Eqn. 2. In this formulation, the Arbitrator is driven by performance goals and only arbitrates between the Power Manager and Migration Manager to find a placement that optimizes the power-migration cost tradeoff. The Power Manager implements the power-minimization algorithms mP P H and mP P , whereas the Arbitrator implements the pM aP algorithm to optimize the power migration tradeoff. We use IBM Active Energy Manager [13] for monitoring power usage and EWLM [14] as the performance manager. In order to use the Active Energy Manager for monitoring, we have writen a monitoring agent that is co-located with the IBM Director Server and uses network sockets to communicate with the pM apper framework. EWLM uses a metric called Performance Index (PI) to indicate if an application is meeting its required SLA. A PI value of 1 is achieved when the response time of the application equals the target response time as specified in its SLA. Whenever, an application fails to meet its PI or outperforms its SLA, EWLM automatically resizes the VM so that the PI value for the application reaches 1. We have implemented our Arbitrator to work with a workload manager independent datastructure that captures a configuration in terms of VM sizes and their placements. Hence, the Arbitrator uses an adapter that allow it to understand the performance characteristics and partition sizes as reported by EWLM. We have implemented pM apper for VMWare ESX-based platforms and hence we use VMWare Virtual Center as the Virtualization Manager. We use the VI API provided by VMWare ESX 3.0 to communicate with the Virtualization Manager and execute migration actions. In order to execute throttling actions, we use the IBM Active Energy Manager interface that directly communicates with the BMC via IPMI commands. We next describe our experimental setup for the performance study. 5.2
Experimental Setup
Our experimental testbed is driven by server utilization traces obtained from the server farm of a large data center. We initially wanted to conduct our experiments on the complete implementation of pM apper. However, we soon realized that this would take an inordinately long time (running the experiments for Fig. 7(b) only would take 4 months as it required 60 different runs). Initially, we looked at ways to speed up the experiments but we could not do so because the data refresh rate of Active Energy Manager was 5 minutes. We realized that our implementation was not focussing on performance (which was out-sourced to EWLM) and we only needed to study the power and migration cost minimization ability of pM apper. Hence, we simulated the performance infrastructure by replacing the Performance Manager with the application trace data. Further, once the Arbitrator came up with a final placement, we fed the output to a Simulator that estimated the overall cost of the placement. Since we had characterized the applications on the platform earlier, we could design a table-driven simulator that was accurate
pMapper: Power and Migration Cost Aware Application Placement
257
with 99% confidence. The Simulator simulates the placement of these servers on a HS-21 Bladecenter according to the configuration given by the Arbitrator. For comparison, we used the following algorithms – Load Balanced: This placement strategy places the VM in a manner such that the load is balanced across all the blades in the Bladecenter. – Static: This algorithm takes long term history into account to find the placement that minimizes the power. The algorithm first estimates the minimum number of servers required to serve all the requests without violating blade server capacities. It then places the VMs (only once) on the servers to minimize power – mPP: The minPowerPlacement Algorithm dynamically determines the placement that minimizes the power for that time window and is based on FFD. – mPPH: The minPowerPlacement with History Algorithm determines the power-minimizing placement that takes into account the previous placement. – PMaP: The PMaP Algorithm optimizes the tradeoff between power cost and migration cost, while computing the new placement for the window. In our experiments, the Performance Simulator maps each server utilization trace to a Virtual Machine (VM) on the HS-21 with the VM size being set to the CPU utilization on the server. The trace is divided into time windows, and in each time window, the Arbitrator determined a new placement for each of the placement strategies based on the utilization specified by the Performance Manager in the time window. We feed the placements to the Simulator, which estimates the cost of each placement and logs it. We studied the various methodologies with respect to the power consumed, the migration cost incurred, and the sum of power cost and migration cost. We then conducted a comparative study of the algorithms with change in server utilization. We also increased the number of blades in the Bladecenter to investigate the ability of the algorithms to scale and deal with fragmentation. We used a metric to quantify the relative impact of migration cost with power cost and termed it M P Ratio. The migration cost is determined by estimating the impact of migration on application throughput and consequent revenue loss, computed as per the SLA. This cost is compared with the power cost using the power drawn and the price/watt paid by the enterprise. We pick a reasonable value for this ratio in our baseline setting based on typical SLAs and then vary this ratio to study its impact on the performance of various algorithms. We also plugged in some other power models to investigate if the algorithms are dependant on specific power models. Further, by mixing different kinds of physical servers (with different power models), we investigate the ability of the algorithms to handle heterogeneity. We finally studied the practicality of the assumptions made. 5.3
Results
We first study the behaviour of various algorithms as the traces are played with time (Fig. 7(a)). The aggregate utilization of the VMs varies during the run and the dynamic algorithms continually try to adapt to the changed workload. We
258
A. Verma, P. Ahuja, and A. Neogi
1200
1 Average Utilization Static Power mPP Power mPPH Power LB Power
1100
800000
0.9 700000 0.8
1000 600000
800
0.5 0.4
700
0.3
Energy(Kilojoules)
Power(Watts)
0.6
Average Utilization
0.7 900
500000
400000
300000
600 0.2 200000
500
Static Energy mPP Energy mPPH Energy LB Energy
0.1
400 0
50
100
150 Time
(a)
200
250
0 300
100000 0.1
0.2
0.3
0.4
0.5 0.6 Utilization
0.7
0.8
0.9
1
(b)
Fig. 7. Power consumed by various placements strategies with (a) time and (b) increasing overall utilization
observe that the dynamic algorithms mP P and mP P H are able to save about 200W of power (25%) from the Load Balanced and Static Placements. However, as the utilization exceeds 0.75, the savings drop significantly. This is because, at high utilization, there is not much scope for consolidation. However, even at high loads, our algorithms are able to save some power by taking the decreasing slope of the power curves into account. We observed that our algorithms try to run most servers at close to their full capacity because the power-curve saturates at high capacity. Hence, instead of balancing the load across all servers, it makes sense to unbalance load even when all the servers are switched on. We also observe that the proposed algorithms show very strong correlation with the average utilization. This establishes their ability to continually adapt to workload variations and save power accordingly. We next investigate the impact on power at different average utilization values. Towards this purpose, we compressed (or decompressed) all the traces so that the average utilization of the servers could be varied. The trace was compressed to achieve a higher utilization than the baseline, and decompressed to achieve lower utilizations. We observed that the power savings obtained by the proposed power-minimizing algorithms is significant at low utilization values. This is because our algorithms are able to consolidate the VMs on a few servers only, and save a significant amount of power due to the high static power cost. Our study (Fig. 7(a)) reaffirms that most savings come from consolidation and not by unbalancing load. This is evident because the savings of proposed algorithms increase significantly when the average utilization goes below 0.75 and 0.5. These are the utilization values at which one can switch off an additional server. Note that the discontinuities are not so noticeable in Fig. 7(b). However, since at an average utilization of 0.75, there are many time instances where the utilization goes beyond 0.75 and no server can be switched off, the difference between overall energy consumption between average utilization of 0.7 and 0.75 is not as large as one would expect from Fig. 7(a). We have only investigated the performance of algorithms w.r.t power consumed by their corresponding placements. We now take into account the
pMapper: Power and Migration Cost Aware Application Placement 500
1200
1000
1800
400 1400
Mig Cost
600
200
Total Cost
800
700
600
500
300 Total Cost
800 Static Total Cost mPP Total Cost mPPH Total Cost pMaP Total Cost LB Total Cost mPP MigCost mPPH MigCost pMaP MigCost LB MigCost
1600
1200 400 1000
Mig Cost
Static Total Cost mPP Total Cost mPPH Total Cost pMaP Total Cost LB Total Cost mPP MigCost mPPH MigCost pMaP MigCost LB MigCost
1400
259
300 800
400
200 100 600
200
0
0 0.1
0.2
0.3
0.4
0.5 0.6 Utilization
(a)
0.7
0.8
0.9
1
100
400
0 0
0.2
0.4
0.6
0.8 1 1.2 Migration Cost Ratio
1.4
1.6
1.8
2
(b)
Fig. 8. Migration Cost and Overall Cost with (a) increasing overall utilization (b) change in MP (Migration to Power Cost) Ratio
migration cost and compare the power-minimizing algorithms with the migration cost aware pM aP algorithm as well (Fig. 8(a)). We observe that even though the power drawn by pM aP (difference of total cost and migration cost) is higher than mP P or mP P H, the total cost of pM aP is the least amongst all competing algorithms. This establishes the importance of taking both the migration and power cost into account, while coming up with a new placement. We also observe that mP P pays a very high migration cost at higher utilization, and underperforms even the LB(Load − balanced) and Static placements at very high loads. On the other hand, mP P H incurs very low migration cost (of the same order as load-balanced) and as a result, has a total cost very close to the best performing algorithm pM aP . This is a direct result of the fact that mP P H takes the previous placement into account while computing a new placement, and tries to minimize the difference between the two placements. Hence, even though mP P H does not compromise on saving power as opposed to pM aP , which can prefer a placement with high power and low migration cost, the migration costs incurred by mP P H are not significant. This establishes mP P H as a good alternative to pM aP , because of its relative simplicity. The M P ratio (migration to power cost ratio) varies from one enterprise to another and depends on factors such as energy cost and SLA revenue models. We next investigate the various algorithms at different MP ratio. We observed (Fig. 8(b))that MP ratio directly affects the overall performance of mP P . Hence, mP P is the best performing algorithm (approaching mP P H and pM aP ) at low migration costs and underperforms even the power-unaware algorithms at very high migration cost. This underscores the importance of taking migration cost into account, along with the power cost for dynamic placement. On the other hand, pM aP takes the increased migration cost factor into account by cutting down migrations. Hence, a high M P ratio does not affect its performance. In our next set of experiments, we investigated the scalability of the algorithms along with their ability to deal with fragmentation (large VM sizes). Hence, we increased the number of servers from 4 to 16. We observed that pM aP and
260
A. Verma, P. Ahuja, and A. Neogi
3000
0.4
1000
Static Total Cost mPP Total Cost mPPH Total Cost pMaP Total Cost mPP Penalty mPPH Penalty pMap Penalty
2500
0.4 pMaP Total Cost pMaP+ Total Cost Static Penalty mPP Penalty mPPH Penalty pMaP Penalty pMaP+ Penalty LB Penalty
900
800
700 0.2
Penalty
0.2
Penalty
1500
Total Cost
Total Cost
2000
600
1000 500
500
400
0
300 4
6
8
10 Number of Servers
(a)
12
14
16
0 0.1
0.2
0.3
0.4
0.5
0.6
0.7
0.8
0.9
1
Utilization
(b)
Fig. 9. (a) Overall Cost and Penalty with increase in servers (b) Power and Penalty with increase in fragmentation for penalty aware and unaware algorithms
mP P H are the top two performing algorithms even with increased number of servers. However, we observed (Fig. 9(a)) that while aiming to unbalance load for minimizing power, pM aP was leading to a large number of requests being dropped (or delayed). We call the drop in requests as Penalty of a placement. A reason for this penalty is the huge variance in workload. Hence, at an average load of 0.7 approximately, there are many instances when the transient load goes beyond 1.0 and, as a result, many requests need to be dropped (irrespective of the placement methodology). However, since pM aP is unaware of penalties, it drops more requests than others, while striving to minimize cost. This makes pM aP undesirable for use at high load intensities. We next engineered pM aP to take penalty into account, while exploring the search space between the old placement and the new placement. The modified algorithm pM aP +, during its exploration, picks only those intermediates whose penalty are below a bound. We fixed the bound to be 0.1 in our experiments. We observe (Fig. 9(b)) that the penalty aware algorithm pM aP + now incurs the least penalty amongst mP P , mP P H, pM aP and static. The penalty seen by the Load Balanced algorithm is the baseline penalty incurred solely because of traffic variations and pM aP + now has a penalty approaching that of Load Balanced. This engineering allows pM aP + to again be the algorithm of choice under all scenarios. We also observe that the penalties of the Static placement also varies a lot, approaching 20% in certain cases. This is again, a result of the load-shifts that happen with time, re-affirming the importance of a dynamic placement strategy. In this set of experiments, we simulate heterogeneity with various power models. We simulate another server with a power model where the static power or the dynamic power or both may be reduced to half. We increase the number of such servers from 0 to 2 to increase the complexity in Static Power or Dynamic Power (Fig. 10(a)). We observed that increased complexity (due to heterogeneity) leads to higher power savings relative to the Static Placement, which is the best power-unaware placement method. Further, the power savings are almost
pMapper: Power and Migration Cost Aware Application Placement
261
3 Load Factor = 15% Load Factor = 35% Load Factor = 45% Load Factor = 70% Load Factor = 90% Load Factor = 93%
30 2.5
2 Penalty (Watts)
Power Savings (%)
25
20
1.5
1
15
0.5
10 2
1.5
1 0.5 Dynamic Power Complexity
0
(a)
2
1.5
1
0.5
0
Static Power Complexity
0 0
5
10
15 20 25 VM Number (In order of placement)
30
35
40
(b)
Fig. 10. (a) Power Savings of mP P and mP P H in comparison to Static Placement with increasing heterogeneity. (b) Penalty incurred because of the Ordering Assumption.
additive with increase in static or dynamic complexity. Hence, the proposed algorithms are capable of working even better in heterogeneous clusters, thus establishing their efficacy in a wide variety of settings. Our algorithms are based on the assumption that for each application being placed, we can characterize the incremental power drawn by it at various workloads on all the server platforms. We can then use this incremental power table to decide which server to place the application on, during dynamic application placement. We now investigate the practicality of this assumption. In order to study this, we looked at a a random sample of 100 points from this selection trace log and measured the incremental power drawn due to our selection and the incremental power drawn by selecting any other server. Fig. 10(b) shows the accuracy of our estimate in terms of the penalty accrued due to wrong selection for each placed application. If we made the right selection, we get a penalty of 0 whereas if there was another server with less incremental power, we incur a penalty equal to the difference. We observe that the Ordering property holds for most of the applications with a few errors resulting in an error of 1 watts or less. As compared to the total power consumption of about 750W , this error is insignificant. Further, we observe that the property does not hold only for the last few applications being placed. Hence, any errors made do not get cascaded to other applications, as most of them were already placed. This is a direct result of the fact that we chose to adapt F F D, which leads to unbalanced load. Hence, for most of the comparisons that used the Ordering property, we compared an idle server with a loaded server, and very clearly the loaded server was selected because of the huge static power cost. Hence, our local search based on the Ordering property worked close to optimal. Further, a closer look at the plots reveal that we pay the penalty only when the overall load approaches 50% or 75%. This is because in these cases all the servers that were loaded were close
262
A. Verma, P. Ahuja, and A. Neogi
to their capacity. Hence, we had to select between servers that where all loaded. In such a scenario, the Ordering property did not seem to hold in a few instances (about 1 in 5). However, this scenario encompasses only a very small portion of the overall problem space. Hence, we conclude that pM apper is able to make use of the Ordering property to quickly come up with placements that are very close to optimal (less than 0.2% penalty).
6
Related Work and Conclusion
Energy management in server clusters has been a popular area of research since the beginning of this decade [1,12]. Chen et al. [6] combine server level CPU scaling techniques with the application provisioning problem in the same formulation. However, in contrast to pMapper, they do not work in a virtualized setting with migration costs and only deal with homogeneous clusters for placement. Muse pose a resource allocation problem in [4], where services are allocated to enough number of resource containers on physical servers based on an economic model. Since energy cost is part of the model and the load is dynamic, resources are allocated dynamically in a manner that is aware of the energy costs. However, the model does not explicitly consider migration costs of containers or deal with the complexity of application specific power models in a heterogeneous server cluster. Bobroff et al. [2] describe a runtime application placement and migration algorithm in a virtualized environment. The focus is mainly on dynamic consolidation utilizing the variability in workload but they do not perform power-aware placements on heterogeneous servers. Most of the cluster energy management literature addresses the problem of distributing requests in a web server cluster in such a way that the performance goals are met and the energy consumption is minimized [4,5,10,19,21]. There are a number of papers that describe server or cluster level energy management using independent [8,18] or cooperative DVS techniques [7,11]. There are other efforts in reducing peak power requirements at server and rack level by doing dynamic budget allocation among sub-systems [9] or blades [20]. In this work, we have presented an application placement controller pM apper that minimizes power and migration costs, while meeting the performance guarantees. pMapper differs from all existing literature because it addresses the problem of power and migration cost aware application placement in heterogeneous server clusters that support virtualization with live VM migration. It investigates the viability of using CPU utilization based application specific power models to develop placement algorithms and validates the assumptions through testbed experimentation. Through a carefully designed experimental methodology on two server platforms, we concluded that only a power minimization framework is feasible practically. We use insights from our study to pin down the conditions under which this problem can be solved. We proposed three dynamic placement algorithms to minimize power and migration cost and experimentally demonstrated the various scenarios in which each algorithm is effective. We established
pMapper: Power and Migration Cost Aware Application Placement
263
the superiority of our most refined algorithm pM aP + under most settings over other power unaware algorithms as well as power aware algorithms both theoretically and experimentally.
References 1. Bianchini, R., Rajamoni, R.: Power and energy management for server systems. IEEE Computer, 68–76 (November 2004) 2. Bobroff, N., Kochut, A., Beaty, K.: Dynamic placement of virtual machines for managing sla violations. In: IEEE IM (2007) 3. Bohrer, P., et al.: The case for power management in web servers. In: Power Aware Computing (2002) 4. Chase, J., Anderson, D., Thakar, P., Vahdat, A., Doyle, R.: Managing energy and server resources in hosting centers. In: Proc. ACM SOSP (2001) 5. Chase, J., Doyle, R.: Balance of power: Energy management for server clusters. In: HotOS (2002) 6. Chen, Y., Das, A., Qin, W., Sivasubramaniam, A., Wang, Q., Gautam, N.: Managing server energy and operational costs in hosting centers. In: Sigmetrics (2005) 7. Elnozahy, E., Kistler, M., Rajamony, R.: Energy- efficient server clusters. In: Proceedings of the Workshop on Power-Aware Computing Systems (2002) 8. Elnozahy, M., Kistler, M., Rajamony, R.: Energy conservation policies for web servers. In: Proc. of USITS (2003) 9. Felter, W., Rajamani, K., Keller, T., Rusu, C.: A performance-conserving approach for reducing peak power consumption in server systems. In: ICS (2005) 10. Heath, T., Diniz, B., Carrera, E., Meira Jr., W., Bianchini, R.: Energy conservation in heterogeneous server clusters. In: Proc. of ACM PPoPP (2005) 11. Horvath, T.: Dynamic voltage scaling in multitier web servers with end-to-end delay control. IEEE Trans. Comput. 56(4) (2007) 12. Lefurgy, C., Rajamani, K., Rawson, F., Felter, W., Kistler, M., Keller, T.W.: Energy management for commercial servers. IEEE Computer 36(12), 39–48 (2003) 13. IBM Active Energy Manager, http://www-03.ibm.com/systems/management/director/extensions/ actengmrg.html 14. IBM Enterprise WorkLoad Manager, http://www.ibm.com/developerworks/autonomic/ewlm/ 15. Nathuji, R., Schwan, K.: Virtualpower: coordinated power management in virtualized enterprise systems. In: ACM SOSP (2007) 16. HPL-A Portable Implementation of the High Performance Linpack Benchmark for Distributed Memory Computers, http://www.netlib.org/benchmark/hpl/ 17. Control power and cooling for data center efficiency HP thermal logic technology. An hp bladesystem innovation primer (June 2006) 18. Rajamani, K., Hanson, H., Rubio, J., Ghiasi, S., Rawson, F.: Application-aware power management. In: IISWC, pp. 39–48 (2006) 19. Rajamani, K., Lefurgy, C.: On evaluating request-distribution schemes for saving energy in server clusters. In: ISPASS (2003) 20. Ranganathan, P., Leech, P., Irwin, D., Chase, J.: Ensemble-level power management for dense blade servers. In: ISCA (2006)
264
A. Verma, P. Ahuja, and A. Neogi
21. Rusu, C., Ferreira, A., Scordino, C., Watson, A.: Energy-efficient real-time heterogeneous server clusters. In: Proc. of RTAS (2006) 22. VMWare Distributed Resource Scheduler, http://www.vmware.com/products/vi/vc/drs.html 23. Stoess, J., Lang, C., Bellosa, F.: Energy management for hypervisor-based virtual machines. In: Proc. Usenix Annual Technical Conference (2007) 24. Urgaonkar, B., Pacifici, G., Shenoy, P., Spreitzer, M., Tantawi, A.: An analytical model for multi-tier internet services and its applications. In: Sigmetrics (2005) 25. Yue, M.: A simple proof of the inequality ffd(l) ≤ (11/9)opt(l) + 1, for all l, for the ffd bin-packing algorithm. Acta Mathematicae Applicatae Sinica (1991)