Scandinavian Journal of Forest Research, 2006; 21: 239 248
ORIGINAL ARTICLE
Poisson Voronoı¨ tiling for finding clusters in spatial point patterns STEEN MAGNUSSEN1, DENIS ALLARD2 & MICHAEL A. WULDER1 1
Natural Resources Canada, Canadian Forest Service, Pacific Forestry Center, Victoria, British Columbia, Canada, and, Institut National de la Recherche Agronomique, Unite´ de Biome´trie, Domaine Saint-Paul, Avignon, France
2
Abstract In forest stand mapping a delineation of spatial compact clusters of trees with similar attributes can improve inventory accuracy and growth and yield predictions. To this end a Poisson Voronoı¨ tiling (PVT) for identifying and delineating clusters (features) in spatial point patterns is proposed. PVT operates on the assumption that the point density in clusters is higher than that outside the clusters. A spatial domain of an observed point pattern is tessellated repeatedly into k (random) Poisson Voronoı¨ cells. An average EM-based likelihood of feature based on observed cell point densities is computed for each point and location of interest. Points and locations of interest are then classified by maximizing a classification likelihood. PVT avoids the need to specify the number of clusters. In a direct comparison with a non-parametric maximum profile likelihood procedure, and a smoothed version of the same, PVT performed well on two artificial point patterns with known feature domain and points, and on two spatial point patterns of first returns from a forest lidar survey on Vancouver Island, British Columbia, Canada.
Keywords: Bayes’ information criterion, EM classification, lidar, maximum profile log-likelihood.
Introduction Spatially specific information on the locations of tree and tree-crowns is now routinely extracted from high spatial resolution images (or pseudo-images) of forest canopies (St-Onge & Cavayas, 1997; Lefsky & Spies, 2001; Gougeon & Leckie, 2003; Popescu et al., 2003; Lovell et al., 2003; Næsset, 2004; Maltamo et al., 2004; Yu et al., 2004). Information about the location of (presumed) trees sharing a set of common attributes is important for forest management. Clusters of trees deemed similar in some aspect and occupying a compact area of a minimum size are routinely identified on forest cover-type maps and then treated as a unit in terms of management regimen and silviculture. The identification and spatial delineation of clusters of similar trees before, during or after a forest stand inventory improves the precision of stand-level growth and yield predictions and stand-level inventories. Traditionally, the clusters have been identified and delineated through interpretation of medium-resolution aerial photography (Holmgren et al., 1997).
When the spatial location of similar trees is known an opportunity for a purely numerical and statistical approach to identify and delineate clusters is available. The observed point pattern is regarded as a mixture of feature and clutter (noise) points. A cluster analysis attempts to separate the two classes of points and delineate spatially compact (connected) clusters of feature points. There is a plethora of methods to choose from. Excellent reviews are found in, for example, Ripley (1985), Diggle (1983), Upton and Fingleton (1985), Lawson and Denison (2002) and Cho (2004). Most approaches depend strongly on hard-to-verify assumptions about the spatial distribution of point locations or on pivotal parameter settings regarding the partitioning of variance within and among clusters. Few can handle the complexities of finding and delineating more than one cluster of similar points within a spatial domain. Allard and Fraley (1997) proposed a non-parametric maximum profile likelihood estimation (NMPL) of clusters based on the classification of
Correspondence: S. Magnussen, Natural Resources Canada, Canadian Forest Service, Pacific Forestry Center, Victoria BC V8Z 1M5, Canada. E-mail:
[email protected]
(Received 11 July 2005; accepted 2 March 2006) ISSN 0282-7581 print/ISSN 1651-1891 online # 2006 Taylor & Francis DOI: 10.1080/02827580600688178
240
S. Magnussen et al.
connected Voronoı¨ cells (Møller, 1994). They also introduced a variant in which cluster outlines were smoothed (SNMPL). Both NMPL and SNMPL appear promising for applications in forestry where one can expect many irregularly shaped and sized clusters. Parametric (Gaussian) approaches (Pen˜a & Prieto, 2002; Fraley & Raftery, 2002) are less flexible, and the criteria used for cluster splitting and merging are mostly subjective or require extensive subject knowledge. NMPL (SNMPL) requires a specification of the number of clusters to extract. This is a common requirement in clustering procedures (Hartigan, 1975). A visual inspection of a point pattern would often suggest a reasonable number of clusters, yet a formal and consistent statistical test for the number of clusters in a point process remains elusive (Hartigan, 1975; Godtliebsen & Chu, 1995; Allard & Fraley, 1997). The present authors’ experience with NMPL and SNMPL (Magnussen & Wulder, 2004) suggests a declining performance as the numbers of specified clusters and points increase. As an alternative to NMPL (SNMPL) this study proposes a new method based on repeated Poisson Voronoı¨ tiling (PVT) of a spatial domain and the computation of an average likelihood of feature for each point and location of interest. Clusters are extracted by maximizing a classification likelihood. PVT is compared to multicluster extensions of NMPL and SNMPL in two examples with known feature and clutter points and in two forestry examples with first-return lidar locations representing trees in a given height class (Magnussen & Wulder, 2004). Materials and methods This section begins with a general description of the estimation problem, then it details the PVT, the NMPL and the SNMPL methods and finally the data used for case studies. The presentation is limited to what is needed for a general understanding, with some technical details left out for the sake of brevity. Appropriate source referencing is provided, but the technically interested reader is also encouraged to consult the works of Allard and Fraley (1997) or to contact the first author for additional information. Feature and clutter points Consider a bounded domain K with area jK j in R2 on which a random sample of points Z /{zi }, i / 1,. . .,n is observed, assumed to arise from a mixture of two uniform point processes: feature points (UA ) with support A ƒ/K with probability p, and clutter
points (UK ) with support K and complementary probability 1 p. Feature points are restricted to a domain A (A ⁄/K ) composed of one or more nonoverlapping compact subdomains (clusters). The point density in A is the sum of the feature and clutter point densities. The feature domain will thus appear as one or more clusters of elevated point density. A cluster is considered as a compact spatial subdomain with a point density significantly higher than outside the cluster (Fraley & Raftery, 2002). The interest here is in the spatial delineation of A , which can be accomplished by first classifying points as feature or clutter (Hartigan, 1975) and then identifying the area associated with feature classified points. Specifically, if one assumes uniform random point processes for both feature and clutter processes, an estimate of A can be obtained by maximizing the following non-parametric profile likelihood with respect to A (Allard & Fraley, 1997): lPL (A; Z) with
pˆ
1 n (#(A)
n
#(A) jAj jK j n
#(A)
n #(A) jK j jAj
jAj)(jK j jAj)
n
#(A)
1
n
1
(1)
where #(A ) is the number of points inside A and jA j is its area. In the absence of auxiliary information on what constitutes an area associated with a point the default is to consider all locations in K closer to the point than to any other point in K as the natural area associated with a point (Allard & Fraley, 1997). With this definition the area associated with zi is the area (ai ) contained in the Voronoı¨ cell (VC) of zi (Okabe et al., 2000). The set Z defines a unique Voronoı¨ tessellation of K into n convex VCs. VCs for points inside A will be connected (sharing a polygon edge). VCs in the feature domain are, on average, smaller than those outside A . The inverse to the area of a VC is an unbiased estimate of the local point density (Fraley & Raftery, 2002). Poisson Voronoı¨ tiling for estimating A In the proposed PVT, the clusters containing the feature points are estimated via an iterative two-step process: (1) a random tessellation of K into M disjoints regions; and (2) a classification of each random region and all points therein to either feature or clutter. After a large number of random partitions (J ) and classifications, the likelihood (l) that an observed point is a feature point and the likelihood that a location in K is part of the feature domain can be estimated. A final estimate of p and A is obtained by a joint optimization of the combined (marginal) likelihood. Thus, PVT is a partitioning model (Ferreira et al., 2002; Byers & Raftery, 2002;
Poisson Voronoı¨ tiling Lawson & Denison, 2002) for which the number of clusters is an outcome, not a prerequisite input. The j th random partitioning of K generates M j disjoint regions fT1j ; . . . ; TM g by a Voronoı¨ tessellation of K given a set of M random uniformly distributed locations (tj tj1 ; . . . ; tjM ) in K (Okabe et al., 2000; Ferreia et al., 2002). The point density (l) in the m th random VC (l(Tmj )) is simply the number of observed points in the region (#z Tmj ) divided by the area of the region ljm
#z⁄Tmj
Area(Tmj )
1
;m
1; . . . M; j
1; . . . ; J
(2)
Intuitively, a high value of ljm suggests a high likelihood that the region (and all observed points and locations therein) is part of A and vice versa. In other words, if one can quantify the likelihood it would be possible to proceed with J classifications of Z and all locations of interest in K and then estimate A by a final optimized classification. The next subsection describes how to obtain a data-based estimate of the density distribution for clutter and feature points via an EM-classification procedure (ECM). EM-classification estimation of density distributions in A and K/A It was assumed that the n observed points in K were a mixture of feature and clutter points. Accordingly, the density distribution of areas (ai , i /1,. . .,n ) of the n VCs produced by a Voronoı¨ tessellation of K around Z can be viewed as a mixture distribution of two class-specific densities, say g(ai jufeature ) and g?(ai juclutter ) governed by class-specific vectors of parameters u. Small values of ai are expected to be indicative of a feature point and a large value of a clutter point. A two-parameter Gamma distribution was adopted for both g and g ?, since it has been found to be suitable for VC areas (Hinde & Miles, 1980). Maximum likelihood estimates of ufeature and uclutter were obtained by an application of the EM algorithm (Dempster et al., 1977). The EM estimation begins with an initial classification of the n points to either feature or clutter. The class assignment was based on draws of a Bernoulli random variable with probability of feature equal to vinit feature (ai )
1
(ai
Min(ai ))(Max(ai )
Min(ai ))
1
(3) init ˆ A set of maximum likelihood estimates ufeature and init uˆ clutter was then obtained for this initial classification. Then points were reclassified based on
init feature if g(ai j uˆ feature ) clutter otherwise
zi
init
g(ai j uˆ clutter )
241 (4)
This sequence of a classification step followed by a re-estimation of the parameters was iterated until no point changed class membership between two iterations. For the examples six to 14 iterations were needed. Poisson Voronoı¨ tiling feature classification of points and locations in K Following the j th random PVT of K into M VCs the likelihood that the i th point is a feature or a clutter point was estimated as lij (zi featurejzi Tmj ) lij (zi clutterjzi Tmj )
g(ljm1 juˆfeature ) g(ljm1 juˆclutter )
(5)
where ljm1 is defined in eq. (2). For the purpose of a final classification and standardization, each likelihood was transformed to a ‘‘probability’’ of feature (vfij ) as in vˆ fij i
lij (zi lij (zi
featurejzi
1; . . . n; j
1...J
featurejzi
Tmj )
lij (zi
Tmj ) clutterjzi
Tmj )
;
(6)
The clutter probability was defined as vˆ cij 1 vˆ fij : These probabilities were averaged over J /2000 repeat PVT to give v¯ fi and v¯ ci ; respectively, for all z . The number of random regions (M ) was fixed at the largest integer smaller than n /6. Hence a random region contains, on average, six points (z), which means that ljm approximates an estimator based on a nearest neighbor kernel smoothing (Møller, 1994). The above procedure detailed the repeat classifications of Z. By attaching to the VC of each point its area, an estimate of A would follow from finding the value of p that optimizes eq. (1) given the final classification rule: zi feature iff v¯ fi p: However, such an estimate is not only inefficient, but also ignores the J de facto classifications of every location in K. A better estimate of A would account for the likelihood that an arbitrary location in K is part of the feature domain. Since there is an infinite number of locations in K it is only practical to obtain the likelihood estimate for a large number (RC ) of locations on a regular grid of R rows and C columns in K (RC /R /C ). Each location (r, c ) in this grid is classified as above and contributes potentially to A , an area defined as the rectangle centered at (r, c) and with an area of jK j (R C) 1 : In practice RC is a compromise between the desire of a high spatial resolution and the computational burden. A pragmatic compromise is to choose RC such that no grid cell in K contains more than one observed point.
242
S. Magnussen et al.
RC jnlog(n)j was found to be satisfactory in these examples. Let v¯ f(r;c) denote the average likelihood that a location in row r and column c in K is part of A. Given v¯ fi for every observed point and correspondingly v¯ f(r;c) for every grid cell location in K, the aim is to estimate a threshold value p for the classification of points and grid-cells to feature that maximizes the product of the likelihood in eq. (1) and the likelihood of the final classification of the n points. From the final classification of Z and of A was obtained, as the union of the grid-cells with a final assignment to feature. A non-parametric maximum profile likelihood for estimation of A Allard and Fraley (1997) proposed a method for finding one feature cluster by maximizing eq. (1) under a set of fairly restrictive constraints. Here, their procedure is extended to C clusters. The constraints under which eq. (1) is optimized are: (1) the number of clusters (C ) is known; (2) the area associated with a point is the VC of the point in a Voronoı¨ tessellation of K ; (3) a cluster is composed of two or more connected VCs; and (4) the search is restricted to all possible classifications of the m smallest VCs into C clusters of feature points (m 2C 1; . . . ; n C): Two VC are connected when they share an edge. Disjoint clusters of connected VC do not share any vertex. Algorithms based on graph theory (Skiena, 1990) are used to identify disjoint clusters of connected VC . The constrained maximum is searched sequentially over increasing values of m until the global maximum of eq. (1) has been reached. The partitioning that for a given C maximizes eq. (1) was retained as the solution to the estimation problem. The number of clusters (C ) is not known, but must somehow be estimated. Therefore, the above optimization procedure was repeated across a range of C values that extended beyond what a visual inspection of the observed point pattern would suggest, and then the C value was chosen that maximized Bayes’ information criterion (BIC), as detailed in a later section. Smoothed non-parametric maximum profile likelihood for estimation of A The outline of clusters of connected VCs in a proposed partitioning of K is typically highly irregular (jagged) and the interior of a cluster may exhibit holes. In practical applications a more regular outline of clusters and the elimination of any interior holes may be deemed desirable. This can be
achieved by generalizing the clusters by a smoothing operation (Pratt, 2001). The choice of smoothing technique and degree of smoothing will be context specific and driven by user preference. Many smoothing operators are available (Dass & Nair, 2003). Allard and Fraley used a morphological closure operator on the Delauny graph of VCs to obtain a more regular outline of a single cluster. Here, a pragmatic and simple smoothing operator is proposed, with a data-driven choice of the degree of smoothing. The outline of every C -cluster partitioning considered in NMPL as a possible solution was smoothed by first obtaining a binary image representation of the partitioning on a narrow grid of pixels. Pixels were given a value of one if they were part of the proposed feature domain and zero otherwise. The outline of the image representation of the proposed feature domain was then transformed by a binary majority filter (Pratt, 2001). Finally, the marginal profile likelihood in eq. (1) was computed for the smoothed image representation of the proposed partitioning with C as the number of disjoint clusters in the smoothed image representation. A final SNMPL solution was obtained as per NMPL. Two parameters determined the degree of regularization and smoothing: (1) pixel size, and (2) the size of the binary majority filter. Pixel size was small enough to ensure that none was occupied by more than one of the observed points, and to ensure that the ratio of the area of an original VC to that of its image representation could be considered constant across all VCs. Adherence to these guidelines eliminates the possibility that small VCs disappear in the image representation. Pixel size was fixed well below these requirements by choosing the number of columns (C ) and the number of rows (R ) in the projection grid that also kept the error of the area of an image projection of a VC below 0.2%. The size (B) of the majority filter was a function of the size of an individual cluster of connected VCs. Smoothing should affect the outline of a cluster, but not materially alter its area. It was found that B p ffiffiffiffiffiffiffiffiffiffiffiffiffiffiffi 4 Max(2; H¯ W¯ ) works well (/H¯ is the average number of rows, W¯ is the average number of columns occupied by a cluster in its image representation, and q is the largest integer less than q). How many clusters (C)? In the NMPL and SNMPL procedures C had to be specified. A visual inspection of K may suggest a reasonable number, but this ad hoc approach is clearly unsatisfactory. Bayes’ factor, approximated
Poisson Voronoı¨ tiling by BIC, has been applied successfully (Fraley & Raftery, 1998) to the problem of deciding the C value that most closely matches the data for a given model. For a given model (NMPL, SNMPL) and C , BIC was calculated as BIC (Cj )
2loglPL ( )
#p
log(n)
(7)
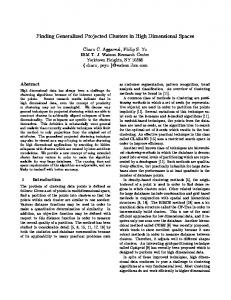
where #px is the number of model parameters. For NMPL and SNMPL #px /C /1, was set, where the plus one is to account for m as a parameter. For both, the lowest value of C that produced a local (or global) maximum of (1) was accepted as the final choice (Fraley & Raftery, 1998). For reason of comparison BIC was also computed for the final PVT solution, here #px /5 (four parameters for the distributions of areas of assumed feature and clutter VCs, and one for estimating p ). Four point patterns The NMPL, SNMPL and the PVT procedures for identifying feature points and feature domain will be applied to four point patterns, two generated from known Poisson processes and known feature domains. The last two illustrate a subset of first-return lidar locations indicative of canopy height in two Douglas-fir-dominated forest stands on Vancouver Island (Magnussen & Wulder, 2004). The subsets represent the assumed position of trees with a tree height in the first quartile of tree heights (tree locations and tree heights were estimated with an adaptive local maximum filter technique; Leckie et al., 2003). Thus, each point represents a tree with a specific height-class attribute. For management and inventory purposes it is desirable to delineate spatial clusters of trees in this height class. Results Example I with one known feature domain The spatial point pattern in Figure 1 with domain K fx (x1 ; x2 )j0 5xi 51; i 1; 2g is considered. The pattern consists of 100 known feature points uniformly distributed within a single compact feature domain A fx (x1 ; x2 )j0:25 x1 50:4 ffl0:25 x2 5 0:8g indicated by the black box. Clutter points (200) are scattered uniformly throughout K . The total number of feature and clutter points in A is 132. The largest BIC value for NMPL, SNMPL and PVT was for one cluster. The one-cluster preferred NMPL solution indicated in Figure 1 contained 91.7% of the points in A (discovery rate, DR ) and the false alarm rate (FAR ) was 1.8%. Thus, the overall error rate (Err ) for MPL was 10.1% [Err % / 100% /(DR % / FAR %)]. The preferred SNMPL
243
solution contained 90.9% of the feature points with FAR / 1.1% and an overall error rate of 10.2%, virtually at par with NMPL. Smoothing achieved the desired regularization of the outline without incurring any important loss in performance. The PVT solution also identified a single cluster which captured 98.5% of the points in A, but also 4.8% of the points not in A (FAR ). Overall error rate for PVT was only 6.3%, well below that for NMPL and SNMPL. The outline of the PVT solution suggests, in hindsight, that increasing the number of random Poisson VC might have shrunk the number of false inclusions. Note that the area of the feature domain was estimated almost correctly at 0.12 (error less than 3%) by NMPL and SNMPL, while the PVT estimate of 0.14 was inflated by about 16%. Accordingly, the NMPL and SNMPL estimates of p were 0.32 while the estimate of PVT was 0.30. Example II with three known feature domains The spatial point pattern in Figure 2 with domain K as in example I but three disjoint feature domains proved to be a more serious challenge for both NMPL and SNMPL than the simple one-cluster scenario. The pattern consists of 67 known feature points uniformly distributed across three feature domains of size 0.02, 0.04 and 0.06. Clutter points (120) were, as before, scattered uniformly throughout K . Hence, the signal/noise ratio has also decreased relative to the first example, which makes the task even more difficult. The largest BIC value for NMPL and SNMPL was for one cluster. However, a two-cluster solution produced almost identical but slightly lower BIC values (Figure 2). The one-cluster preferred NMPL solution contained 90.0% of the points in the combined feature domain A , but also a large number of points not in any feature domain (FAR / 35.9%), yielding a disappointing overall error rate of 45.9%. A two-cluster solution was slightly worse in terms of overall error. The SNMPL solution was very similar, with only inconsequential changes in performance (DR % / 92.9, FAR% / 36.7, Err % / 43.9). NMPL and SNMPL solutions with two to five clusters produced higher error rates. Surprisingly, a six-cluster solution would be comparable in terms of error rates with a one-cluster solution. NMPL and SNMPL estimates of A were 0.28 and 0.32, respectively, more than twice the actual size of 0.12. The PVT solution, in contrast, correctly identified the approximate location of the three feature domains. The PVT solution contained only 73.0% of the actual feature points, but thanks to a low FAR of just 3.5% the overall error rate of 30.6% was well below those achieved with NMPL and SNMPL. The PVT estimate of
244
S. Magnussen et al.
Figure 1. Summary of cluster analysis with example I data (one known feature domain). Top left: Bayes’ information criterion (BIC) versus number of clusters for non-parametric maximum profile likelihood estimation (NMPL) (open squares) and smoothed NMPL (SNMPL) (filled squares). *BIC for Poisson Voronoı¨ tiling (PVT). Top right: Error rates versus number of clusters. Bottom left: Point pattern (dots), true feature domain (black box) and NMPL estimate of the feature domain (gray). Bottom right: SNMPL (gray) and PVT (broken line) estimate of feature domain.
feature domain size was 0.10, or 17% too low. PVT appears to identify the core of a feature domain. Associated estimates of p were 0.44 (NMPL), 0.43 (SNMPL) and 0.26 (PVT) Examples III and IV with unknown feature domain When the number of feature points and the feature domain(s) is unknown the relative performance of NMPL, SNMPL and PVT will be more difficult to evaluate. In examples III (Figure 3) and IV (Figure 4) an inspection of the point patterns makes it clear that viewing them as the outcome of two homogeneous Poisson processes of clutter and feature is at best tenuous. Compact areas with no points suggest a more complex process. In example III the trends in BIC versus the number of clusters indicate that the preferred solutions for NMPL and SNMPL both have three clusters (Figure 3), while that for PVT has four. Tenuous connections between large clusters, however, account for the difference. NMPL and SNMPL solutions are quite similar. NMPL identified 67% as feature points and 24% of the spatial
domain as feature domain. The point density in the clusters was accordingly almost 6.6 times higher than outside. SNMPL placed 80% of the points in the feature class and 33% of the spatial domain into the feature domain, yielding a density ratio of 6.8. PVT only put 52% of the points into the feature class and just 15% of the area into the feature domain, giving a density ratio of 6.0. Again, PVT seems to identify a core feature domain. Estimates of p varied accordingly from 0.5 for VPT to 0.7 for SNMPL. In example IV the preferred NMPL and PVT solution had three clusters (Figure 4), while that of SNMPL had five. NMPL and PVT had the same 60% of the points in the feature class and they agreed to within 2% on the area of the feature domain. Point densities in the three clusters were seven to eight times higher than outside. SNMPL was ‘‘greedier’’ in that it had 66% of the points in the feature class and 21% of the area in the feature domain, yielding a point density that was 7.3 times higher in the feature domain than outside.
Poisson Voronoı¨ tiling
245
Figure 2. Summary of cluster analysis with example II data (three known feature domains). See Figure 1 for explanation of panels and symbols.
Figure 3. Summary of cluster analysis with example III data (unknown feature domain). See Figure 1 for explanation of panels and symbols.
246
S. Magnussen et al.
Figure 4. Summary of cluster analysis with example IV data (unknown feature domain). See Figure 1 for explanation of panels and symbols.
Discussion The delineation of clusters in a point process can be achieved in a variety of ways, from segmentation of a grayscale ‘‘images’’ of local point density (Godtliebsen & Chu, 1995; Bose & O’Sullivan, 1997; Hill, 1999; Lee, 2000), to classification based on k nearest neighbor distances (Byers & Raftery, 1998) and Gaussian models (Fraley & Raftery, 2002). A common problem in all these methods is how to choose the number of clusters (Milligan & Cooper, 1985; Glasbey & Horgan, 1995; Fraley & Raftery, 1998). As discussed by Allard and Fraley (1997), the criterion for choosing the number of clusters remains an open research question. The present choice of BIC was rooted in the general popularity of this model-selection criterion. The non-parametric likelihood approach pioneered by Allard and Fraley (1997) rests on a minimum (restrictive) set of assumptions and is computationally straightforward when the number of clusters is low. In their study, NMPL outperformed a combination of model-based and EMbased alternatives for cluster extraction (Fraley & Raftery, 2002; Dempster et al., 1977). Yet the increase in computational complexity of NMPL and SNMPL as the number of imputed clusters increases, and the lack of a clear-cut criterion for selecting the ‘‘best’’ solution remain definite NMPL and SNMPL detractors. Simpler, but more restric-
tive, approaches such as Gaussian model-based clustering were tried (Fraley, 2002), but the results (not shown) were disappointing as cluster shapes were limited to ellipsoids and circles. When the outline of a cluster is an issue smoothing should be pursued. Allard and Fraley (1997) found a morphological closure (akin to smoothing) attractive. An NMPL solution can also simply be smoothed for the sake of appearance. A search for an optimal smoothed solution is, however, computationally intensive and in the present cases did not produce results that were materially different from a smoothed version of an NMPL solution. As the number of clusters increases the notion of a point process generated by the mixing of two homogeneous Poisson processes becomes increasingly untenable. First, the expected point density in a cluster is likely to vary among clusters. Secondly, as the number of clusters increases the number of points located at the boundary between two spatial processes also increases, which makes it more difficult to separate the two types of points. As a result, several visually highly different NMPL (SNMPL) partitions would have an almost identical likelihood. A simple data model cannot be expected to perform equally well in different circumstances (Kaufman & Rousseeuw, 1990). Partition models for cluster extraction have been suggested as an alternative to procedures that depend on a priori specification of the number of
Poisson Voronoı¨ tiling clusters (Denison et al., 2002; Ferreia et al., 2002; Lawson & Denison, 2002). Computationally intensive Markov chain Monte Carlo (MCMC) simulation with a reversible jump sampler is currently the state-of-art method (Christensen, 2004). Yet the computational complexities of these methods may deter practitioners who are not fully experienced in MCMC simulations. The present PVT model is, by comparison, relatively simple and easy to implement. The simplification is mainly through a fixed choice of the number (M ) of random segments. While M / n /6 may be a reasonable generic choice, the downside is that the proposed solution is probably not optimal. It was seen repeatedly that PVT seems to identify the core of feature domain(s). Alternative choices of M could be tried and tested without undue increase in the computational burden. PVT is sensitive to edge effects (Wikle, 2002). VCs along an edge are, on average, larger than interior VCs (Okabe et al., 2000) which, everything else being equal, makes potential clusters along an edge harder to find. In addition, the isolation of string-like clusters appears difficult, and special clustering algorithms are needed for this task (Rudemo et al., 1990; Metternicht & Fermont, 1998; Wang, 1998; Csillag & Kabos, 2002). Overall, PVT is a flexible and easy to implement procedure for finding clusters in spatial point patterns. A tessellation of a spatial domain into n /6 random VCs is akin to a density estimator based on a nearest neighbor kernel (Møller, 1994). Potential applications of PVT in forestry are likely to expand as point data become more common in forest inventories (Leckie et al., 2003; Popescu et al., 2003; Wulder & Seemann, 2003; St-Onge et al., 2004).
References Allard, D. & Fraley, C. (1997). Nonparametric maximum likelihood estimation of features in spatial point processes using Voronoi tessellation. Journal of the American Statistical Association , 92 , 1485 1493. Bose, S. & O’Sullivan, F. (1997). A region-based segmentation method for multichannel image data. Journal of the American Statistical Association , 92 , 92 106. Byers, S. D. & Raftery, A. E. (1998). Nearest-neighbor clutter removal for estimating features in spatial point processes. Journal of the American Statistical Association , 93 , 577 584. Byers, S. D. & Raftery, A. E. (2002). Bayesian estimation and segmentation of spatial point processes using Voronoi tilings. In A. B. Lawson, & D. G. T. Denison (Eds.), Spatial cluster modelling (pp. 109 121). Boca Raton, FL: Chapman & Hall/ CRC. Cho, V. H. K. (2004). Investigations for segment-based classification of satellite images for the purpose of forest mapping. Allgemeine Forst- und Jagdzeitung , 175 , 94 100.
247
Christensen, O. F. (2004). Monte Carlo maximum likelihood in model-based geostatistics. Journal of Computational and Graphical Statistics , 13 , 704 718. Csillag, F. & Kabos, S. (2002). Wavelets, boundaries, and the spatial analysis of landscape pattern. Ecoscience , 9 , 177 190. Dass, S. C. & Nair, V. N. (2003). Edge detection, spatial smoothing, and image reconstruction with partially observed multivariate data. Journal of the American Statistical Association , 98 , 77 89. Dempster, A. P., Laird, N. M. & Rubin, D. B. (1977). Maximum likelihood from incomplete data via the EM algorithm. Journal of the Royal Statistical Society Series B , 39 , 1 38. Denison, D. G. T., Holmes, C. C., Mallick, B. K. & Smith, A. F. M. (2002). Bayesian methods for nonlinear classification and regression . New York: John Wiley & Sons. Diggle, P. J. (1983). Statistical analysis of spatial point patterns . New York: Academic Press. Ferreia, J. T. A. S., Denison, D. G. T. & Holmes, C. C. (2002). Partition modelling. In A. B. Lawson, & D. G. T. Denison (Eds.), Spatial cluster modelling (pp. 125 145). Boca Raton, FL: Chapman & Hall/CRC. Fraley, C. & Raftery, A. E. (1998). How many clusters? Which clustering method? Answers via model-based cluster analysis. Computer Journal , 41 , 314 327. Fraley, C. & Raftery, A. E. (2002). Model-based clustering, discriminant analysis, and density estimation. Journal of the American Statistical Association , 97 , 611 631. Glasby, C. A. & Horgan, G. W. (1995). Image analysis for the biological sciences . Chichester: Wiley. Godtliebsen, F. & Chu, C. K. (1995). Estimation of the number of true gray levels, their values, and relative frequencies in a noisy image. Journal of the American Statistical Association , 90 , 890 899. Gougeon, F. A. & Leckie, D. G. (2003). Forest information extraction from high spatial resolution images using an individual tree crown approach (Report No. BC-X-396). Canadian Forest Service Information Report, 1 25. Hartigan, J. A. (1975). Clustering algorithms . New York: Wiley. Hill, R. A. (1999). Image segmentation for humid tropical forest classification in Landsat TM data. International Journal of Remote Sensing , 20 , 1039 1044. Hinde, A. L. & Miles, R. E. (1980). Monte Carlo estimates of the distribution of the random polygons of the Voronoı¨ tessellation with respect to a Poisson process. Journal of Statistical Computation and Simulation , 10 , 205 223. Holmgren, P., Thuresson, T. & Holm, S. (1997). Estimating forest characteristics in scanned aerial photographs with respect to requirements for economic forest management planning. Scandinavian Journal of Forest Research , 12 , 189 199. Kaufman, L. & Rousseeuw, P. J. (1990). Finding groups in data. An introduction to cluster analysis . New York: Wiley. Lawson, A. B. & Denison, D. G. T. (2002). Spatial cluster modelling . Boca Raton, FL: Chapman & Hall/CRC. Leckie, D., Gougeon, F., Hill, D., Quinn, R., Armstrong, L. & Shreenan, R. (2003). Combined high-density lidar and multispectral imagery for individual tree crown analysis. Canadian Journal of Remote Sensing , 29 , 633 649. Lee, T. C. M. (2000). A minimum description length-based image segmentation procedure, and its comparison with a crossvalidation-based segmentation procedure. Journal of the American Statistical Association , 95 , 259 270. Lefsky, M. A. & Spies, T. A. (2001). An evaluation of alternate remote sensing products for forest inventory, monitoring, and mapping of Douglas-fir forests in western Oregon. Canadian Journal of Forest Research , 31 , 78 87.
248
S. Magnussen et al.
Lovell, J. L., Jupp, D. L. B., Culvenor, D. S. & Coops, N. C. (2003). Using airborne and ground-based ranging lidar to measure canopy structure in Australian forests. Canadian Journal of Remote Sensing , 29 , 607 622. Magnussen, S. & Wulder, M. A. (2004). Clustering of point patterns derived from LIDAR canopy height data. In M. Thies, B. Koch, & H. Weinacker (Eds.), 36 Part 8/W2 (pp. 183 186). Freiburg: Institute for Forest Growth, Department of Remote Sensing and Landscape Information Systems, University of Freiburg. Maltamo, M., Eerikainen, K., Pitkanen, J., Hyyppa, J. & Vehmas, M. (2004). Estimation of timber volume and stem density based on scanning laser altimetry and expected tree size distribution functions. Remote Sensing of Environment , 90 , 319 330. Metternicht, G. I. & Fermont, A. (1998). Estimating surface features by linear mixture modeling. Remote Sensing of Environment , 64 , 254 265. Milligan, G. W. & Cooper, M. C. (1985). An examination of procedures for determining the number of clusters in a data set. Psychometrika , 50 , 159 179. Møller, J. (1994). Lectures on random Voronoi tessellations . New York: Springer. Næsset, E. (2004). Practical large-scale forest stand inventory using a small-footprint airborne scanning laser. Scandinavian Journal of Forest Research , 19 , 164 179. Okabe, A., Boots, B., Sugihara, K. & Chiu, S. N. (2000). Spatial tessellations. Concepts and applications of Voronoı¨ diagrams (2nd ed). Chicester: Wiley. Pen˜a, D. & Prieto, F. J. (2002). Cluster identification using projections. Journal of the American Statistical Association , 96 , 1433 1445. Popescu, S. C., Wynne, R. H. & Nelson, R. F. (2003). Measuring individual tree crown diameter with lidar and assessing its influence on estimating forest volume and biomass. Canadian Journal of Remote Sensing , 29 , 564 577.
Pratt, W. K. (2001). Digital image processing . New York: John Wiley & Sons. Ripley, B. D. (1985). Statistics, images, and pattern recognition. Canadian Journal of Statistics , 14 , 83 111. Rudemo, M., Skovgaard, I. & Stryhn, H. (1990). Maximum likelihood estimation of curves in images (Report No. 90-4), (pp. 1 40). Copenhagen: Dept. Math. Phys., Royal Vet. Agric. Univ. St-Onge, B. A. & Cavayas, F. (1997). Automated forest structure mapping from high resolution imagery based on directional semivariogram estimates. Remote Sensing of Environment , 61 , 82 95. St-Onge, B., Jumelet, J., Cobello, M. & Vega, C. (2004). Measuring individual tree height using a combination of stereo photogrammetry and LiDAR. Canadian Journal of Forest Research , 34 , 2122 2130. Skiena, S. (1990). Implementing discrete mathematics . Redwood, CA: Addison-Wesley. Upton, G. J. G. & Fingleton, B. (1985). Spatial data analysis by example: Vol I Point patterns and quantitative data . Chichester: Wiley. Wang, Y. (1998). Change curve estimation via Wavelets. Journal of the American Statistical Association , 93 , 163 172. Wikle, C. K. (2002). Spatial modelling of count data: A case study in modelling breeding bird survey data on large spatial domains. In A. B. Lawson, & D. G. T. Denison (Eds.), Spatial cluster modelling (pp. 199 209). Boca Raton, FL: Chapman & Hall/CRC. Wulder, M. A. & Seemann, D. (2003). Forest inventory height update through the integration of lidar data with segmented Landsat imagery. Canadian Journal of Remote Sensing , 29 , 536 543. Yu, X. W., Hyyppa, J., Kaartinen, H. & Maltamo, M. (2004). Automatic detection of harvested trees and determination of forest growth using airborne laser scanning. Remote Sensing of Environment , 90 , 451 462.