APPLIED PHYSICS LETTERS 86, 192902 共2005兲
Polarization reversal and capacitance-voltage characteristic of epitaxial Pb„Zr, Ti…O3 layers L. Pintiliea兲 and M. Lisca Max Planck Institute for Microstructure Physics, Weinberg 2, 06120 Halle, Germany and NIMP, P.O. Box MG-7, Bucharest-Magurele, 077125, Romania
M. Alexe Max Planck Institute of Microstructure Physics, Weinberg 2, D-06120 Halle, Germany
共Received 18 January 2005; accepted 29 March 2005; published online 2 May 2005兲 Capacitance-voltage 共C–V兲 measurements were performed on epitaxial layers of Pb共Zr0.2Ti0.8兲O3 共PZT兲 with top and bottom SrRuO3 共SRO兲 electrodes. It is shown that the sharp capacitance peak/discontinuity which is present in the C–V characteristics at different frequencies is directly associated with the polarization reversal. The ferroelectric film is assumed as a large band-gap semiconductor with Schottky contacts at the metal-ferroelectric interfaces. The capacitance discontinuity at the reversal 共coercive兲 voltage is associated with a discontinuity in the built-in potential at the PZT/SRO interfaces. The C–V characteristics for voltage ranges outside the coercive values can be used to extract the free carrier concentrations as in the case of Schottky metal-semiconductor contacts. The carrier concentration was found to be 共2–4兲 ⫻ 1018 cm−3, independent of measuring frequency and temperature up to 1 MHz and 170 °C, respectively, suggesting completely ionized shallow impurities. © 2005 American Institute of Physics. 关DOI: 10.1063/1.1926403兴 Ferroelectric thin films are of high interest mostly due to their potential applications in microelectronics, especially in the field of nonvolatile memories.1 The electrical characterization of thin ferroelectric films is widely based on three type of measurements: dielectric hysteresis loop 共D-E or P-E兲, current-voltage 共I–V兲 characteristic, and capacitancevoltage 共C–V兲 characteristic.2 Despite the widespread use of the above measurements, there are no generally accepted models to allow a unitary and coherent description of the results. The C–V characteristic has a butterfly-loop shape in the case of metal-ferroelectric-metal structures. The voltage dependence of the capacitance is usually explained either in terms of the pure field dependence of the dielectric constant or by the voltage dependence of the depletion layers that build up at the contact between the electrode and the ferroelectric film. In the first case the ferroelectric film is considered an ideal insulator, whereas in the second case the ferroelectric film is regarded as a semiconductor with a voltagedependent dielectric constant.3–6 It was also asserted that the C–V measurement can be used to extract the reversible polarization, based on the fact that the dc bias sets the polarization value, while the small ac voltage produces reversible movements of the domain walls.7 The origin of the capacitance peaks in the C–V characteristics was not clearly explained, considering that such peaks can occur also in nonferroelectric structures with Schottky contacts or involving p-n junctions.8 The possible link between the maxima in capacitance and the polarization reversal has not been investigated in detail. A major drawback of previous C–V studies was the quality of the investigated films, most of them being polycrystalline. Additional effects due to grain boundaries, a兲
Author to whom all correspondence should be addressed; electronic mail:
[email protected]
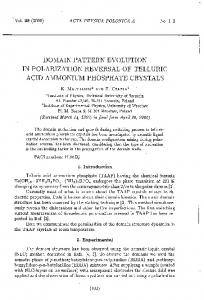
electrically active impurities, or structural defects, etc., were neglected. Meaningful studies of the link between the C–V characteristic and polarization reversal will require high quality single crystalline thin films. The present article discusses C–V characteristics of a high-quality epitaxial Pb共Zr, Ti兲O3 共PZT兲 film with oxide electrodes. The single-crystal-like ferroelectric film allowed us to separate the switching effects from the pure electronic behavior of the electrode-film interface, as well as an estimation of the free carrier concentration. Epitaxial PZT films with a Zr/Ti ratio of 20/ 80 were grown at 600 °C on epitaxial SrRuO3 共SRO兲 layers acting as bottom electrode. The growth was performed by pulsed laser deposition on 共100兲-oriented SrTiO3:Nb 共0.5 % wt兲 single crystals. The bottom SRO electrode was grown at 750 °C. The top SRO electrode was deposited at room temperature through a shadow mask with an area of 0.275 mm2 and then annealed at 575 °C. Details on growth procedure and structural properties are given elsewhere.9 The selected PZT composition minimizes the structural misfit with the electrode material. That minimizes the influence of extended structural defects, i.e., misfit dislocations, on the electrical properties of the ferroelectric film. The growth process was carefully optimized using transmission electron microscopy, x-ray diffraction, and atomic force microscopy 共AFM兲. AFM and piezoelectric AFM showed an average roughness of about 0.4 nm, the absence of grain boundaries, and a very low density of a domains. The hysteresis loop was measured at 1 kHz using a TF2000 analyzer in dynamic mode. A typical hysteresis loop is presented in Fig. 1. A remnant polarization of about 40 C / cm2 and a coercive field of about 150 kV/cm are typical values for the optimized epitaxial PZT layers. The shape of the hysteresis loop is very close to the ideal loop, i.e., almost rectangular, although the reversal is not symmet-
0003-6951/2005/86共19兲/192902/3/$22.50 86, 192902-1 © 2005 American Institute of Physics Downloaded 12 May 2005 to 195.37.184.165. Redistribution subject to AIP license or copyright, see http://apl.aip.org/apl/copyright.jsp
192902-2
Pintilie, Lisca, and Alexe
Appl. Phys. Lett. 86, 192902 共2005兲
FIG. 1. Hysteresis loop acquired on an epitaxial SRO/PZT 共20/ 80兲/SRO layer structure at 1 kHz.
FIG. 3. C–V characteristics at 1 kHz measured after poling the film with ⫺6 V for one minute.
ric with voltage polarity, suggesting possible not equivalent electrode-ferroelectric interfaces. The present work focuses on analysis of the C–V characteristics which were experimentally acquired using an HP4194A impedance/gain analyzer. The electric field associated with the ac signal was always kept well below the coercive field. The thickness of PZT films was about 200 nm and the ac signal was 50 mV. Typical C–V characteristics obtained at different frequencies are presented in Fig. 2. The shape is the same no matter the voltage is swept up-down, or vice versa. The “butterfly” shape is obtained for all frequencies. Marked capacitance peaks for both positive and negative voltages can be observed at low frequencies, i.e., up to 10 kHz. These peaks transform into capacitance discontinuities at higher frequencies. The following experiment was performed in order to determine if the peaks/discontinuities in the capacitance are related to the polarization reversal. The polarization was switched down by applying a negative voltage of ⫺6 V for about 1 min. Then the C–V characteristics were measured by sweeping the voltage up and down between zero and ⫹6 V. The obtained results are presented in Fig. 3. The capacitance peak occurs only by sweeping up the voltage, and is absent by sweeping the dc voltage down to zero. Subsequent sweeping up and down the dc voltage in the same range do not reveal any peak. Similar results were obtained after prepoling the film with ⫹6 V and performing the C–V measurement by sweeping the voltage down and up between zero
and ⫺6 V. These results indicate that the capacitance peaks and the butterfly shape are directly related to the irreversible switching of the ferroelectric polarization. Capacitance peaks can also originate from trapping/detrapping effects near the Schottky contacts but such phenomena are reversible, thus the butterfly shape should not be present in this case. A qualitative indication suggesting the connection between the polarization switching processes and the C–V characteristics is that the switching asymmetry observed in the hysteresis loop can be found also in the C–V curves in Fig. 2 where the slopes toward the switching peaks are clearly different for the two branches. This helps to correlate the slim hysteresis loop, usually exhibited by polycrystalline ferroelectric films, with the broad switching peaks observed in their C–V characteristics. The link of the capacitance peak with the polarization reversal has important consequences. First, the C–V characteristics do not show only reversible processes, as it was previously claimed, but includes also the irreversible processes due to the polarization switching by sweeping the dc voltage. A second important aspect is that the voltages corresponding to capacitance peaks are in fact the coercive voltages. It means that the average coercive field evaluated from the C–V measurements 共Fig. 2兲 is about 80 kV/cm, which is about half of the value determined from the hysteresis loop of Fig. 1. The P-E loop is acquired at a certain frequency, i.e., 1 kHz, while the C–V curve is a quasistatic measurement, i.e., the dc bias voltage is swept with few millivolts/ second 共equivalent to millihertz in frequency兲. This fact suggests that there is a significant difference in the quasistatic and dynamic switching processes. A reasonable explanation is that a different irreversible process, closely related to the polarization reversal, is responsible for the capacitance discontinuity in the C–V characteristics. This explanation is based on the assumption that the ferroelectric film is a large band-gap semiconductor and the SRO-PZT interfaces act as a Schottky contacts. The structure is described by a back–to–back connection of two Schottky diodes. The PZT film is considered p type2,10 with a band diagram similar to that proposed by Scott.2 The built-in potential, which is a measure of the band bending near the electrode interfaces,11 is controlled by the polarization charge value and sign.12 At one interface the polarization charge decreases the built-in potential compared with the situation when the polarization is absent, while at the other interface the built-in potential is increased by the polarization charge.
FIG. 2. C–V characteristics acquired at different frequencies. The ac probing signal was 50 mV. The number of steps for sweeping up or down the dc voltage was 400, thus the step was of 35 mV. The total time for a measurement was of 35 s. The corresponding frequency is about 0.028 Hz. Downloaded 12 May 2005 to 195.37.184.165. Redistribution subject to AIP license or copyright, see http://apl.aip.org/apl/copyright.jsp
192902-3
Appl. Phys. Lett. 86, 192902 共2005兲
Pintilie, Lisca, and Alexe
FIG. 4. Carrier concentration calculated with Eq. 共1兲 from the C–V measurements at 1 kHz 共dots兲 and 1 MHz 共solid line兲. The boxes indicate the voltage ranges in which Eq. 共1兲 might be applied.
The capacitance of a Schottky contact depends on the built-in potential.11 Therefore, when the polarization switches a sudden change of the built-in potential occurs by changing the sign of the polarization charges at the two interfaces. This sudden and irreversible change in the built-in potential, due to polarization reversal, leads to the capacitance discontinuity observed in the C–V characteristic. Once the polarization reversed and saturated, the built-in potential remains the same up to the coercive voltage of opposite sign. This explains why the capacitance peak in Fig. 3 occurs only when the voltage is swept up, and polarization is reversed, and is absent when the voltage is swept down, and no reversal is present. It can be assumed that outside the voltage range where the polarization reversal takes place, the system behaves as a normal Schottky contact and the associated theory can be applied. Thus, the C–V characteristics can be used to extract the free carrier concentration in the same way as in the case of semiconductor Schottky contact using the relation13 c共T兲 =
2 , qA 0st关d共1/C2兲/dV兲 2
共1兲
where c共T兲 is the free carrier concentration 共electrons or holes兲 at the given temperature T, q is the electron charge, 0 is the free space permittivity, st is the static dielectric constant as determined from capacitance measurements at zero applied field. This is a general equation, which is used to extract the spatial distribution of the free carrier concentration, known also as the “doping profile.”13 The capacitance dependence on the applied dc voltage is not important in this case, as the free carrier concentration is not evaluated from the slope of a particular representation such as 1 / C2 ⬃ V or similar.2,14 The voltage dependence of the free carrier concentration for the extreme frequencies of 1 kHz and 1 MHz is presented in Fig. 4. As expected, there is a hysteresis loop. The sharp change in the sign is not due to the change in the carrier type. This is due to sign changing in the d共1 / C2兲 / dV derivative when the reversal takes place 共see Fig. 2兲. The rectangles in Fig. 4 mark the voltage ranges where Eq. 共1兲 can be accurately used to evaluate the free carrier concentration of the film. It appears that for positive up voltage on the reference top electrode the concentration is constant with voltage, indicating a uniform distribution of the free carriers within the film 共as the depletion region moves with the ap-
plied bias兲. If the PZT film is p type, then positive polarity on the top electrode means reverse bias. It appears from Fig. 4 that the concentration near the top interface is uniform, while at the other interface, it is not as uniform. The nonuniformity cause can be a gradient of the doping impurity or can be related to the carriers trapping on deep centers. The carrier concentration determined from Eq. 共1兲 is in the 共2–4兲 ⫻ 1018 cm−3 range. This value is of the same order as other reports.15,16 It worth noting that the above value is a free carrier concentration, while the previous reports refer to fixed or trapped charges. The concentration is frequency and temperature independent up to 1 MHz and 170 °C, respectively, suggesting a complete ionization of the doping impurity and a negligible contribution from deep traps, at least for the time scale of the dc voltage change during the C–V measurement.17 In conclusion we have shown that the sharp capacitance peaks occuring in the C–V characteristics measured on epitaxial PZT films, assumed to be wide band-gap semiconductors with Schottky contacts, are related to the polarization reversal. The voltage dependence of the dielectric constant might be important for values between the coercive voltages when the reversal takes place. Outside the coercive voltages the polarization is fully saturated and the dielectric constant is nearly voltage independent. Therefore, the C–V characteristic can be used to extract the concentration of free carriers. For epitaxial PZT共20/ 80兲 films a concentration of 共2–4兲 ⫻ 1018 cm−3, independent of the measuring frequency and temperature was found. This suggests a fully ionized doping impurity and negligible contributions from deep traps. Further studies are needed to clarify the nature of the doping impurities, and to investigate the possible link between deep traps and polarization reversal. The work was partly supported by the Volkswagen Stiftung under Contract No. 1/77738. K. Uchino, Ferroelectric Devices 共Marcel Dekker, New York, 2000兲. J. F. Scott, Ferroelectric Memories, in Advanced Microelectronics Series, edited by K. Itoh and T. Sakurai 共Springer-Verlag, Berlin, 2000兲. 3 A. Outzourhit, A. Naziripour, J. U. Trefny, T. Kito, B. Yarar, R. Yandrofski, J. D. Cuchiaro, and A. M. Hermann, Integr. Ferroelectr. 8, 227 共1995兲. 4 J. F. Scott, Ferroelectrics 232, 25 共1999兲. 5 C. Basceri, S. K. Streiffer, A. I. Kingon, and R. Waser, J. Appl. Phys. 82, 2497 共1997兲. 6 C. H. Lin, P. A. Friddle, C. H. Ma, A. Daga, and H. Chen, J. Appl. Phys. 90, 1509 共2001兲. 7 D. Bolten, U. Boettger, and R. Waser, J. Appl. Phys. 93, 1735 共2003兲. 8 J. F. M. Cillessen, M. W. J. Prins, and R. M. Wolf, J. Appl. Phys. 81, 2777 共1997兲. 9 L. Pintilie, M. Lisca, and M. Alexe, Proc. of the 27th International Semiconductor Conference, October 4–6, 2004, Sinaia, Romania, IEEE Catalog No. 04TH8748 共MiniPrint, Bucharest, 2004兲, Vol. 2, p. 415. 10 M. Dawber and J. F. Scott, J. Phys.: Condens. Matter 16, L515 共2004兲. 11 S. M. Sze, Physics of Semiconductor Devices, 2nd ed. 共Wiley, New York, 1981兲. 12 L. Pintilie and M. Alexe, J. Appl. Phys. 共accepted for pubication兲. 13 D. K. Schroeder, Semiconductor Material and Device Characterization 共Wiley-Interscience, New York, 1998兲. 14 S. K. Dey, P. Alluri, J. J. Lee, and R. Zuleeg, Integr. Ferroelectr. 7, 341 共1995兲. 15 S. K. Dey and R. Zuleeg, Ferroelectrics 109, 1643 共1990兲. 16 T. Mihara, H. Watanabe, H. Yoshimori, C. A. Paz de Araujo, B. Melnick, and L. D. McMillan, Integr. Ferroelectr. 1, 269 共1992兲. 17 A. K. Jonscher, Dielectric Relaxation in Solids 共Chelsea Dielectrics, London 1983兲. 1 2
Downloaded 12 May 2005 to 195.37.184.165. Redistribution subject to AIP license or copyright, see http://apl.aip.org/apl/copyright.jsp