Sep 20, 2018 - 2009; Zabel and Engel, 2010; Arriagada et al., 2012; Alix-Garcia et al., 2015, Pagiola et. 492 al., 2016, Jayachandran et al., 2017). These two ...
bioRxiv preprint first posted online Sep. 20, 2018; doi: http://dx.doi.org/10.1101/421933. The copyright holder for this preprint (which was not peer-reviewed) is the author/funder, who has granted bioRxiv a license to display the preprint in perpetuity. It is made available under a CC-BY-NC-ND 4.0 International license.
1
Title
2
Policy lessons from spatiotemporal enrollment patterns of Payment for Ecosystem
3
Service Programs in Argentina
4
5
6
Authors
7
Mauricio M. Núñez -Regueiro1,8, Lyn C. Branch3, Josh Hiller2, Cristina Núñez Godoy3,4,
8
Sharmin Siddiqui5, José Volante6, José R. Soto7
9
10
1. Bridging Biodiversity and Conservation Science. Institute of the Environment and
11
Udall Center for Studies in Public Policy. University of Arizona, Tucson, United States of
12
America.
13
2. Department of Mathematics and Computer Science. Adelphi University, One South
14
Ave., Garden City, NY,11530, United States of America.
15
3. Wildlife Ecology and Conservation (WEC), University of Florida, 110 Newins-Ziegler
16
Hall, Gainesville, FL 32611, United States of America.
17
4. School of Natural Resources and Environment (SNRE), University of Florida, 103
18
Black Hall, Gainesville, FL 32611, United States of America.
19
5. Engineering School of Sustainable Infrastructure and Environment. Environmental
20
Engineering Sciences Department. University of Florida, Gainesville, FL 32611, United
21
States of America.
22
6. Instituto Nacional de Tecnología Agropecuaria (INTA), Estación Experimental
23
Agropecuaria Salta, Ruta Nacional 68 Km 172, 4403 Cerrillos, Salta, Argentina.
24
7. School of Natural Resources & The Environment, The University of Arizona, 1064 E.
25
Lowell Street - ENR2 #N418, Tucson, Arizona, United States of America
26
8. Instituto de Bio y Geociencias del NOA (IBIGEO), Consejo Nacional de
27
Investigaciones Científicas y Técnicas (CONICET), Universidad Nacional de Salta. Av.
28
Bolivia 5150, 4400, Salta, Argentina.
29
30
31
1
bioRxiv preprint first posted online Sep. 20, 2018; doi: http://dx.doi.org/10.1101/421933. The copyright holder for this preprint (which was not peer-reviewed) is the author/funder, who has granted bioRxiv a license to display the preprint in perpetuity. It is made available under a CC-BY-NC-ND 4.0 International license.
32
Abstract
33
Over the last 50 years, payment for ecosystem services schemes (PES) have been
34
lauded as a market-based solution to curtail deforestation and restore degraded
35
ecosystems. However, PES programs often fail to conserve sites under strong long-
36
term deforestation pressures and allocate financial resources without having a sizeable
37
impact on long-term land use change. Underperformance, in part, is likely due to
38
adverse selection as landowners with land at the lowest threat from conversion or loss
39
may be most likely to enroll or enrollment may be for short time-periods. Improving
40
program performance to overcome adverse selection requires understanding attributes
41
of landowners and their land across large scales to identify spatial and temporal
42
enrollment patterns that drive adverse selection. In this paper, we examine these
43
patterns in Argentina’s PES program in the endangered Chaco forest ecoregion, which
44
was established in 2007 under the National Forest Law. Our study area covers 252,319
45
km2. Among our most important findings is that large parcels of enrolled land and land
46
owned by absentee landowners show greater evidence of spatiotemporal adverse
47
selection than smaller plots of land and land owned by local actors. Furthermore, lands
48
managed for conservation and restoration are more likely to be associated with adverse
49
selection than lands that provide financial returns such as harvest of non-timber forest
50
products, silviculture, and silvopasture. However, prior to recommending that PES
51
programs focus on land uses with higher potential earnings, a greater understanding is
52
needed of the degree to which these land uses meet ecological and biodiversity goals of
53
PES programs. Because of this, we posit that a PES incorporating a market-based
54
compensation strategy that varies with commodity prices, along with approaches that
55
provide incentives for conservation and restoration land uses and enrollment of local
56
landowners, could promote long-term conservation of endangered lands.
57
58
59
Keywords (Max 6): payment for ecosystem services, market-based strategies, natural
60
resource policy, forest conservation, Chaco, ecosystem services.
61
62
2
bioRxiv preprint first posted online Sep. 20, 2018; doi: http://dx.doi.org/10.1101/421933. The copyright holder for this preprint (which was not peer-reviewed) is the author/funder, who has granted bioRxiv a license to display the preprint in perpetuity. It is made available under a CC-BY-NC-ND 4.0 International license.
63
1. Introduction
64
65
Current deforestation levels threaten biodiversity and provision of ecosystem
66
services such as CO2 storage and mitigation of climate change. Incentive-based
67
strategies such as Payments for Ecosystem (or Environmental) Services (PES)
68
programs have been championed as a means to preserve forests by providing financial
69
incentives to forest owners who voluntarily enroll in payment schemes and, in exchange
70
for payments, commit to continued provision of ecosystem services (Wunder et al.,
71
2008). However, effectiveness of PES may be hindered when participants enroll land
72
with low threat of deforestation (i.e., lands that would likely remain forested regardless
73
of PES), thus increasing the budgetary cost of the program while having only a minimal
74
impact on deforestation (adverse selection; Ferraro, 2008). An analogous situation
75
occurs when land under high deforestation threat is enrolled for short time periods.
76
These projects may provide little return for conservation but still increase the cost of the
77
PES program (adverse selection in time, Drechsler et al., 2017; Núñez-Regueiro et al.,
78
in review). Temporal and spatial enrollment patterns are critical for understanding this
79
issue because they drive adverse selection, one of the greatest challenges for PES
80
(Ferraro, 2008; Sims et al. 2014; Pagiola et al., 2016; Drechsler et al., 2017).
81
Factors that may contribute to spatial or temporal enrollment patterns and result
82
in adverse selection are diverse, including characteristics of landowners and
83
landholdings, and restrictions on land uses under the PES program. For example,
84
landowners who depend primarily on agricultural production for their livelihood might be
85
less likely to enroll highly productive lands, and thus lands under higher threat of
86
deforestation, than landowners who either have other sources of income or manage
87
land for purposes other than income generation (Alix-Garcia et al., 2015; Robinson et al.
88
2016; Silva et al., 2016). Similarly, local landowners closely involved with agricultural
89
production may be less willing to enroll lands for long periods of time than absentee
90
landowners, who generally have other sources of income (Miranda et al., 2003;
91
Arriagada et al., 2009; Petrzelka et al., 2013). Landholding size also may influence
92
enrollment. Large landowners may have smaller agricultural production cost, higher
93
profits per unit of land, and thus less incentive to enroll land with high potential for
3
bioRxiv preprint first posted online Sep. 20, 2018; doi: http://dx.doi.org/10.1101/421933. The copyright holder for this preprint (which was not peer-reviewed) is the author/funder, who has granted bioRxiv a license to display the preprint in perpetuity. It is made available under a CC-BY-NC-ND 4.0 International license.
94
agriculture than small landowners (Cushman, 2006; Arriagada et al., 2012). The land
95
use allowed on a property under PES also could influence spatial and temporal patterns
96
of enrollment, and thus probability of adverse selection (Arriagada et al., 2009; Miteva et
97
al., 2012). More restrictive land uses may reduce profits and limit the ability of
98
landowners to track markets, and thus discourage long term enrollment of highly
99
productive lands.
100
To date, studies of adverse selection have focused on whether participants enroll
101
lands that are threatened, but the importance of contract length has received little
102
attention (Arriagada et al., 2009; Alix-Garcia et al., 2015; Sims and Alix-Garcia, 2017),
103
possibly because most PES programs have a fixed contract length (e.g., four-five years,
104
Schomers and Matzdorf, 2013; Ezziene-de-Blas et al., 2016; Pagiola et al., 2016; Sims
105
and Alix-Garcia, 2017). However, even with fixed contracts, renewable contracts
106
provide opportunities for variable enrollment times for landholdings. Moreover, studies
107
of PES that include information on attributes of landowners and their land are rare
108
(Miteva et al., 2012; Schomers and Matzdorf, 2013; Ezziene-de-Blas et al., 2016). Thus,
109
understanding of how characteristics of the landholding, landowner attributes, and land
110
use relate to adverse selection remains limited.
111
In this paper, we identify predictors of spatial and temporal enrollment patterns in
112
Argentina’s PES scheme. We focus on the PES program in the Chaco dry forest in
113
northwestern Argentina, a forest with one of the highest levels of deforestation
114
worldwide fueled by rapid expansion of soybean and livestock production (Grau et al.,
115
2008; Hansen, 2013; Volante et al., 2016; Nolte et al. 2017a; Fehlenerg et al., 2017).
116
Like other PES programs, this one aims to avoid deforestation through voluntary
117
enrollment of threatened land (Schomers and Matzdorf, 2013; Ezziene-de-Blas et al.,
118
2016; Pagiola et al., 2016; Sims and Alix-Garcia, 2017). A key characteristic that
119
distinguishes the Argentine PES program from others is that contract lengths vary
120
among participants (Garcia Collazo et al., 2013). This, in combination with readily
121
available information on agricultural potential and other characteristics of landholdings,
122
economic activities of landowners, and land use, provides a rich platform to identify
123
factors that contribute to both temporal and spatial adverse selection.
4
bioRxiv preprint first posted online Sep. 20, 2018; doi: http://dx.doi.org/10.1101/421933. The copyright holder for this preprint (which was not peer-reviewed) is the author/funder, who has granted bioRxiv a license to display the preprint in perpetuity. It is made available under a CC-BY-NC-ND 4.0 International license.
124
We hypothesized that the primary economic activity of landholders would be a
125
strong driver of temporal and spatial enrollment patterns linked to adverse selection.
126
Participants in this PES program range from private landowners with large agricultural
127
operations to real estate agents, indigenous communities, and local governments
128
managing public land (Graziano Ceddia and Zepharovich, 2017; le Polain de Waroux et
129
al., 2017; Marinaro et al., 2017). In addition to primary economic activity of landowners,
130
we examined three other factors that could influence enrollment patterns related to
131
adverse selection: 1) whether landowners were local or absentee, 2) size of enrolled
132
property, and 3) type of land-use allowed at the site under PES, which ranged from
133
partial forest removal for silvopastoral management to strict conservation.
134
Overall, we found that primary economic activity was not the most parsimonious
135
predictor of adverse selection, though this was related to other factors. Alternatively, the
136
land uses allowed, whether landowners were local or absentee, and size of enrolled
137
parcels were better predictors of observed spatial and temporal adverse selection. Our
138
findings suggest that the Argentine PES program will have stronger chances of enrolling
139
land with high agricultural potential and longer contracts if it targets local landowners
140
who submit small parcels and land-use plans that have the potential to provide
141
additional earnings, such as silviculture, silvopasture, or non-timber forest products.
142
Relatively few large parcels were enrolled, particularly in areas of high deforestation
143
threat, and enrollment was shorter for large parcels, which represents a fundamental
144
challenge for both this program and environmental conservation of the threated Chaco.
145 146
2. Methods
147
148
2.1.
Study Area
149
The Chaco forest of Argentina, Bolivia, and Paraguay is the second largest
150
forested ecoregion in South America, after the Amazon, and a key global conservation
151
area because of high levels of biodiversity and endemism (Fehlenberg et al. 2017;
152
Kuemmerle et al., 2017). The Chaco suffers from record-high land-conversion driven by
153
large-scale agriculture (Grau et al., 2008; Gasparri et al. 2013; Kuemmerle et al., 2017).
154
Sixty percent of the Chaco occurs in Argentina, and many rural and indigenous
5
bioRxiv preprint first posted online Sep. 20, 2018; doi: http://dx.doi.org/10.1101/421933. The copyright holder for this preprint (which was not peer-reviewed) is the author/funder, who has granted bioRxiv a license to display the preprint in perpetuity. It is made available under a CC-BY-NC-ND 4.0 International license.
155
communities rely on the natural resources of this region. Our study focuses on the four
156
provinces in Northwestern Argentina that hold the largest tracts of Chaco forest: Chaco,
157
Formosa, Salta, and Santiago del Estero (252,319 km2, Fig. 1). This landscape consists
158
of remnant forest strips, small forest patches, and some larger forest blocks embedded
159
in a matrix of large farms primarily used for soybeans or cattle pasture (Núñez-Regueiro
160
et al., 2015).
161
162
2.2.
Program Description.
163
In recognition of the need to curb high rates of deforestation, Argentina’s legislature
164
passed an innovative law (Native Forest Law 26331; henceforth Forest Law) in 2007
165
that established a minimum annual federal budget for environmental protection,
166
enrichment, restoration, conservation, and sustainable management of native forests
167
and the environmental services they provide (Garcia Collazo et al., 2013, Aguilar et al.
168
2018). Under the Forest Law, the federal government sets general requirements for
169
environmental protection and funds a national-level PES program that distributes funds
170
to the provinces. Each province defines its own conservation priorities and management
171
objectives, and decides how to allocate the funds (Nolte et al., 2017a). The Forest Law
172
required national-level land-use planning to identify, prioritize, and protect important
173
land for local communities and biodiversity conservation. Each province with native
174
forest was responsible for classifying forest into three categories (Fig. 1): Category I
175
(red zone) designates areas of very high value that cannot be deforested or selectively
176
logged. Lands in this zone can be used for conservation, restoration, collection of non-
177
timber forest products, or eco-tourism. Category II (yellow zone) contains areas of
178
medium or high value that should not be deforested but can be used sustainably.
179
Landowners can choose any land use in category I as well as silviculture and
180
silvopasture. Category III (green zone) represents areas of low value that can be
181
cleared of forest. If landowners with land in this category choose to enroll in the
182
program, they have the same land-use choices as landowners with land in the other two
183
categories. The Forest Law stipulates financial compensation for each participating
184
province based on the amount of land in each land-use category and to individual
185
program participants who voluntarily enroll their land in the payment program (Garcia
6
bioRxiv preprint first posted online Sep. 20, 2018; doi: http://dx.doi.org/10.1101/421933. The copyright holder for this preprint (which was not peer-reviewed) is the author/funder, who has granted bioRxiv a license to display the preprint in perpetuity. It is made available under a CC-BY-NC-ND 4.0 International license.
186
Collazo et al., 2013). The administrative unit for this program is the cadastral parcel. A
187
landowner can own several parcels but only enroll one or a few parcels, or even part of
188
a single parcel. Participants first enroll each parcel, or portion of a parcel, for one year
189
by submitting a “formulation project” aimed at collecting baseline biodiversity
190
information. Then, participants submit a plan (in Spanish, “certificado de obra”) for each
191
parcel where landowners commit to conduct activities to maintain or enhance
192
ecosystem services, according to the land uses allowed under each zoning category,
193
and define the contract length for the parcel. Payments are conditional on landowners
194
providing this plan.
195
Arguably, establishing payments in areas with high land-use restrictions provides
196
little additionality (i.e., payments might be redundant given that the Forest Law already
197
protects land in red and yellow categories), and evidence regarding effectiveness of this
198
program as a mechanism to decrease deforestation is the subject of current debate
199
(Nolte et al., 2017a and 2018; Volante and Seghezzo, 2018). Untangling relative
200
contributions of land-use restrictions and payments schemes for reducing deforestation
201
is difficult. However, recent studies show that under the Forest Law, deforestation
202
occurs in restricted areas (i.e., red and yellow zones; Camba Sans et al., 2018) and
203
provincial governments have difficulties enforcing the law (Volante and Seghezzo,
204
2018). Offering payments in areas with land-use restrictions could serve two purposes:
205
1) to compensate landowners for provincially-mandated land-use restrictions and thus,
206
increase overall acceptance and likelihood of compliance with the Forest Law, and 2)
207
provide enrollees with financial resources to sustainably manage their land (Native
208
Forests Law 26331).
209
Between 2010 – 2015, the PES program allocated over US$45 million to 1,341
210
projects in the four Chaco provinces (Núñez-Regueiro et al., in review). This investment
211
resulted in almost 43,000 km2 of land enrolled (equivalent to 17% of available land that
212
could potentially be enrolled in all zoning categories). The geographic scope of
213
Argentina’s PES program in the Chaco is among the largest in the world (Ezziene-de-
214
Blas et al. 2016; le Polain de Waroux et al., 2017). See Supporting Information for more
215
details.
216
7
bioRxiv preprint first posted online Sep. 20, 2018; doi: http://dx.doi.org/10.1101/421933. The copyright holder for this preprint (which was not peer-reviewed) is the author/funder, who has granted bioRxiv a license to display the preprint in perpetuity. It is made available under a CC-BY-NC-ND 4.0 International license.
217
2.3.
218
To assess how characteristics of enrollees and the land enrolled relate to
219
spatiotemporal enrollment patterns, we first obtained a list of geo-referenced properties
220
enrolled in the first five years of the PES program in Chaco (n = 1,341; 2010-2015) from
221
the PES database of the Argentine Ministry of Environment. This dataset also provided
222
the length of contractual obligations, parcel size, size of land enrolled (i.e., part or all of
223
the parcel), proposed land-use activity under PES, and individual participant
224
identification number. Using this identification number, we then searched on an open-
225
access governmental database with self-reported information on the primary revenue-
226
generating activity of individuals or organizations (henceforth, primary activity). Although
227
self-reported information can introduce bias into datasets, this problem should be
228
minimum in our study because the Federal Administration of Public Income requires
229
individuals to document their claims and monitors for accuracy.
230
Data Sources and Variables
We classified participants into one of seven categories. The first category
231
included governmental and other non-profit organizations that primarily manage land for
232
conservation (e.g., parks and reserves), rather than for commercial purposes, but also
233
manage other fiscal lands that may be leased to private individuals or companies for a
234
fee. The second category comprised indigenous and campesino (peasant) communities
235
that own a mix of revenue-generating lands (e.g., lands for agriculture and cattle
236
ranching) and forested land used for subsistence-level natural resource extraction. The
237
remaining landowners (individuals or companies) were divided into five categories
238
based in their primary economic activity as follows: row crop agriculture (hereafter
239
agriculture), cattle ranching, silviculture, legal/real estate, and other non-agricultural
240
businesses (https://seti.afip.gob.ar/padron-puc-constancia-
241
internet/ConsultaConstanciaAction.do, https://www.cuitonline.com). This database also
242
provided information on city of residence for each landowner. We defined absentee
243
landowners as participants with a PES project in a province different from the
244
landowners’ province of residence. For our final database, we discarded all projects
245
without information on the primary activity of participants and projects listed as
246
“formulation projects,” as these projects are one-year projects that are meant to lead to
247
longer contracts (final number of projects used = 762).
8
bioRxiv preprint first posted online Sep. 20, 2018; doi: http://dx.doi.org/10.1101/421933. The copyright holder for this preprint (which was not peer-reviewed) is the author/funder, who has granted bioRxiv a license to display the preprint in perpetuity. It is made available under a CC-BY-NC-ND 4.0 International license.
248
Then, we defined spatial and temporal adverse selection for program participants
249
based on contract length and agricultural suitability of enrolled properties. Spatial
250
adverse selection can increase as productivity of enrolled land decreases (Ferraro et
251
al., 2011). For analysis, we defined high spatial adverse selection as enrollment of land
252
in sites with less than median regional potential agricultural productivity, based on
253
enrolled and non-enrolled lands (Hi-SAS, Fig. 2). Sites in Chaco forest with low
254
productivity potential for agriculture are less likely to be deforested than high-
255
productivity sites (Grau et al., 2008; Fehlenberg et al., 2017) and thus, may be more
256
likely to remain forested in the absence of program interventions (Ferraro et al., 2011).
257
We obtained agricultural suitability for enrolled areas from a raster grid database of the
258
land-use suitability of the region for soybean and pasture for cattle (Fig. 1; data from the
259
National Institute of Agricultural Technology; see Supporting Information for details).
260
Temporal adverse selection is evidenced when threatened land is enrolled for
261
short time periods, thus, reducing funds for long-term contracts (Núñez-Regueiro et al.,
262
in review). We defined high temporal adverse selection as enrollment of land in PES for
263
less than the median regional enrollment length (Hi-TAS, Fig. 2). Considering the high
264
deforestation levels in Chaco and the long time-periods required for forest regrowth,
265
short-term contracts likely provide little protection and thus are unsuited to secure long-
266
term provision of environmental services (Grau et al. 2008, Lennox and Armsworth
267
2011, Drechsler et al. 2017, Fehlenberg et al., 2017; Núñez-Regueiro et al., in review).
268
The Argentine PES program allows participants to re-enroll (Garcia Collazo et al.,
269
2013). However, the degree to which participants will choose this option is unknown.
270
Because the program is fairly new (Forest Law passed in 2007; first participants
271
enrolled in 2010), insufficient data were available to include re-enrollment in our
272
analysis. If substantial re-enrollment occurs, temporal adverse selection could be lower
273
than reported in our study.
274
Depending on the agricultural production potential where a given PES project is
275
located and its contract length, a participant was categorized as only having high spatial
276
or high temporal adverse selection (Hi-SAS or Hi-TAS, respectively), both high spatial
277
and high temporal adverse selection (WORST), or low spatial and temporal adverse
9
bioRxiv preprint first posted online Sep. 20, 2018; doi: http://dx.doi.org/10.1101/421933. The copyright holder for this preprint (which was not peer-reviewed) is the author/funder, who has granted bioRxiv a license to display the preprint in perpetuity. It is made available under a CC-BY-NC-ND 4.0 International license.
278
selection (BEST). Avoiding both temporal and spatial adverse selection would require
279
enrolling land under high threat of conversion for long periods of time (Fig. 2).
280
281
2.4.
Data Analysis
282
To test our hypothesis and understand other factors that may contribute to spatial
283
and temporal enrollment patterns, we built a series of multinomial logistic regression
284
models (MLRM) with spatiotemporal adverse selection as a response variable with the
285
four categories (Hi-SAS, Hi-TAS, BEST, and WORST). To understand the relationship
286
between adverse selection and primary activity of participants, we used a categorical
287
predictor variable: levels one trough five corresponded to the five revenue-generating
288
activities listed above, level six to land management by governmental and non-
289
governmental organizations, and level seven to land management by peasant and
290
indigenous communities. To test competing hypotheses, we also included the following
291
predictor variables: absentee or local landowner (binary variable), size of land enrolled
292
(continuous numerical variable), and type of land-use plan enrolled (categorical variable
293
with four levels: conservation plan, restoration plan, silviculture and collection of non-
294
timber forest products, and silviculture and silvopastoral activities). The government
295
database did not separate silviculture from non-timber forest products and silvopastoral
296
activities or list ecotourism as a land use. The size of the land enrolled corresponds to
297
the size of the parcel or portion of parcel that was enrolled. For convenience we will
298
refer to this as parcel size. The total landholding size of landowners was not recorded in
299
the PES database, and thus is unknown. To reduce multicollinearity in our model set,
300
we tested for associations between variables and only included variables with no
301
statistical evidence of associations among potential predictors in the same model (see
302
Table 1 for list of models and Table S-1 for correlations among variables).
303
We ranked each model based on Akaike’s information criterion adjusted for finite
304
sample sizes (AICc). We considered models with the lowest AICc as the most
305
parsimonious. Modeling and data manipulation were done in program R (R version
306
3.4.2, R Development Core Team, 2008) with the package “nnet” for building MLRM
307
(Venables and Ripley, 2002), and package “MuMIn” for model selection (Barton, 2018).
308
With these models, we identified land-use plans, local versus absentee landownership,
10
bioRxiv preprint first posted online Sep. 20, 2018; doi: http://dx.doi.org/10.1101/421933. The copyright holder for this preprint (which was not peer-reviewed) is the author/funder, who has granted bioRxiv a license to display the preprint in perpetuity. It is made available under a CC-BY-NC-ND 4.0 International license.
309
and parcel size as important predictors of adverse selection. Determining contributions
310
of different types of landholders to adverse selection is important for targeted revision of
311
policy and program implementation. Therefore, post-hoc we examined the relationship
312
between primary activity of participants and 1) type of land-use plans they submitted, 2)
313
local versus absentee landownership, and 3) parcel size. Seventy-five percent of
314
program participants enrolled land smaller than 500 ha (median = 146 ha + SD =
315
9,439.9 ha); parcel sizes in the upper quartile ranged from 500-150,000 ha (median =
316
1,310 ha + SD = 18,564.5 ha). Therefore, we also tested whether the odds of adverse
317
selection differed between small and large parcels. We built a MLRM with
318
spatiotemporal adverse selection categories as response variables and a binary
319
predictor variable for parcels smaller or larger than 500 ha.
320 321
3. Results
322
323
Primary activity of participants was not the best predictor for adverse selection
324
(Table 1). Proposed land use under PES, whether participants were local or absentee
325
landowners, and the size of enrolled land were stronger predictors of spatial and
326
temporal enrollment patterns (Table 1, Fig. 2, Fig. 3), although these factors were
327
correlated with the primary activity of participants (Table S-1). On average, agricultural
328
suitability and contract length were lower for parcels with land-use plans for restoration
329
and conservation than land parcels with silviculture, non-timber forest products, and
330
silviculture plans, resulting in lower odds of adverse selection in landscapes subject to
331
resource use than in landscapes under restoration and conservation (Fig. 2, Table S-2).
332
For example, compared to land parcels with conservation plans, land parcels with
333
silviculture - silvopastoral land-use plans had 193% lower odds of incurring combined
334
temporal and spatial adverse selection (i.e., the WORST scenario of lands with low
335
agricultural potential enrolled for short periods of time), 252% lower odds of incurring
336
high temporal adverse selection, and 138% lower odds of experiencing high spatial
337
adverse selection. Similarly, parcels with land-use plans for silviculture or non-timber
338
forest products had 151% lower odds of incurring the WORST scenario, 133% lower
11
bioRxiv preprint first posted online Sep. 20, 2018; doi: http://dx.doi.org/10.1101/421933. The copyright holder for this preprint (which was not peer-reviewed) is the author/funder, who has granted bioRxiv a license to display the preprint in perpetuity. It is made available under a CC-BY-NC-ND 4.0 International license.
339
odds of incurring high temporal adverse selection, 76% lower odds of incurring high
340
spatial adverse selection than parcels with conservation plans (Fig. 3, Table S-2).
341
Governmental and non-governmental organizations (NGO) organizations and
342
indigenous and campesino communities enrolled a larger proportion of their projects,
343
and a greater total amount of land with conservation and restoration plans (Tables S-3
344
and S-7), as compared to participants who were directly engaged with production
345
activities or non-agricultural businesses (i.e., agriculture, ranching, silviculture, legal and
346
real estate firms, and non-agricultural business; Tables S-3 and S-7). However, the
347
number of conservation and restoration plans, as well as the total number of projects,
348
submitted by participants engaged in production activities and non-agriculture
349
businesses were much greater than the number submitted by governmental and NGO
350
organizations and indigenous and campesino communities (Table S-3). Thus, 71% of
351
the total conservation and restoration projects were submitted by participants that were
352
engaged in agricultural and cattle ranching activities (44%) or non-agricultural
353
businesses (27%, Table S-3). For all participants, lands enrolled with conservation and
354
restoration plans had lower agricultural potential and shorter enrollment times compared
355
to lands enrolled in production-oriented land-use plans (Tables S-4 and S-5).
356
,
Lands enrolled by absentee landowners had lower agricultural suitability than
357
land enrolled by local land owners, and contracts were shorter for absentee landowners
358
(Fig. 2). As a result, absentee landowners had 143% higher odds of incurring spatial
359
and temporal adverse selection, 51% higher odds of Hi-TAS, and 96% higher odds of
360
Hi-SAS than local landowners (Table S-2). Absentee versus local status of land owners
361
was correlated with their primary activity (Table S-1). All indigenous and campesino
362
communities were local landowners. The proportion of landowners dedicated to
363
silviculture and cattle ranching was greater for local than absentee landowners (Table
364
S-6). Landowners with a legal or a real-estate related practice were more common
365
among absentee landowners (Table S-6). Participants dedicated to agriculture,
366
businesses outside the agriculture industry, and governmental and NGO organizations
367
were evenly distributed among local and absentee landowners.
368
369
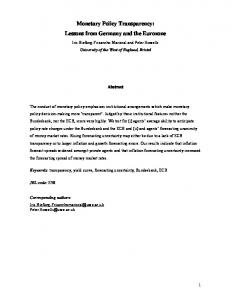
The probability of enrolling in BEST and Hi-TAS increased with decreasing size of parcel enrolled and the probability of enrolling in WORST and Hi-TAS increased with
12
bioRxiv preprint first posted online Sep. 20, 2018; doi: http://dx.doi.org/10.1101/421933. The copyright holder for this preprint (which was not peer-reviewed) is the author/funder, who has granted bioRxiv a license to display the preprint in perpetuity. It is made available under a CC-BY-NC-ND 4.0 International license.
370
increasing parcel size, although these relationships were not significant (Fig. 3, Table S-
371
2). However, parcels >500 ha had 155% higher odds of incurring both spatial and
372
temporal adverse selection (WORST), 116% higher odds of Hi-TAS, and 204% higher
373
odds of Hi-SAS, in comparison to land 500 ha were enrolled in areas under high threat of deforestation (i.e., areas
15
bioRxiv preprint first posted online Sep. 20, 2018; doi: http://dx.doi.org/10.1101/421933. The copyright holder for this preprint (which was not peer-reviewed) is the author/funder, who has granted bioRxiv a license to display the preprint in perpetuity. It is made available under a CC-BY-NC-ND 4.0 International license.
461
with high agricultural potential), compared to 90% of the smaller parcels enrolled in
462
these areas. If small patches of fragmented forests are disproportionately conserved
463
with PES, long-term species persistence, and the ecological services offered by these
464
species, will be hampered. This is especially true for wide-ranging wildlife species
465
dependent upon large expanses of habitat and dispersal-limited species that cannot
466
move across fragmented landscapes (Fahrig, 2003; Cushman, 2006; Quiroga et al.,
467
2016). Small fragments also consist primarily of edge habitat where altered
468
microclimate can induce high tree mortality and degrade the forest within the fragment,
469
resulting in further loss of forest and forest-dependent species over time (Laurance et.
470
al., 2011).
471
Enrollment of conservation and restoration plans in areas with low deforestation
472
pressure and for short time-periods challenges the long-term effectiveness of this PES
473
program. If government, indigenous people and local community lands have lower
474
agricultural potential than lands dedicated to agriculture, and thus lower potential for
475
deforestation, then spatial adverse selection is unavoidable if these lands are enrolled in
476
PES. At current payment levels and based only on looking at adverse selection, the
477
conservation value of investing PES funds in these lands may be questionable.
478
However, such funds could be key in supplementing small budgets for historically
479
marginalized communities and public land management. This is especially important in
480
cases like in our study area where most of the total land extension was submitted by
481
government and NGO entities and by campesinos and indigenous people (Table S-7).
482
Furthermore, if enrollment times could be increased, commitments to PES potentially
483
could help retain public ownership of lands during periods when government authorities
484
support sales of public land (Schmidt, 2012).
485
Enrolling lands with high opportunity costs for long periods of time in PES is
486
challenging, and few models exist for PES programs that address rapid expansion of
487
industrial-scale agriculture and prevent deforestation. Despite this, PES-induced forest
488
conservation has been observed in projects that aim to increase adoption of production
489
activities that provide for carbon sequestration and some benefits for biodiversity
490
conservation rather than adoption of stronger conservation practices with limited
491
potential for financial gains beyond direct payments (Wunder et al., 2008; Bohlen et al.,
16
bioRxiv preprint first posted online Sep. 20, 2018; doi: http://dx.doi.org/10.1101/421933. The copyright holder for this preprint (which was not peer-reviewed) is the author/funder, who has granted bioRxiv a license to display the preprint in perpetuity. It is made available under a CC-BY-NC-ND 4.0 International license.
492
2009; Zabel and Engel, 2010; Arriagada et al., 2012; Alix-Garcia et al., 2015, Pagiola et
493
al., 2016, Jayachandran et al., 2017). These two scenarios mirror land-use categories
494
under the Forest Law that allow for lower-impact economic activities like silviculture or
495
silvopasture, (e.g., yellow zone) and land-use categories that prohibit these practices
496
but encourage conservation and restoration projects (e.g., red zone) of the Argentine
497
PES. In a PES program in Mexico, the greatest additionality was found when land close
498
to park edges enrolled in PES (Sims and Alix-Garcia, 2017). Similarly, the greatest
499
additionality in the Argentine PES may occur where enrolled lands are in yellow zones
500
adjacent to protected areas or other lands in the red zone.
501
In the short term, PES in the Chaco may be most successful in enrolling private
502
lands with projects focused on land uses with earning potential (e.g., silviculture or
503
silvopasture) in areas with intermediate protection levels (i.e., yellow zones). These land
504
uses reduce opportunity costs and increase the chances that a given payment will
505
match or exceed minimum acceptable payment threshold for supplying environmental
506
services (Börner et al., 2017). In our study area, a larger proportion of land in the red
507
zone is public land (in comparison to other land-use zones), occurs on lands with low
508
agricultural suitability, and already has some form of protection. In contrast, most lands
509
in the yellow category are private landholdings with higher agricultural suitability.
510
Because regional land-use plans prohibit deforestation but allow limited production
511
activities in the yellow category, payments constitute incremental income above income
512
generated by low-intensity production activities (e.g., cattle ranching) rather than a
513
replacement for all income generated by conversion to large scale agriculture.
514
In the long term, PES projects with conservation and restoration plans, which
515
restrict production activities on private lands, should provide the best management
516
strategies to accomplish the goals of the Argentine PES. Private lands have high
517
potential for land conversion or degradation with production activities, and these land-
518
use plans offer considerably more protection than plans that allow production. For
519
example, a silvopasture approach called “Forest Management with Integrated Cattle
520
Ranching” (MBGI - Manejo de Bosques con Ganadería Integrada), which allows for tree
521
removal and planting of introduced grasses, is being promoted as a compatible strategy
522
for both biodiversity conservation and cattle ranching (FVS, 2016). MBGI is widely
17
bioRxiv preprint first posted online Sep. 20, 2018; doi: http://dx.doi.org/10.1101/421933. The copyright holder for this preprint (which was not peer-reviewed) is the author/funder, who has granted bioRxiv a license to display the preprint in perpetuity. It is made available under a CC-BY-NC-ND 4.0 International license.
523
supported across some government and non-government organizations, as well as by
524
private land-owners, and could be used in the largest stretches of remnant Chaco forest
525
(i.e., yellow and green zones). However, whether MBGI will meet the Forest Law’s
526
objectives of conserving biodiversity is unknown. Specialists have raised concerns
527
about potential negative effects on biodiversity such as increases in forest
528
fragmentation, reduction in the quantity and quality of wildlife habitat, and synergistic
529
increases in hunting pressure (FVS, 2016). These specialists also point out that
530
implementing corridors and promoting sustainable hunting practices could mitigate
531
some effects of silvopasture activities such as MBGI (FVS, 2016). However, the
532
success of such a mitigation strategy still will depend on having extensive forest blocks
533
to link with corridors, suitable habitat within corridors, and new strategies for managing
534
hunting. Increasing incentives for long term enrollment of threatened land under
535
conservation and restoration projects might be a more parsimonious strategy to meet
536
the program’s goals.
537
The degree to which economic development and conservation goals can be met
538
simultaneously with PES will depend on the compatibility of silvopasture practices, as
539
well as extraction of timber and non-timber forest products, with forest and biodiversity
540
conservation. Considerable effort has focused on development of management options
541
for sustainable use of humid and seasonally dry tropical forests that meet conservation
542
goals (Putz et al., 2008). However, much less is known about compatible management
543
for semiarid, subtropical forests such as Chaco (Trigo et al., 2017). The challenges are
544
significant, ranging from climate extremes that limit forest productivity and necessitate
545
long rotation cycles for ecologically sustainable harvest to severe ecosystem
546
degradation from decades of unmanaged grazing (Grau et al., 2008). Furthermore,
547
although the largest amount of land in the Chaco is in the yellow category slated for
548
sustainable use, some very critical pieces for long-term regional conservation, such as
549
forest corridors that link protected areas and safeguard riparian areas, occur on private
550
lands in the red category where use is restricted (Núñez-Regueiro pers. obs.). If PES
551
cannot engage these landowners in long term contracts that conserve these regions,
552
then the limits of PES need to be recognized and other strategies need to be identified
553
and implemented.
18
bioRxiv preprint first posted online Sep. 20, 2018; doi: http://dx.doi.org/10.1101/421933. The copyright holder for this preprint (which was not peer-reviewed) is the author/funder, who has granted bioRxiv a license to display the preprint in perpetuity. It is made available under a CC-BY-NC-ND 4.0 International license.
554 555
5. Conclusions
556
Maintaining native forests with low human intervention is critical for supporting
557
558
the world’s ecosystem services, however wild places continue to disappear (Potapov et
559
al., 2017). Developing strategies to encourage conservation and restoration projects
560
that avoid adverse selection under PES in forested areas is fundamental to the success
561
of these programs in addressing forest loss. Understanding predictors for spatial and
562
temporal enrollment patterns may help improve effectiveness of PES programs,
563
incentivize protection of forests, and address critical environmental challenges such as
564
deforestation and climate change (Ferraro, 2011; Alix-Garcia et al., 2015; Chazdon,
565
2017).
566
Under the current PES structure in Chaco, the most feasible means of achieving
567
enrollment for threaten lands is through land-use activities that simultaneously promote
568
sustainable forest use and conservation (e.g., silvopasture), as opposed to practices
569
that restrict land use to conservation or restoration alone, and by encouraging active
570
participation of local landowners. However, ecological impacts of land use on
571
biodiversity, as well as forest cover, need to be assessed to recommend land-use
572
practices under PES. Furthermore, although PES contracts for production-related land-
573
use plans were less likely to be adversely selected than conservation-oriented plans,
574
enrollment periods for all participants and land uses were short compared to the
575
timeframe needed for sustainable forest management and biodiversity conservation.
576
Providing bonus lump sum payments for long-term contracts or linking payments to
577
commodity prices could incentivize long-term contracts by counteracting decreasing
578
marginal benefit for landowners remaining in the program for long time-periods
579
(Juutinen et al., 2014). Additionally, offering the highest-tiered payment levels for
580
conservation and restoration lands in yellow and green zones could maximize the
581
program’s additionality by incentivizing land-use practices highly aligned with the
582
program’s goals in areas with high threat of land-use conversion.
583
584
Our results also indicate that large land parcels are least likely to achieve longterm enrollment in highly productive areas, which could accentuate already alarming
19
bioRxiv preprint first posted online Sep. 20, 2018; doi: http://dx.doi.org/10.1101/421933. The copyright holder for this preprint (which was not peer-reviewed) is the author/funder, who has granted bioRxiv a license to display the preprint in perpetuity. It is made available under a CC-BY-NC-ND 4.0 International license.
585
levels of habitat fragmentation and biodiversity loss (Núñez-Regueiro et al., 2015;
586
Quiroga et al., 2016). Thus, strategies need to be developed and implemented that
587
promote enrollment of large parcels of forest under high threat. One potential approach
588
is offering payments proportional to the land’s agricultural value. Spatial targeting of
589
PES also is fundamental to avoid spatial adverse selection and to increase the overall
590
size of contiguous protected forests through enrollment of adjacent land parcels and
591
parcels bordering protected areas. Finally, monitoring PES program’s performance
592
under an adaptive management framework, as well as identifying where conservation
593
objectives and the PES program are poorly matched from the outset, will be key for land
594
management that supports the goals of PES and for improving conservation outcomes
595
of PES (Sims et al., 2014; Alix Garcia et al., 2015).
596
597
20
bioRxiv preprint first posted online Sep. 20, 2018; doi: http://dx.doi.org/10.1101/421933. The copyright holder for this preprint (which was not peer-reviewed) is the author/funder, who has granted bioRxiv a license to display the preprint in perpetuity. It is made available under a CC-BY-NC-ND 4.0 International license.
Table 1. Multinomial logistic regression model comparison for spatiotemporal adverse selection. Predictors included in our models relate to our main hypothesis (i.e., primary activity of landholders) and alternative factors explaining spatiotemporal adverse selection [ i.e., 1), whether landowners are local or absentee, 2) parcel size, and 3) type of land use allowed at the site] and additive effects of these factors. Delta Model Hypothesis D.F logLik AICc AICc weight L.U. plan type + Local/Absentee 15 -927.59 1885.80 0.00 0.95 L.U. plan type + Local/Absentee + Size 18 -927.33 1891.60 5.76 0.05 L.U. plan type 12 -942.59 1909.60 23.79 0.00 L.U. plan type + Size 15 -942.18 1915.00 29.18 0.00 Primary activity 21 -958.96 1961.20 75.36 0.00 Primary activity + Size 24 -958.80 1967.20 81.41 0.00 Local/Absentee 6 -989.83 1991.80 105.96 0.00 Size + Local/Absentee 9 -988.84 1995.90 110.09 0.00 Null model 3 -1004.58 2015.20 129.38 0.00 Size 6 -1003.20 2018.50 132.69 0.00 Abbreviation codes: L.U. plan type = Land-use type (conservation, restoration, non-timber forest/silviculture, or silviculture/silvopasture) Local/Absentee. = Local or absentee landowner Size = Size of parcel enrolled in PES Primary activity = Primary economic activity (Government/nonprofit, campesinos or indigenous communities, row crop agriculture, cattle ranching, silviculture, real estate or other non-agricultural business). DF = Degrees of freedom logLik = Log-Likelihood AICc = Akaike Information Criterion corrected for finite sample sizes Delta AICc = difference in AICc between best model and each individual model Weight = model weight (Akaike weight)
21
bioRxiv preprint first posted online Sep. 20, 2018; doi: http://dx.doi.org/10.1101/421933. The copyright holder for this preprint (which was not peer-reviewed) is the author/funder, who has granted bioRxiv a license to display the preprint in perpetuity. It is made available under a CC-BY-NC-ND 4.0 International license.
Fig. 1. A. Study area comprised of the four provinces that contain most of the Chaco forest in Argentina and corresponding land-use zoning categories for this forest, ranging from high protection to low protection (red, yellow, and green). B. Agricultural suitability index for the study area. Highest suitabilities are presented with darker red colors.
22 2
bioRxiv preprint first posted online Sep. 20, 2018; doi: http://dx.doi.org/10.1101/421933. The copyright holder for this preprint (which was not peer-reviewed) is the author/funder, who has granted bioRxiv a license to display the preprint in perpetuity. It is made available under a CC-BY-NC-ND 4.0 International license.
n o i t c e l e s e s r e v d a l a r o p
Land use Hi-SAS
BEST
Absentee/Local
m e t g n i s a e r c n I
Project size (ha) WORST
Hi-TAS
Increasing spatial adverse selection
Fig. 2. Distribution of enrollment of land with different land-use plan types along axes of increasing temporal and spatial adverse selection. Vertical and horizontal lines represent median agricultural potential and median contract length, respectively. The four quadrats defined by these median values correspond to the four categories of spatiotemporal adverse selection used in our analysis: spatial and temporal selfselection (WORST), primarily high spatial adverse selection (Hi-SAS), primarily temporal adverse selection (Hi-TAS), and no adverse selection (BEST).
23
Fig. 3. Relationships between probabilities of incurring adverse selection under WORST, Hi-TAS, Hi-SAS, and BEST and project size for (A) different land-use plans under PES and (B) local or absentee landownsers.
24
bioRxiv preprint first posted online Sep. 20, 2018; doi: http://dx.doi.org/10.1101/421933. The copyright holder for this preprint (which was not peer-reviewed) is the author/funder, who has granted bioRxiv a license to display the preprint in perpetuity. It is made available under a CC-BY-NC-ND 4.0 International license.
Absentee/Local Land use
bioRxiv preprint first posted online Sep. 20, 2018; doi: http://dx.doi.org/10.1101/421933. The copyright holder for this preprint (which was not peer-reviewed) is the author/funder, who has granted bioRxiv a license to display the preprint in perpetuity. It is made available under a CC-BY-NC-ND 4.0 International license.
6.
Literature Cited
Aguilar S, Mastrangelo M, Garcia Collazo M (2018) ¿Cual es la situación de la Ley de Bosques en la region Chaqueña a diez años de su sanción? Revisar su pasado para discutir su futuro. Ecología Austral 28. et al.
,
Alix-Garcia J, Sims K, Yañez-Pagans P (2015) Only one tree from each seed? Environmental effectiveness and poverty alleviation in Mexico's payments for ecosystem services program. American Economic Journal: Economic Policy 7, 1-40. ,
Arriagada R, Ferraro P, Sills E, Pattanayak S, Cordero-Sancho S (2012) Do payments for environmental services affect forest cover? A farm-level evaluation from Costa Rica. Land Economics 88, 382-399. ,
Arriagada R, Sills E, Pattanayak S, Ferraro P (2009) Combining qualitative and quantitative methods to evaluate participation in Costa Rica's program of payments for environmental services. Journal of Sustainable Forestry 28, 343-367. ,
Barton K (2018) MuMIn: multi-model inference. R package version 1.40.0. pp Page. Bohlen P, Lynch S, Shabman L, Clark M, Shukla S, Swain H (2009) Paying for environmental services from agricultural lands: an example from the northern Everglades. Frontiers in Ecology and the Environment 7, 46-55. ,
Börner J, Baylis K, Corbera E, Ezzine-De-Blas D, Honey-Rosés J, Persson U, Wunder S (2017) The effectiveness of payments for environmental services. World Development 96, 359-374. ,
Camba Sans G, Aguiar S, Vallejos M, Paruelo J (2018) Assessing the effectiveness of a land zoning policy in the Dry Chaco. The case of Santiago del Estero, Argentina. Land Use Policy 70, 313-321. ,
Ceddia M, Zepharovich E (2017) Jevons paradox and the loss of natural habitat in the Argentinean Chaco: The impact of the indigenous communities’ land titling and the Forest Law in the province of Salta. Land Use Policy 69, 608-617. ,
Cushman S (2006) Effects of habitat loss and fragmentation on amphibians: A review and prospectus. Biological Conservation 128, 231-240. ,
De La Cadena M (2010) Indigenous cosmopolitics in the Andes: conceptual reflections beyond "politics". Cultural Anthropology 25, 334-370. ,
25
bioRxiv preprint first posted online Sep. 20, 2018; doi: http://dx.doi.org/10.1101/421933. The copyright holder for this preprint (which was not peer-reviewed) is the author/funder, who has granted bioRxiv a license to display the preprint in perpetuity. It is made available under a CC-BY-NC-ND 4.0 International license.
Drechsler M, Johst K, Watzold F (2017) The cost-effective length of contracts for payments to compensate land owners for biodiversity conservation measures. Biological Conservation 207, 72-79. ,
Duffy M (2009) Economies of size in production agriculture. Journal of Hunger & Environmental Nutrition 4, 375-392. ,
Engel S (2016) The devil in the detail: a practical guide on designing payments for environmental services. International Review of Environmental and Resource Economics 9, 46. ,
Ezzine-De-Blas D, Wunder S, Ruiz-Perez M, Moreno-Sanchez R (2016) Global patterns in the implementation of payments for environmental services. Plos One 11. ,
Fahrig L (2003) Effects of habitat fragmentation on biodiversity. Annual Review of Ecology Evolution and Systematics 34, 487-515. ,
Fehlenberg V, Baumann M, Gasparri N, Piquer-Rodriguez M, Gavier-Pizarro G, Kuemmerle T (2017) The role of soybean production as an underlying driver of deforestation in the South American Chaco. Global Environmental Change 45, 24-34. ,
Ferraro P (2008) Asymmetric information and contract design for payments for environmental services. Ecological Economics 65, 810-821. ,
Ferraro P (2011) The future of payments for environmental services. Conservation Biology 25, 1134-1138. ,
Fundación Vida Silvestre (2016) La fauna y los silvopastoriles del Chaco. (eds Aprile G, Periago M, Minarro F) pp Page, Buenos Aires. García Collazo M, Panizza A, Parcelo J (2013) Ordenamiento territorial de bosques nativos: resultados de la zonificación realizada por provincias del Norte argentino. Ecología Austral 23, 97-107. ,
Gasparri N, Grau H, Gutiérrez Angonese J (2013) Linkages between soybean and neotropical deforestation: Coupling and transient decoupling dynamics in a multidecadal analysis. Global Environmental Change 23, 1605-1614. ,
Grau H, Gasparri N, Aide T (2008) Balancing food production and nature conservation in the Neotropical dry forests of northern Argentina. Global Change Biology 14, 985997. ,
Hansen M, Potapov P, Moore R (2013) High-Resolution Global Maps of 21st-Century Forest Cover Change. Science 342, 850-853. et al.
,
26
bioRxiv preprint first posted online Sep. 20, 2018; doi: http://dx.doi.org/10.1101/421933. The copyright holder for this preprint (which was not peer-reviewed) is the author/funder, who has granted bioRxiv a license to display the preprint in perpetuity. It is made available under a CC-BY-NC-ND 4.0 International license.
Jayachandran S, De Laat J, Lambin E, Stanton C, Audy R, Thomas N (2017) Cash for carbon: a randomized trial of payments for ecosystem services to reduce deforestation. Science 357, 267. ,
Kareiva P, Watts S, Mcdonald R, Boucher T (2007) Domesticated nature: shaping landscapes and ecosystems for human welfare. Science 316, 1866-1869. ,
Korovkin T (1997) Indigenous peasant struggles and the capitalist modernization of agriculture - Chimborazo, 1964-1991. Latin American Perspectives 24, 25-49. ,
Kuemmerle T, Altrichter M, Baldi G Chaco. Science 355, 465-465.
et al.
(2017) Forest conservation: remember Gran
,
Laurance W, Camargo J, Luizao R (2011) The fate of Amazonian forest fragments: A 32-year investigation. Biological Conservation 144, 56-67. et al.
,
Le Polain De Waroux Y, Baumann M, Gasparri N (2017) Rents, Actors, and the Expansion of Commodity Frontiers in the Gran Chaco. Annals of the American Association of Geographers, 1-22. et al.
Lennox G, Armsworth P (2011) Suitability of short or long conservation contracts under ecological and socio-economic uncertainty. Ecological Modelling 222, 2856-2866. ,
Marinaro S, Grau R, Gasparri N, Kuemmerle T, Baumann M (2017) Differences in production, carbon stocks and biodiversity outcomes of land tenure regimes in the Argentine Dry Chaco. Environmental Research Letters 12, 045003. ,
Miranda M, Porras I, Moreno M (2003) The social impacts of payments for environmental services in Costa Rica. A quantitative field survey and analysis of the Virilla watershed. pp Page, London, International Institute for Environment and Development. Miteva D, Pattanayak S, Ferraro P (2012) Evaluation of biodiversity policy instruments: what works and what doesn’t? Oxford Review of Economic Policy 28, 69-92. ,
Murdoch W, Polasky S, Wilson K, Possingham H, Kareiva P, Shaw R (2007) Maximizing return on investment in conservation. Biological Conservation 139, 375-388. ,
Nolte C, Gobbi B, De Waroux Y, Piquer-Rodriguez M, Butsic V, Lambin E (2017a) Decentralized land use zoning reduces large-scale deforestation in a major agricultural frontier. Ecological Economics 136, 30-40. ,
Nolte C, Gobbi B, Le Polain De Waroux Y, Piquer-Rodríguez M, Butsic V, Lambin E (2018) Challenges in attributing avoided deforestation to policies and actors: lessons from provincial forest zoning in the Argentine Dry Chaco. Ecological Economics 150, 346-352. ,
27
bioRxiv preprint first posted online Sep. 20, 2018; doi: http://dx.doi.org/10.1101/421933. The copyright holder for this preprint (which was not peer-reviewed) is the author/funder, who has granted bioRxiv a license to display the preprint in perpetuity. It is made available under a CC-BY-NC-ND 4.0 International license.
Nolte C, Le Polain De Waroux Y, Munger J, Reis T, Lambin E (2017b) Conditions influencing the adoption of effective anti-deforestation policies in South America’s commodity frontiers. Global Environmental Change 43, 1-14. ,
Núñez -Regueiro M M, Branch L, Fletcher R, Maras G, Derlindati E, Talamo A (2015) Spatial patterns of mammal occurrence in forest strips surrounded by agricultural crops of the Chaco region, Argentina. Biological Conservation 187, 19-26. ,
Núñez-Regueiro M M (2016) On biofuels, biodiversity tradeoffs, and a market-based strategy to potentially reduce deforestation. Ph.D Dissertation, University of Florida, Gainesville, 125 pp. Pagiola S, Honey-Roses J, Freire-Gonzalez J (2016) Evaluation of the permanence of land use change induced by payments for environmental services in Quindio, Colombia. Plos One 11. ,
Petrzelka P, Ma Z, Malin S (2013) The elephant in the room: absentee landowner issues in conservation and land management. Land Use Policy 30, 157-166. ,
Putz F, Sist P, Fredericksen T, Dykstra D (2008) Reduced-impact logging: challenges and opportunities. Forest Ecology and Management 256, 1427-1433. ,
Quiroga V, Boaglio G, Noss A, Di Bitetti M (2014) Critical population status of the jaguar Panthera onca in the Argentine Chaco: camera-trap surveys suggest recent collapse and imminent regional extinction. Oryx 48, 141-148. ,
R Core Team (2008) R: A language and environment for statistical computing. R Foundation for Statistical Computing, Vienna, Austria. Roberts M, Lubowski R (2007) Enduring impacts of land retirement policies: evidence from the conservation reserve program. Land Economics 83, 516-538. ,
Robinson C, James G, Whitehead P (2016) Negotiating indigenous benefits from payment for ecosystem service (PES) schemes. Global Environmental Change 38, 21-29. ,
Salzman J, Bennett G, Carroll N, Goldstein A, Jenkins M (2018) The global status and trends of payments for ecosystem services. Nature Sustainability 1, 136-144. ,
Schmidt M (2012) Situación de la tierra en la provincia de Salta. Una aproximación al contexto previo al ordenamiento territorial de bosques nativos. Estudios Rurales; Vol 2, No 3. Schomers S, Matzdorf B (2013) Payments for ecosystem services: a review and comparison of developing and industrialized countries. Ecosystem Services 6, 16-30. ,
28
bioRxiv preprint first posted online Sep. 20, 2018; doi: http://dx.doi.org/10.1101/421933. The copyright holder for this preprint (which was not peer-reviewed) is the author/funder, who has granted bioRxiv a license to display the preprint in perpetuity. It is made available under a CC-BY-NC-ND 4.0 International license.
Silva R, Lapola D, Patricio G, Teixeira M, Pinho P, Priess J (2016) Operationalizing payments for ecosystem services in Brazil's sugarcane belt: How do stakeholder opinions match with successful cases in Latin America? Ecosystem Services 22, 128-138. ,
Sims K, Alix-Garcia J (2017) Parks versus PES: Evaluating direct and incentive-based land conservation in Mexico. Journal of Environmental Economics and Management 86, 8-28. ,
Sims K, Alix-Garcia J, Shapiro-Garza E (2014) Improving environmental and social targeting through adaptive management in Mexico's payments for hydrological services program. Conservation Biology 28, 1151-1159. et al.
,
Trigo C, Talamo A, Núñez-Regueiro M M, Derlindati E, Maras G, Barchuk A, Palavecino A (2017) A woody plant community and tree-cacti associations change with distance to a water source in a dry Chaco forest of Argentina. Rangeland Journal 39, 15-23. ,
Venables W, Ripley (2002) Modern applied statistics with S, New York, Springer. Volante J, Mosciaro M, Gavier-Pizarro G, Paruelo J (2016) Agricultural expansion in the Semiarid Chaco: poorly selective contagious advance. Land Use Policy 55, 154-165. ,
Volante J, Seghezzo L (2018) Can't see the forest for the trees: can declining deforestation trends in the Argentinian Chaco region be ascribed to efficient law enforcement? Ecological Economics 146, 408-413. ,
Wunder S, Brouwer R, Engel S, Ezzine-De-Blas D, Muradian R, Pascual U, Pinto R (2018) From principles to practice in paying for nature’s services. Nature Sustainability 1, 145-150. ,
Wunder S, Engel S, Pagiola S (2008) Taking stock: A comparative analysis of payments for environmental services programs in developed and developing countries. Ecological Economics 65, 834-852. ,
Zabel A, Engel S (2010) Performance payments A new strategy to conserve large carnivores in the tropics? Ecological Economics 70, 405-412. ,
29