Population Distribution, Surface Models, and Spatial Restructuring in Transitional Cities: A Study of Nanjing, China
Jun Luo Ph.D. Candidate Department of Geography University of Wisconsin at Milwaukee Milwaukee, WI 53201, U.S.A Tel: 1-414-229-5818 Email:
[email protected]
Yehua Dennis Wei Associate Professor Department of Geography & Urban Studies Program University of Wisconsin at Milwaukee Milwaukee, WI 53201, U.S.A Tel: 1-414- 229-3941 Email:
[email protected]
May 2005
Abstract Studying urban population and spatial structure using aggregate census data suffers from problems of spatial aggregation and temporal comparability, particularly for the rapidly changing cities of China. The recent development in GIS has potential to represent population distribution in a continuous field with grid cells using surface model techniques, which is a more accurate representation of population distribution. This paper attempts to better model and analyze population distribution in Chinese cities, using Nanjing as a case. With the aids of the detailed urban land use and building distribution data, we develop an alternative method to generate population surface, and uncover spatial variations of population distribution in Nanjing. We found that despite suburbanization, Nanjing remains a compact city, and population density declines quickly with the increase of the distance to the CBD. We also use exploratory spatial data analysis to investigate spatial associations between non-residential land uses and population density, and have found significant influence of commercial activities on population distribution. Industrial suburbanization, however, does not have significant effects on population suburbanization.
Key words: population density; surface model; land use; Nanjing, China
1. Introduction Studying urban population distribution is essential to the understanding of urban spatial structure and the formation of government policies (Ingram, 1998). Census data is the most often used, which is reported aggregately based on areal units, such as census tracts in the U.S., census enumeration districts in the U.K. and subdistricts in China. Based on the aggregate census data, scholars have used population density functions, either monocentric or polycentric models, to analyze urban population distribution (Baumont et al., 2004; Clark, 1951; McMillen and McDonald, 1998; Small and Song, 1994). Orthodox density functions use the distance from city centers or subcenters as the independent variable to model urban population distribution, and stress the distance decay of population density, which usually takes negative exponential forms. With economic restructuring and urban change, researchers and policy makers have been facing the challenge of how to represent “real world” population distribution as accurate as possible (Bracken, 1993; Langford et al., 1991; Martin and Higgs, 1997). Aggregate census data suffers from various analytical problems. First, due to the arbitrary boundary delineating of areal unit, results vary with modifying the boundaries and/or scale of data aggregation (the “modifiable areal unit problem” or MAUP) (Fotheringham and Wong, 1991; Openshaw, 1983). Second, population distribution is usually displayed homogenously in a census unit, which masks spatial heterogeneity of population distribution and therefore to some extent mis-represents urban population. Thirdly, census unit boundaries often do not coincide with varied forms of urban spaces and units, such as school districts, communities, and land use patterns, which makes data integration and temporal comparison problematic, intensified by changing census boundaries. Last, density functions based on census areal units are less capable of capturing directional and local variations due to problems of aggregation and limited census unit samples.
1
Moreover, Non-residential land use has significant impact on urban population distribution (Ingram, 1998), and an analysis of land use and population density can improve the understanding of urban spatial structure, which, however, is challenging because of the difficulty to integrate aggregate census data with disaggregate land-use data. The development of GIS has enabled researchers to represent population distribution using surface model techniques to minimize the aforementioned problems. In contrast to the discrete census unit-based population distribution, surface models depict population distribution in a continuous field with grid cells, which is a more detailed and accurate representation of population distribution and can incorporate disaggregate land-use data. Moreover, population surfaces can be used in research on population distribution and urban structure. Martin (1998), for example, used population surface to develop a method of automatically identifying featured neighborhoods in Southampton of the U.K. In short, disaggregated population surface models provide not only a more detailed and accurate representation of population distribution, but also a better platform to study population distribution and land use because disaggregate land-use data can be incorporated into population surface. The key to generate population surface models is how to disaggregate population data into grid cells. Bracken and Martin (1989) used inverse distance weighted (IDW) method, a point interpolation technique, to develop population surface for census enumeration districts in the U.K; they first assigned population counts to district centroids, and then interpolate empty cells by moving windows in which population of an empty cell is the weighted sum of all the centroids included in the window with closer centroids having greater “weight” value and vice versa. This approach, however, is over-simplified, and its accuracy needs to be improved. Meanwhile, the advance of remote sensing has stimulated the interests of researchers to use
2
ancillary data such as land use data extracted from satellite imagery to interpolate original areal population counts to surface cells (Eicher and Brewer, 2001; Langford et al., 1991), which is generally called dasymetric mapping, an areal interpolation technique. For example, Langford and Unwin (1994) classified satellite imagery data to binary residential and non-residential landuse raster and assigning population into each areal unit evenly, and Mennis (2003) used a similar framework to develop population surface model for southeast Pennsylvania with special reference to relative difference of population distribution among census blocks and among different urbanization-based land-uses. This approach, however, also has limitations, because of mis-classification of land use/cover, and low accuracy of population estimation. China has been undergoing rapid growth and transition from state socialism since the reform of 1978, earmarked by gradualism, partial reform, and unevenness. Chinese cities, as centers of transition, have been transformed from socialist cities to post-socialist transitional cities characterized by transitional institutions, hybrid economies, and fragmented spaces (Lin and Wei, 2002; Ma, 2002; Wei and Leung, 2005; Wong et al., 2003). Unprecedented urban growth is accompanied by urban spatial restructuring with emerging CBD, globalizing development zones, suburbanization, and fragmented residential spaces. Scholars have argued that Chinese cities are experiencing drastic growth (Wei and Li, 2002) and suburbanization, with declining or stagnant population growth in urban core areas (Zhou and Ma, 2000), that development zones are frontiers of globalization (Wei and Leung, 2005), and that a polycentric urban development model has emerged in urban China (Wu, 1998). Population distribution is essential to the study of urban demographic transition and urban spatial structure in China. Subdistrict (jie dao or zhen), the finest geographical scale at which the census population data is available, has been used to study urban population
3
distribution and density. Wang and Zhou (1999) set up population density functions for Beijing for 1982 and 1990 respectively to depict population density change with the distance to the city center, regarding population distribution within subdistricts as homogenous, so did Wang and Meng’s (1999) study on Shengyang. These studies have improved our understanding of urban population distribution in Chinese cities, but due to aforementioned problems with census units, the heterogeneous population distribution in subdistricts need to be unmasked. The chaotic gradualism, drastic urbanization, and fragmented urban spaces have also prompted the efforts of the Chinese government to better plan and manage Chinese cities, which often need detailed and accurate population data at finer scales. Through a study of Nanjing, this paper represents the recent efforts to enhance the representation and analysis of population distribution and urban spaces in Chinese cities. With the aids of GIS (ArcGISTM, GeodaTM, and GIS programming) and land-parcel and building distribution data, we will develop an alternative method to generate intraurban population surface model of the 2000 census population, and use exploratory spatial data analysis (ESDA) to investigate spatial associations between non-residential land uses and population distribution. To generate population surface, we use the relative differences of residential building floor areas to disaggregate subdistrict population to residential land parcels. Through a customized spatial overlay operation, we assign population of residential parcels into a vector grid of 100×100 meter cell size, which is then converted to a raster grid with the same cell size. This approach can improve the accuracy of census population disaggregation, minimize the modifiable areal unit problem, and provide detailed population data. Based on the generated population surface, we further analyze the characteristics of population distribution and spatial associations of land use and population distribution using ESDA, which can help us to uncover the extent of
4
suburbanization and the salient features of population and spatial structure in Chinese cities. Such a detailed study of urban population distribution and spatial structure in Chinese cities has rarely been conducted previously due to data and methodological constraints, especially the lack of land-parcel and building distribution data.
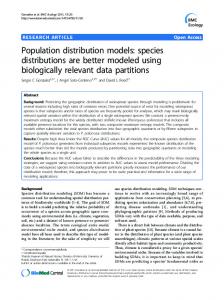
2. Research Setting and Data Issues The paper investigates urban population distribution in Nanjing, an ancient capital city of China and the capital of Jiangsu province. Located in the Shanghai-centered Yangtze Delta (Figure 1), Nanjing represents fast growing large coastal cities of China. The study area covers most of the continuous built-up area in the city, including 57 subdistricts or parts of them, and had an area of 312.37 square kilometers, and a population of 3,191,798 in 2000. The central city area or the urban core of Nanjing is within the old city wall where residential parcels are more densely distributed (Figure 1). (Figure 1 about here) The Bureau of Land Resources in Nanjing has set up a land management information system which stores detailed land parcel and building data in the city. After excluding some confidential land user attributes information, the research mainly uses three datasets of Nanjing in 2000: urban land-use parcel data, building distribution data, and census data at the subdistrict level used as the original population data source. Together these three datasets provide us the valuable data required for this study. While census data has been made available to researchers, Chinese cities rarely provide detailed urban land-use parcel and building distribution data, since few collect those data. Nanjing, however, is a national pilot city in developing digital land use and building databases, which has made this research possible. Building distribution data with
5
story type attributes covers most of the continuous built-up area of the city, the focus area of the paper. Figure 1 shows the study area with the residential land parcels, which cover all the residential buildings studied. The original land parcel, spatial boundaries of census subdistricts and building distribution data are in CAD format, and in polygon geometric shape, which have to be processed to generate population surface. In the original building distribution data, there is an attribute field indicating three types of building based on the number of stories: less than 2 stories, 2-10 stories and above 10 stories, coded as 1, 2 and 3 respectively in the database. After converting them into ESRI GeodatabaseTM, we reclassify the original more than 30 land-use types into 8 land-use types and extract all the residential land-use parcels to create a new residential land-use parcel feature class. We calculate the relative floor area for each building, by multiplying the building polygon area with building story type. All the buildings located in residential land parcels are extracted into a new residential building feature class. We conduct a set of spatial queries and field summary operations to add two new attributes to residential land parcel feature class: subdistrict population and residential building floor area where the residential land parcel is located, with the addition of the third new field to indicate residential building floor area in each residential land parcel. These three new fields will be used to assign subdistrict population to residential land parcel in following section to generate population surface.
6
3. Urban Population Distribution and Surface Models In this study, we estimate population of each residential land parcel based on its total relative building floor area, which is used to decide the proportions of subdistrict population assigned to residential land parcels. The process for generating raster population surface is illustrated in Figure 2. The following equation represents the calculation scheme for assigning population counts to individual residential land parcel: ParcelPopij =
SubPop j × PFLAreai SubPFLArea j
(1)
in which ParcelPopij is the population of residential land parcel i in subdistrict j; SubPop j is the total population of subdistrict j; PFLAreai is the building floor area of residential land parcel i; SubPFLArea j is the total building floor area of all residential land parcels in subdistrict j.
PFLAreai is the proportion of the building floor area of a residential land parcel to the total SubPFLArea j building floor area of all residential land parcels in the subdistrict.
(Figure 2 about here) The above calculations disaggregate subdistrict population to residential land parcels based on their proportions of residential building floor area in the total residential building floor area of the subdistrict. To generate a continuous population surface based on the residential land parcels with population counts assigned, we first create a vector grid feature class, which covers the whole study area with 68,688 100×100m cells. Mennis (2003) used 100m-resoultion based on remote sensing land-use data to generate raster population surface in city of Philadelphia, which, however, can only partly capture spatial variation of intraurban population because of the oversimplified classification of land-use data
7
(i.e., high-density urban, low-density urban, and nonurban areas). Our approach is built upon more detailed residential building floor areas and is not limited to the resolution of satellite imagery. It is more flexible and we can choose the resolution of the vector grid optionally. For comparison, we also choose 100×100m cell size to demonstrate that population surface generated by our approach can more effectively capture the spatial variations of intraurban population density. We’ve conducted a customized spatial overlay operation in ArcGISTM environment to proportionally assign population counts of residential land parcels to each cell of the vector grid, following the widely adopted approach that the proportion of population counts of a parcel is determined by the proportion of the area of a parcel intersected with a cell. The customized spatial overlay is coded with Visual Basic of Application (VBA) embedded in ArcGISTM. More specifically, cell population is calculated using the following formula: n
CellPopi = ∑ ( ParcelPop j × % PInCell ji )
(2)
j =1
where CellPopi is the population assigned to cell i; ParcelPop j is the population of parcel j intersected with cell i; % PInCell ji is the area percentage of parcel j within cell i. After this operation, each vector grid cell has a population counts attribute. The vector grid is then converted to a 100×100m resolution raster grid with the same number of cells, which represents the population surface for Nanjing. Using the original census data, Figure 3 presents population density distribution by subdistrict, and Table 1 provides the summary statistics of the subdistricts, with most of the subdistricts falling totally within the study area. Figure 3, a general map of population distribution in Nanjing, shows high-density districts in the central city within the old city wall.
8
The homogenous population distribution within subdistricts as shown by the subdistrict map (Figure 3), however, masks the real distribution of urban population, which is heterogeneous and unevenly distributed, especially within suburban subdistricts. From Figure 3, we cannot observe any nodes of population distribution in the suburban areas in the south of Yangtze River, which, as we will show in the next sections, is misleading. (Figure 3 and Table 1 about here) With our disaggregated population data, Figure 4 shows the raster population surface of Nanjing with 100m resolutions. It can be clearly observed that the raster population surface provides more detailed information than the vector-based population density representation by subdistrict shown in Figure 3. Moreover, Figure 4 shows more “natural” and realistic distribution of urban population, with uneven distribution of suburban population and less drastic changes at the subdistrict boundaries. (Figure 4 about here) The uneven distribution of urban population within subdistricts can be further illustrated by surface models of individual subdistricts. Figure 5 compares the representation of population in the CBD by raster surface with the representation by vector-based subdistricts. Coefficient of variance (CV) of population density by subdistricts was only 0.3 ranging from 178 persons/10,000m2 to 573 persons/10,000m2, while the CV was 0.89 by raster population surface ranging from 0 person/10,000m2 to 1577 persons/10,000m2. In contrast to the homogenous population distribution by vector representation within individual subdistrict, the raster population surface reveals high heterogeneity of population in the CBD, as revealed by the map and the high CV value. More significantly, population raster surface can expose the more dispersed and uneven population distribution in suburban areas, as evidenced in Figure 6, which
9
compares raster representation of population with vector representation by subdistricts in a southeastern suburban town (Honghua Town). The vector map on the left treats the whole town with the same population density (41 persons/10,000m2) and a CV of 0, but the raster map on the right reveals substantial spatial variation, with population density ranging from zero to 729 persons/10,000m2 and a high CV of 2.64. (Figures 5 and 6 about here)
4. Urban Population Density and Spatial Structure The generated population surface provides us a valuable platform for studying urban population distribution in Nanjing. From the raster population surface (Figure 4), we can see that in general, population density declines from the central city to suburban areas. Though Chinese cities including Nanjing have been experiencing population suburbanization (Feng and Zhou, 2003; Zhou and Ma, 2000) since the mid-1980s, the central city of Nanjing is still characterized by high-density population distribution. Extreme values of population density (1,000-1577 persons/10,000m2) mainly occurred in the surrounding areas of CBD and the northwest of the CBD. These findings suggest Chinese cities like Nanjing remain highly centralized, with limited level of suburbanization. One of the distinguished properties of raster population surface is that it can provide an effective visualization of population density from statistical density functions of spatial distributions (Bracken, 1993). Based on the generated population surface, we further conduct a neighborhood statistic to calculate mean population density in a circle with 800 meter radius centered at each cell’s centroid to uncover agglomeration and dispersion effects of population distribution. From the results of the operation (Figure 7), we can see that in Nanjing, population
10
density exhibited a concentric structure with two centers: one in the surrounding area of the CBD, and the other in central city northwest. The core area of the CBD, with advanced service functions, had relatively lower population density, immediately surrounded by areas with very high population density. This contrasts somewhat with cities in the West where CBDs tend to have low population density, with a slow rise and then decline of population density towards suburban areas. The other population center is actually the economic subcenter of Nanjing, i.e. the area along Shanxi and Hunan roads in the northwest. Since this center functions mainly as residential clusters, the core area of this center did not show patterns of lower-higher population density as found in the CBD. This also contrasts sharply with Western cities where metropolitan subcenters also tend to have low population density. (Figure 7 about here) To uncover population distribution with distance to the city center and based on the neighborhood statistic population surface, we select six directions starting from the CBD (see Figure 7). In each direction, we extract population density values in every other 200m from the population surface. Changing population density with the increasing distance from the CBD is shown in Figure 8. In general, population density declined with distance from the CBD, with some fluctuations due to neighborhood characteristics and the distribution of satellite towns in the suburban areas. We have found that population density often drops substantially in 1-3 km from the city center, except for the northwest direction with dense population distribution, indicating the compact nature of Chinese cities. (Figure 8 about here) In the direction of the northeast (Figure 8a), after a sudden drop of population density in the Xuanwu Lake, population density reached another peak in Maigaoqiao area due to the
11
development of a suburban industrial cluster with more than one hundred plants in electronics, automobile, and machinery, initially developed during Mao’s era. Population density also rose slightly at the far end of this direction where several petrochemical plants are located. Figures 8b and 8d show similar patterns: population density reached peak values within 2 km from the city center, and then declined quickly. They rebounded in inner suburban areas in Xiaolingwei (with education facilities) and Xinglong (another industrial/residential area) respectively, and then dropped quickly again, with few people living beyond 8 km to the city center. In the direction of the southeast and the west (Figures 8c and 8e), population density declined constantly, without significant population subcenters in the suburban areas. Figure 8f shows high population density and slower decline in the northwestern direction because these are old urban neighborhoods where subcenters of economy and population of Nanjing are located. Both Figures 7 and 8 show the uneven distribution of population in the suburban areas, with several nodes of population distribution, which are masked by the orthodox vector representation in Figure 3. Population surface also provides a better data source than census areal-units for studying density functions. One of the problems associated with census areal unit-based density function is non-random samples, which means there are more observations near the center than those near the periphery (Wang and Zhou, 1999). Samples from population surface, however, can avoid such a problem. Using the extracted population density values along the six directions and nonlinear regressions, we test the most commonly used exponential functions, in the form of Dr=a*exp(b*r), in which Dr is the population density, r is distance from CBD center, which, according to Wang and Zhou (1999), fits the Chinese cities the best. For the direction A, we exclude the part with no population over Xuanwu Lake. As shown in the regression results
12
(Table 2), exponential functions fit very well in the directions of A, B, C, D and E, with very high R2 values. In the direction F, R2 and b values are relatively low, because of slow decline of population density due to the economic subcenter. We also test the same exponential function with original subdistrict census data (Table 2). In contrast to the population surface-based density function, the subdistrict-based density function presents a much lower R2 value (0.421) and poor model fitness, which is attributable to the poor samples from subdistrict-based population distribution and further proves the advantages of population surface. (Table 2 about here)
5. Spatial Effects of Non-residential Land Use on Population Distribution The above section uses the generated population surface to reveal general spatial patterns of urban population distribution in Nanjing, and in this section, we investigate how population distribution varies with the change of urban land uses. We use the population surface to analyze spatial associations between land use and population density with exploratory spatial data analysis. Traditionally, researchers set up density functions based on monocentric or polycentric models to depict the change of population density with the distance from the CBD or economic subcenters. More recently, Cuthbert and Anderson (2002) used bivariate K-function to examine the spatial association of residential and commercial land use patterns and expose the change of urban form in the Halifax-Dartmouth region. The generated population surface and land-use parcel data allow us to explore spatial associations of non-residential land use and population distribution. Three types of nonresidential urban land use, which dominate urban spaces, are taken into account: commercial & managerial, road, and industrial land uses. Since the cell size of the original population surface
13
(100×100m) is too small to aggregate the land-use information, we increase the cell size of population surface to 500×500m, so that we can capture both population and land-use variations more effectively. After performing the same procedure as described in Figure 2 to generate a population surface with 500×500m cell size, we assign land-use information to each cell of the population surface through the customized spatial overlay operation same as those used in generating population surface. For commercial & managerial land-use, instead of using parcel area, we use building floor area of each parcel obtained with several spatial and field operations, since it is more appropriate to represent the commercial & managerial land-use intensity with building floor area than with parcel area. We perform the spatial overlay between commercial & managerial land-use feature class and 500×500m population surface, so each cell of the population surface has an attribute of commercial & managerial building floor area. For industrial land use the same procedure is performed to assign industrial building floor area to each population cell. For road land use, it is reasonable to only assign the area to each cell. After all the necessary operations, each cell of the population surface has both population attribute and three land-use attributes indicated by building floor area or area. To detect the potential spatial autocorrelations among population density and nonresidential land-use activities, we calculate a set of bivariate global Moran’s I for each pair of three land-use variables and population density. The bivariate global Moran’s I used in the study takes the following form:
I lp =
n
n
i
j
n∑∑ wij zil z jp n
n
i
j
(n − 1)∑∑ wij
14
(3)
where I lp is the bivariate of land-use type l and population density; zil is the standardized value of land-use variable and z jp is the standardized value of population in neighborhood cells; wij is the spatial weight measure from row-standardized spatial weights matrix. The results show that the bivariate global Moran’s I of commerce & management– population, road-population and industry-population are 0.4740, 0.5456 and 0.0404 respectively (all values are significant at 5% level using permutation approach for inference with 999 permutations). This suggests that non-residential land uses, from the global view, had significant positive spatial autocorrelations with population density. Commerce & management had the strongest spatial correlation with population density, followed by road and industrial land uses, while industrial land use had pretty lower influence on population distribution. As urban land use has apparent spatial variations, we are more concerned about how different local land-use activities influence population distribution. To uncover the influence of local spatial variations of land use on population distribution, we use Moran scatterplots and Local Indicators of Spatial Association (LISA)(Anselin, 1995). We plot the spatial lag WZ p of population against land-use variables, and use the four quadrants of the scatterplot to identify four types of spatial relationships between land use and population distribution: High-High, Low-Low, High-Low, and Low-High. For example, High-High means a cell with high land-use intensity is surrounded by cells with high population density. The positive High-High and LowLow spatial autocorrelation indicate a spatial clustering of similar values (high land-use intensity surrounded by high population density and vice versa) and the negative High-Low and LowHigh indicate a spatial clustering of dissimilar values. Furthermore, LISA statistics are used to assess the significance of such spatial associations. The local bivariate Moran’s I used in the research takes the following form:
15
I =z lp i
l i
n
∑w z j ≠i
ij
p j
(4)
where zil is standardized value of land-use variable of cell at location i, z jp is the standardized population density value at surrounding cells and wij is the spatial weight measure from the rowstandardized spatial weights matrix. Inference for the bivariate local Moran’s I uses a conditional permutation approach with 999 permutations. The approach requires that zil of land-use value at location i is held fixed, while z jp of population density values are randomly permutated at all other locations. The p-values of bivariate local Moran’s I statistic are then pseudo-significance levels (Anselin, 1995). Figures 9-11 show the spatial distributions of the four types of spatial associations between land use and population density and their significance maps of bivariate local Moran’s I. It’s evident that the spatial associations of the three non-residential land-uses with population distribution vary greatly in Nanjing. The positive High-High and Low-Low spatial association between commercial & managerial land use and population distribution accounted for 19% and 58% of the total cells in the population surface respectively (Figure 9). Almost all the cells in the central city area are characterized by the High-High spatial association between commercial & managerial land-use and population distribution. Moreover, most of the cells with High-High spatial association are significant referred to local Moran’s I. These findings confirm that the extent of suburbanization remains limited in Nanjing (or the Chinese cities in general), and city centers remain densely populations, with intense commercial and managerial land use patterns. (Figure 9-11 about here)
16
In the last decade, central cities in China have been undergoing massive redevelopment, with the construction of high-rise office buildings and commercial spaces stimulated by economic reforms and globalization, which has forced the relocation of some central city residents to suburban areas. Moreover, new migrants also find home in less expensive suburban areas. The process of suburbanization and urbanization, however, has been poorly managed, and the development of commerce and service activities in those areas has been lagging behind. Consequently, while commercial & managerial land use and population were both highly clustered in the central city area, cells of Low-High spatial associations are mainly located in the inner suburb area close to the central city. Figure 12 shows the general picture of population change at the subdistrict level from1990 to 2000. We can see that population of the central city increased slowly in general and several subdistricts lost population. Population of inner suburban subdistricts increased substantially, especially in some west, southeast and northeast subdistricts. Population of outer suburban subdistricts, however, increased slowly compared with inner suburban subdistricts. Table 3 presents the population change of subdistricts in central city, inner suburb and outer suburb from 1982 to 2000. Population of central city subdistricts accounted for 53.06% of the total population in the study area in 1982, which decreased to 49.61% and 40.09% in 1990 and 2000 respectively. The share of population in inner suburban subdistricts, however, increased from 22.93% to 37.01% from 1982 to 2000, while that of outer suburban subdistricts declined slightly from 24.01% to 22.90%. It is evident that population decentralization has been concentrated in the inner suburb. (Figure 12 and Table 3 about here)
17
Furthermore, through the revealed spatial association between commercial & managerial land use and population distribution, we find that population decentralization in Nanjing has a limited spatial extent, since almost all the Low-High cells are located within 2-3 kilometers from the CBD. Such compact patterns reflect urban planning control in Nanjing, and the widely use of bicycles as the main mode of transportation. Cells with Low-Low spatial association are mostly found in outer suburban area which remained sparsely developed, and north of the Yangtze River which for years has served as a physical barrier to block the northern, northwestern, and western expansion of Nanjing across the river. Regarding the significance of the spatial associations, large portions of High-High and Low-Low cells are significant, while much fewer Low-High and High-Low cells are significant. This implies that the two positive spatial associations of commercial & managerial land-use and population distribution have crucial impacts on the urban spatial structure. The analysis of global Moran’s I suggests that industrial land use was less influential on overall population distribution. As shown in Figure 10, industrial suburbanization is significant in Nanjing where most of the industrial land uses were located in the outer suburban area, which, however, has not affected population suburbanization substantially. As to the significance of the spatial associations, most of the High-High cells and Low-High cells in the central city were significant. Most of the positive spatial associations between industrial land use and population distribution were located in suburban areas and fringe of the central city. The High-High spatial association, only accounting 13% of the total cells, was found in the fringe of central city and suburban areas close to central city. These areas are where most of the current industries in Nanjing area located, with workers living in the central city or nearby areas. The Low-Low spatial association accounted for 46% of the total cells, and was mainly found in the outer
18
suburban area, indicating the outer suburban area of Nanjing remained sparsely populated, with limited industrial development. The negative Low-High spatial association was mainly found in the central city area. Under the influence of socialist ideology, Chinese cities during Mao’s era went through a drastic industrialization process to transform capitalist consuming cities to socialist productive cities, and many factories were built in central city and suburban areas. With economic reforms and the introduction of land markets, many state-owned industrial enterprises were shut down, privatized, or relocated to suburban areas (Wei and Li, 2002). Consequently, central cities, including Nanjing, have few industries left, which led to the pattern of low industrial land use and high population density in the central city found in this paper. On the other hand, High-Low spatial association was mainly found in some major outer suburban industrial clusters. Most of these areas were developed during Mao’s era as suburban industrial centers with free land provided by the state and extensive land use patterns, such as the cluster of large petrochemical plants in the northeast of city. Moreover, with limited development in services such as schools and health care, some workers working in these industrial centers commute to work and prefer living in the central city or inner suburban areas. Population density in these outer suburban areas tends to be lower than industrial centers in the inner suburban areas. In summary, local analyses suggest that industrial suburbanization has facilitated land-use restructuring in the central city area, but was not the main force underlying population decentralization, which has occurred mainly in the inner suburban area. The spatial association between road land use and population distribution exhibited a pattern similar to that between commercial & managerial and population distribution (Figure 11). Most of the cells with significant spatial associations were positive, which suggest road land use
19
generally had a strong positive influence on population distribution. The central city area had dense road and population distribution, while cells with Low-High spatial association were found in the eastern and northern fringe of the central city area. The inner suburb in the north, south and east of the central city area still had insufficient roads though we can find dense population clusters in these areas. This again suggests that the inner suburban areas, despite with increasing population in recent years, lag behind in the development of services, including roads and infrastructure. Not surprisingly, low-density road and population distribution were found in the remote suburb areas, which remain largely rural in nature.
6. Conclusion
Spatial restructuring of the post-socialist Chinese transitional cities has become a focus of recent academic inquiry on urban China. This paper investigates spatial structure of transitional Chinese cities through the len of urban population distribution using census data and the recent developments in GIS. Previous studies have used census population at subdistrict levels, which, however, has masked the heterogeneous nature of population distribution and exaggerates the boundary effects known as the modifiable areal unit problem. In contrast to the orthodox aggregate urban population studies, this paper has developed an alternative analytical framework to investigate urban population distribution and spatial structure through a flexible scheme of generating population surface, using Nanjing, China as a case. It has further integrated population surface modeling and exploratory spatial data analysis to uncover the salient features of urban population distribution and the effects of urban land uses. We have first presented a new method for generating raster population surface with aids of detailed urban land parcel and building distribution data, which improves the redistribution of
20
aggregate population into a continuous raster surface. The generated population surface provides a more accurate scenario of urban population distribution in Nanjing, and minimizes the problems of modifiable areal unit, the arbitrary boundary, and the mis-representation of heterogeneous urban population. The population surface maps have shown that Chinese cities such as Nanjing still have high-density population distribution in central city areas, and population density in general drops quickly with the increase of the distance to the city center, with occasional rebounds in certain suburban industrial centers. The effects of suburbanization on the overall population distribution remain limited, although nodes of population distribution can be identified in the suburban areas. To better understand population distribution, we have further investigated spatial associations between land use and population distribution at a finer scale. We firstly assign nonresidential land-use intensity information to population surface cells, making the population surface a multivariate operational grid, and then use exploratory spatial data analysis to analyze spatial associations between land use and population distribution. We have found that commercial & managerial land use had the strongest influence on population distribution, generally with positive, unevenly distributed spatial associations. Population suburbanization has been limited to the inner suburb area where population is densely distributed without substantial commercial & managerial land developments. Industrial land use overall had the weakest influence on population distribution. Industrial suburbanization is changing the land-use structure of the central city, but suburban industrial clusters did not have a significant effect on population suburbanization. The road land use had similar influence on population distribution as commerce & management land use, but differed in terms of local variations in some parts of Nanjing.
21
Despite heavy concentration of population in the central city and relatively limited impact of suburbanization, Nanjing still represents post-socialist Chinese cities which are experiencing urban outward expansion and suburbanization. This is especially striking if compared with the city during Mao’s era when most of the urban population was concentrated in compact central city area within the urban wall. Population has increased quickly in inner suburban areas, and major developments also take place in the two open districts in Nanjing, Nanjing Economic and Technological Development Zone in the northeast and Jiangning Economic and Technological Development Zone in the south, which are farther away from the city center and therefore has little effect on suburbanization and population distribution in Nanjing. Spatial restructuring in Nanjing, however, is less drastic if compared with other major cities in the Yangtze Delta, and Nanjing is known for its efforts to preserve the urban environment and sometime is conservative in terms of economic growth and urban expansion. Suzhou, for example, has developed two development zones adjacent to the old city district with massive infusion of foreign investment, which has dramatically changed the spatial structure of the city. Hangzhou, another major city in the delta, has embarked a massive urban expansion towards east and south, spearheaded by newly developed economic-technological development zones, high-tech districts, and administrative centers. Therefore, substantial differentials can still be found among Chinese transitional cities, and it is necessary to study population distribution and spatial restructuring in other coastal and interior cities of China.
22
References:
Anselin L, 1995, "Local indicators of spatial association - LISA" Geographical Analysis 27(2) 93-115 Baumont C, Ertur C, and Le Gallo J, 2004, "Spatial analysis of employment and population density: The case of the agglomeration of Dijon 1999" Geographical Analysis 36(2) 146-176 Bracken I, 1993, "An extensive surface model database for population-related information: concept and application" Environment & Planning B: Planning & Design 20(1) 13-27 Bracken I, and Martin D, 1989, "The generation of spatial population distributions from census centroid data" Environment and Planning A 21(4) 537-543 Clark C, 1951, "Urban population densities" Journal of the Royal Statistical Society (Series A) 114 490-496 Cuthbert A L, and Anderson W P, 2002, "Using spatial statistics to examine the pattern of urban land development in Halifax-Dartmouth" The Professional Geographer 54(4) 521-532 Eicher C L, and Brewer C A, 2001, "Dasymetric mapping and areal interpolation: Implementation and evaluation" Cartography and Geographic Information Science 28(2) 125-138 Feng J, and Zhou Y X, 2003, "A review and prospect on urban internal spatial structure research in China" Di Li Ke Xue Jin Zhan (Progress in Geography) 22(3) 304-315 Fotheringham A S, and Wong D W S, 1991, "The modifiable areal unit problem in multivariate statistical analysis" Environment & Planning A 23(7) 1025-1044 Ingram G K, 1998, "Patterns of metropolitan development: what have we learned?" Urban Studies 35(7) 1019-1035 Langford M, Maguire D J, and Unwin D J, 1991, "The areal interpolation problem: estimating population using remote sensing in a GIS framework", in Handling Geographical Information Eds I Masser (Longman/Wiley:London) pp 55-77 Langford M, and Unwin D J, 1994, "Generating and mapping population density surfaces within a geographical information system" Cartographic Journal 31(1) 21-26 Lin G C S, and Wei Y H D, 2002, "China's restless urban landscapes 1: new challenges for theoretical reconstruction" Environment and Planning A 34(9) 1535-1544 Ma L J C, 2002, "Urban transformation in China, 1949-2000: a review and research agenda" Environment and Planning A 34(9) 1545-1569 Martin D, 1998, "Automatic neighbourhood identification from population surfaces" Computers, Environment and Urban Systems 22(2) 107-120
23
Martin D, and Higgs G, 1997, "The visualization of socio-economic GIS data using virtual reality tools" Transactions in GIS 1(4) 255-266 McMillen D P, and McDonald J F, 1998, "Population density in suburban Chicago: a bid-rent approach" Urban Studies 35(7) 1119-1130 Mennis J, 2003, "Generating surface models of population using dasymetric mapping" The Professional Geographer 55(1) 31-42 Openshaw S, 1983, "The modifiable areal unit problem" CATMOG (Concepts & Techniques in Modern Geography) 38 41 Small K, and Song S, 1994, "Population and employment densities: structure and change" Journal of Urban Economics 36 292-313 Wang F, and Meng Y C, 1999, "Analyzing urban population change patterns in Shenyang, China 1982-90: density function and spatial association approaches" Geographic Information Sciences 5(2) 121-130 Wang F, and Zhou Y X, 1999, "Modelling urban population densities in Beijing 1982-90: suburbanisation and its causes" Urban Studies 36(2) 271-287 Wei Y D, and Leung C K, 2005, "Development zones, foreign investment, and global-city formation in Shanghai" Growth and Change 36(1) 16-40 Wei Y D, and Li W, 2002, "Reforms, globalization, and urban growth in China: The case of Hangzhou" Eurasian Geography and Economics 43(6) 459-475 Wong K Y, Shen J F, Feng Z Q, and Gu C L, 2003, "An analysis of dual-track urbanisation in the Pearl River Delta since 1980" Tijdschrift voor Economische en Sociale Geografie(Journal of Economic and Social Geography) 94(2) 205-218 Wu F, 1998, "Polycentric urban development and land-use change in a transitional economy: the case of Guangzhou" Environment and Planning A 30(6) 1077-1100 Zhou Y X, and Ma L J C, 2000, "Economic restructuring and suburbanization in China" Urban Geography 21(3) 205-236
24
Table 1. Summary statistics of subdistricts in Nanjing in 2000
# Subdistricts Minimum
Maximum
Mean
Sum
Residential floor area (m2)
41
172600
1276301
544243
22313979
Residential parcel area (m2)
41
229448
3580034
964182
39531475
Population
41
18265
133254
62950
2580962
Residential floor area (m2)
16*
9493
928103
358414
5734620
Residential parcel area (m2)
16*
87288
3860990
1545074 24721187
Population
16*
1076
93680
30430
486881
* indicates subdistricts not totally within the study area and the values indicate the statistics of the parts within the study area Table 2. Regressions for exponential density function in different directions from CBD and of subdistricts
Dr=a*exp(b*r) A* B 512.344 527.759 a -0.022 -0.032 b 2 0.796 0.832 R *Excluding points over Xuanwu Lake
C 526.28 -0.037 0.826
25
D 561.69 -0.056 0.911
E 547.234 -0.043 0.909
F 478.605 -0.006 0.305
Subdistricts 524 -0.046 0.421
Table 3. Population change of subdistricts in central city, inner suburb and outer suburb,19822000
1982 Population 1990 2000 1982-1990 Change (%) 1990-2000 1982 % of total population 1990 2000 1982-1990 Change (%) 1990-2000
Central city 985,187 1,148,158 1,338,101 16.54 16.54 53.06 49.61 40.09 -3.45 -9.52
26
Inner suburb 425,847 616,951 1,235,569 44.88 100.27 22.93 26.66 37.01 3.73 10.35
Outer suburb 445,752 549,417 764,468 23.26 39.14 24.01 23.74 22.9 -0.27 -0.84
Figure Captions: Figure 1 The study area in Nanjing, China Figure 2 Process of generating raster population surface Figure 3 Population density by subdistricts in Nanjing, 2000 Figure 4 Raster population surface in Nanjing, 2000 Figure 5 Comparison between vector-based subdistrict population distribution (left) and
raster population surface (right) for CBD area Figure 6 Comparison between vector-based subdistrict population distribution (left) and
raster population surface (right) for Honghua Town of inner suburb Figure 7 Agglomeration and dispersion of population density by population surface in
Nanjing (Cell values indicate the mean population density within a circle of 800m radius) Figure 8 Directional population change with distance from the CBD (A: Northeast, B:
East, C: Southeast, D: Southwest, E: West, and F: Northwest) Figure 9 Spatial associations between commercial & managerial land use and
population distribution (the left map presents the distribution of the four types of spatial association and the right map presents the significance distribution) Figure 10 Spatial associations between industrial land use and population distribution (the left
map presents the distribution of the four types of spatial association and the right map presents the significance distribution) Figure 11 Spatial associations between road land use and population distribution (the left
map presents the distribution of the four types of spatial association and the right map presents the significance distribution)
27
Figure 12 Population change by subdistricts in Nanjing, 1990-2000
28
-
China
Nanjing
Xuanwu Lake
Zhongshan Mountain
Ya ng
tze
Ri ve r
Jiangsu Province
[ [
CBD Center(Xinjiekou) Old City Wall Residential Parcel Subdistrict
0
Fig. 1
1
2
3
4
5 km
Census Subdistrict
Building Distribution
Residential Land Parcel
Vector Grid
Residential Land Parcel with Population Counts
Customized Spatial Overlay
Vector Grid with Population Assigned to Each Cell
Convert Vector Grid to Raster
Raster Population Surface
Fig. 2
Spatial queries and field operations to add attributes to residential land parcel feature class Field caculation to assign subdistrict population to residential land parcel
Customized spatial overlay to assign populaition of residential land parcel to grid cells
Baguazhou Island
Outer Suburb
Outer Suburb Inner Suburb
tze
Ri ve r
Xuanwu Lake
Zhongshan Mountain
Ya ng
Central City
Inner Suburb Inner Suburb Persons/10,000 sq.meters
Outer Suburb
0
Fig. 3
1
2
3
4
5 km
8 - 28 29 - 100 101 - 200 201 - 300 301 - 573
-
Xuanwu Lake
Zhongshan Mountain
Ya ng
tze
Ri ve r
Baguazhou Island
[ Persons/10,000 sq.meters
Honghua Town
0
Fig. 4
1
2
3
4
5 km
0 - 100 101 - 250 251 - 450 451 - 1,000 1,001 - 1,577
[
[
Persons/10,000 sq.meters
Persons/10,000 sq.meters
8 - 28 29 - 100
Fig. 5
101 - 200 201 - 300
301 - 573 Residential Parcel
0 - 100 101 - 250
251 - 450 451 - 1,000
1,001 - 1,577
Honghua Town
Persons/10,000 sq.meters
Persons/10,000 sq.meters 8 - 28 29 - 100
Fig. 6
101 - 200 201 - 300
Honghua Town
301 - 573 Residential Parcel
0 - 100 101 - 250
251 - 450 451 - 1,000
1,001 - 1,577
{ A
Maigaoqiao
Ri
ve r
F
Zhongshan Mountain
Ya n
gt
ze
Xuanwu Lake
[
E
B Xiaolingwei
Xinglong
C
Persons/10,000 sq.meters
D
0
Fig. 7
1
2
3
4
5 km
0 - 107 108 - 215 216 - 323 324 - 431 432 - 540
A
B
C
D
E
F
540 Population Density
480 420 360 300 240 180 120 60 540 Population Density
480 420 360 300 240 180 120 60 2
Fig. 8
4 6 8 Distance (km)
10
2
4 6 8 Distance (km)
10
2
4 6 8 Distance (km)
10
r
r
Ri ve
ve Ri
Ya ng tze
ng tze Ya
High-High Low-Low Low-High HIgh-Low
Fig. 9
012345 km
High-High Low-Low Low-High High-Low Not Significant
012345 km
r tze R
i ve
ive r
Ya
ng
ng tze R Ya
High-High Low-Low Low-High High-Low
Fig. 10
012345 km
High-High Low-Low Low-High High-Low Not Significant
012345 km
r eR ive
r
g tz
eR iv e
Ya n
ng tz Ya
High-High Low-Low Low-High High-Low
Fig. 11
012345 km
High-High Low-Low Low-High High-Low Not Significant
012345 km
Baguazhou Island
Outer Suburb
Outer Suburb Inner Suburb
tze
Ri ve r
Xuanwu Lake
Zhongshan Mountain
Ya ng
Central City
Inner Suburb Inner Suburb Population Change(%)
Outer Suburb
0
Fig.12
1
2
3
4
5 km
300