Bermingham et al. BMC Medical Genomics 2013, 6:7 http://www.biomedcentral.com/1755-8794/6/7
RESEARCH ARTICLE
Open Access
Post-weaning selenium and folate supplementation affects gene and protein expression and global DNA methylation in mice fed high-fat diets Emma N Bermingham1, Shalome A Bassett1, Wayne Young1, Nicole C Roy1,2, Warren C McNabb2,3, Janine M Cooney4, Di T Brewster5, William A Laing5 and Matthew PG Barnett1*
Abstract Background: Consumption of high-fat diets has negative impacts on health and well-being, some of which may be epigenetically regulated. Selenium and folate are two compounds which influence epigenetic mechanisms. We investigated the hypothesis that post-weaning supplementation with adequate levels of selenium and folate in offspring of female mice fed a high-fat, low selenium and folate diet during gestation and lactation will lead to epigenetic changes of potential importance for long-term health. Methods: Female offspring of mothers fed the experimental diet were either maintained on this diet (HF-low-low), or weaned onto a high-fat diet with sufficient levels of selenium and folate (HF-low-suf), for 8 weeks. Gene and protein expression, DNA methylation, and histone modifications were measured in colon and liver of female offspring. Results: Adequate levels of selenium and folate post-weaning affected gene expression in colon and liver of offspring, including decreasing Slc2a4 gene expression. Protein expression was only altered in the liver. There was no effect of adequate levels of selenium and folate on global histone modifications in the liver. Global liver DNA methylation was decreased in mice switched to adequate levels of selenium and folate, but there was no effect on methylation of specific CpG sites within the Slc2a4 gene in liver. Conclusions: Post-weaning supplementation with adequate levels of selenium and folate in female offspring of mice fed high-fat diets inadequate in selenium and folate during gestation and lactation can alter global DNA methylation in liver. This may be one factor through which the negative effects of a poor diet during early life can be ameliorated. Further research is required to establish what role epigenetic changes play in mediating observed changes in gene and protein expression, and the relevance of these changes to health. Keywords: Epigenetic, Microarray analysis, 2D-DIGE, Proteomics, Folate, Selenium, High fat
* Correspondence:
[email protected] 1 Food Nutrition & Health Team, Food & Bio-based Products Group, AgResearch Grasslands, Palmerston North 4442, New Zealand Full list of author information is available at the end of the article © 2013 Bermingham et al.; licensee BioMed Central Ltd. This is an Open Access article distributed under the terms of the Creative Commons Attribution License (http://creativecommons.org/licenses/by/2.0), which permits unrestricted use, distribution, and reproduction in any medium, provided the original work is properly cited.
Bermingham et al. BMC Medical Genomics 2013, 6:7 http://www.biomedcentral.com/1755-8794/6/7
Background The epigenome comprises interconnected, interdependent heritable processes (including DNA methylation, histone modifications, and non-coding RNAs) that regulate gene expression in response to environmental influences. Epigenetic regulation may be as important as DNA transcription and translation for allowing plasticity of the phenotype in a fixed genotype [1]. There is mounting evidence that epigenetics has a major role in multiple physiological processes including development, imprinting, and regulation of gene transcription [2]. Activation or deactivation of genes in response to various deleterious environmental stimuli may be important in the development of common complex diseases [3,4]. Specific nutrients can modulate epigenetic events [5,6], indicating that diet may be a key environmental factor which can influence epigenetic patterns [7,8], with consequent effects on gene expression. It is therefore important to investigate the potential of food components to induce phenotypic changes via epigenetic modulation of gene expression [9]. A genetic predisposition to good health may be established at conception by the combination of genetic material from both parents [10]. However, the effects of environmental impacts throughout life, particularly during critical times such as gestation, can influence the expression of the genetic potential of the individual, resulting in altered phenotype [10]. Macronutrient-rich diets high in carbohydrate, protein and fat may have inadequate levels of micronutrients, especially if the food components are heavily processed [11]. Poor micronutrient intake, which is often associated with high consumption of such foods, has been linked to late onset diseases such as cancer [12]. Selenium is an essential micronutrient which is deficient in diets in several countries, including New Zealand [13], and this deficiency can result in symptoms associated with oxidative stress [14]. Folate, a water-soluble B vitamin with roles in DNA synthesis and repair, is also nutritionally inadequate in diets in many countries [15]. Both selenium and folate can influence gene expression, possibly via epigenetic mechanisms [16]. Folate is thought to affect epigenetic regulation via one-carbon metabolism, however the epigenetic regulation by selenium is less well understood [17]. Selenium is thought to modulate folate deficiency, suggesting that the interaction between folate and selenium is important [16]. Epigenetic activation and repression is important in normal cellular development and maintenance [18]. While particularly important during foetal development, these processes have also been implicated in postnatal development, affecting for example both structure and function of the mammalian gastrointestinal tract [19]. Histone modification and DNA methylation are major
Page 2 of 18
epigenetic mechanisms [20]. In the case of methylation, the general dogma suggests that the addition of methyl groups by DNA methyltransferase represses gene expression, while methyl removal allows activation [21]. Dysregulation of these processes may lead to negative impacts on health [22]. Histone modifications include both acetylation and deacetylation (amongst other modifications); DNA methylation and histone modifications can act together to provide stable and heritable gene silencing in eukaryotic genomes [23]. We hypothesised that post-weaning supplementation with adequate levels of selenium and folate after exposure (via maternal diet during gestation and lactation) to high fat and low selenium and folate will lead to epigenetic changes in the offspring which are of importance for long-term health, with a high-fat diet being a risk factor for obesity. Of interest are the long-term effects of intergenerational epigenetic regulation, which are more likely to be carried through the maternal line [24]. To test this hypothesis, female mice were fed a high-fat diet containing low levels of selenium and folate during gestation and lactation. At four weeks of age, female offspring were either weaned onto the same diet (HFlow-low), or onto a high-fat diet containing adequate selenium and folate (HF-low-suf ). At 12 weeks of age, gene and protein expression profiles, and DNA methylation (global and gene-specific) were measured in colon and liver, and selenium content and histone H3 methylation and acetylation measured in the liver. These analyses showed changes in gene and protein expression in metabolic and oxidative pathways, and altered global DNA methylation, due to post-weaning supplementation with selenium and folate.
Results Food intake and body weight
There was no effect of adequate levels of selenium and folate post-weaning on food intake (c. 2.7 g diet/day; P = 0.91) or bodyweight (c. 18.5 g; P = 0.66) of offspring. Liver selenium content
There was a small but significant effect of diet on liver selenium, with levels in mice in the HF-low-suf group being slightly higher than those in mice in the HF-low -low group (1.03 ± 0.12 vs. 0.85 ± 0.15 mg/kg, P < 0.05). Gene and protein expression profiles
Post-weaning supplementation with adequate levels of selenium and folate altered the expression (P < 0.01, |fold change| >1.5) of 23 genes in the colon (Additional file 1: Table S1). The majority of these genes were significantly over-represented in Gene Ontology (GO) biological processes related to cellular and DNA metabolic processes (Table 1). The biological process “Lipid homeostasis”
Bermingham et al. BMC Medical Genomics 2013, 6:7 http://www.biomedcentral.com/1755-8794/6/7
Page 3 of 18
Table 1 Significantly over-represented gene ontology biological processes associated with differentially expressed genes in the colon of mice supplemented with adequate levels of selenium and folate post-weaning (n = 6 per treatment) Gene name
Term
GOid
Organelle organization
GO:0006996 Top2a Stx6
Systematic name
P value
NM_011623
Mus musculus topoisomerase (DNA) II alpha
−1.7
0.006
Mus musculus syntaxin 6
−1.6
0.003
Mus musculus procollagen, type IV, alpha 3 (Goodpasture antigen) binding protein
−1.5
0.004
Pom121
NM_148932
Mus musculus nuclear pore membrane protein 121
−1.7
0.004
Shprh
AK037266
Mus musculus 16 days neonate thymus
−1.6
0.003
Mus musculus procollagen, type IV, alpha 3 (Goodpasture antigen) binding protein
−1.5
0.004
NM_023564
Mus musculus phospholipid scramblase 3
−1.6
0.007
NM_010930
Mus musculus nephroblastoma overexpressed gene
−1.7
0.005
Top2a
NM_011623
Mus musculus topoisomerase (DNA) II alpha
−1.7
0.006
Stx6
NM_021433
Mus musculus syntaxin 6
−1.6
0.003
Col4a3bp NM_023420
Mus musculus procollagen, type IV, alpha 3 (Goodpasture antigen) binding protein
−1.5
0.004
Pom121
NM_148932
Mus musculus nuclear pore membrane protein 121
−1.7
0.004
Shprh
AK037266
Mus musculus 16 days neonate thymus
−1.6
0.003
GO:0055088 Col4a3bp NM_023420 Plscr3
Cellular component organization
Fold change
NM_021433
Col4a3bp NM_023420
Lipid homeostasis
Description
GO:0016043 Nov
Nuclear pore organization
GO:0006999 Pom121
NM_148932
Mus musculus nuclear pore membrane protein 121
−1.7
0.004
Cellular process
GO:0009987 Heph
NM_181273
Mus musculus hephaestin, transcript variant 2
−1.5
0.001
DNA packaging
Mef2a
NM_001033713 Mus musculus myocyte enhancer factor 2A
−1.6
0.001
Nov
NM_010930
Mus musculus nephroblastoma overexpressed gene
−1.7
0.005
Rora
AK087905
Mus musculus 2 days pregnant adult female ovary
−1.8
0.001
Top2a
NM_011623
Mus musculus topoisomerase (DNA) II alpha
−1.7
0.006
Mtmr1
NM_016985
Mus musculus myotubularin related protein 1
−1.6
0.008
Stx6
NM_021433
Mus musculus syntaxin 6
−1.6
0.003
Col4a3bp NM_023420
Mus musculus procollagen, type IV, alpha 3 (Goodpasture antigen) binding protein
−1.5
0.004
Pom121
NM_148932
Mus musculus nuclear pore membrane protein 121
−1.7
0.004
Shprh
AK037266
Mus musculus 16 days neonate thymus
−1.6
0.003
Podxl2
NM_176973
Mus musculus podocalyxin-like 2
−1.6
0.005
GO:0006323 Top2a Shprh
DNA conformation change
GO:0071103 Top2a
DNA metabolic process
GO:0006259 Top2a
Shprh
Shprh
NM_011623
Mus musculus topoisomerase (DNA) II alpha
−1.7
0.006
AK037266
Mus musculus 16 days neonate thymus
−1.6
0.003
NM_011623
Mus musculus topoisomerase (DNA) II alpha
−1.7
0.006
AK037266
Mus musculus 16 days neonate thymus
−1.6
0.003
NM_011623
Mus musculus topoisomerase (DNA) II alpha
−1.7
0.006
AK037266
Mus musculus 16 days neonate thymus
−1.6
0.003
A positive fold change indicates that supplementation increased the expression of the gene.
was also significantly over-represented (P = 0.007) among the differentially expressed genes in the colon. The mRNA abundance of the majority of genes in the colon was decreased (Table 1). In the liver, post-weaning supplementation with adequate levels of selenium and folate led to differential
expression (P < 0.01, FC > 1.5) of 36 genes (Additional file 2: Table S2), within which the GO biological processes, “Cellular process”, “Multicellular organismal process”, “Developmental process”, and “Multicellular organismal development” were significantly over-represented (P < 0.05) (Table 2). Whilst the mRNA abundance of the majority of
Bermingham et al. BMC Medical Genomics 2013, 6:7 http://www.biomedcentral.com/1755-8794/6/7
Page 4 of 18
Table 2 Significantly over-represented gene ontology biological processes associated with differentially expressed genes in the liver of mice supplemented with adequate levels of selenium and folate post-weaning (n = 6 per treatment) Term
GOid
Multicellular organismal process
GO:0032501 Il2
Developmental process
Multicellular organismal development
Genename Systematicname Description
Fold P change value
NM_008366
Mus musculus interleukin 2
−1.50
0.010
Isl1
NM_021459
Mus musculus ISL1 transcription factor, LIM/ homeodomain
−1.59
0.007
Mbp
NM_010777
Mus musculus myelin basic protein, transcript variant 7
−1.62
0.004
Ift172
NM_026298
Mus musculus intraflagellar transport 172 homolog (Chlamydomonas)
−1.52
0.002
Errfi1
NM_133753
Mus musculus ERBB receptor feedback inhibitor 1
1.73
0.000
Dmbx1
NM_130865
Mus musculus diencephalon/mesencephalon homeobox 1, transcript variant 1
−1.50
0.010
Mcoln3
AK033008
Mus musculus 12 days embryo male wolffian duct includes surrounding region cDNA
−1.68
0.008
Ndrg4
NM_145602
Mus musculus N-myc downstream regulated gene 4
−1.55
0.009
Frem2
NM_172862
Mus musculus Fras1 related extracellular matrix protein 2
−1.52
0.007
Olfr1355
AF042360
Mus musculus clone OR27-3 putative olfactory receptor mRNA
−1.53
0.001
Olfr357
NM_146623
Mus musculus olfactory receptor 357
−1.52
0.008
Olfr646
NM_147056
Mus musculus olfactory receptor 646
−1.67
0.010
NM_008366
Mus musculus interleukin 2
−1.50
0.010
Isl1
NM_021459
Mus musculus ISL1 transcription factor, LIM/ homeodomain
−1.59
0.007
Mbp
NM_010777
Mus musculus myelin basic protein, transcript variant 7
−1.62
0.004
Slc2a4
NM_009204
Mus musculus solute carrier family 2 (facilitated glucose transporter), member 4
−2.39
0.001
Ift172
NM_026298
Mus musculus intraflagellar transport 172 homolog (Chlamydomonas)
−1.52
0.002
Errfi1
NM_133753
Mus musculus ERBB receptor feedback inhibitor 1
−1.73
0.000
Dmbx1
NM_130865
Mus musculus diencephalon/mesencephalon homeobox 1, transcript variant 1
1.50
0.010
Mcoln3
AK033008
Mus musculus 12 days embryo male wolffian duct includes surrounding region cDNA
−1.68
0.008
Ndrg4
NM_145602
Mus musculus N-myc downstream regulated gene 4
−1.55
0.009
Frem2
NM_172862
Mus musculus Fras1 related extracellular matrix protein 2
−1.52
0.007
Il2
NM_008366
Mus musculus interleukin 2
−1.50
0.010
NM_021459
Mus musculus ISL1 transcription factor, LIM/ homeodomain
−1.59
0.007
Mbp
NM_010777
Mus musculus myelin basic protein, transcript variant 7
−1.62
0.004
Ift172
NM_026298
Mus musculus intraflagellar transport 172 homolog (Chlamydomonas)
−1.52
0.002
Errfi1
NM_133753
Mus musculus ERBB receptor feedback inhibitor 1
1.73
0.000
Dmbx1
NM_130865
Mus musculus diencephalon/mesencephalon homeobox 1, transcript variant 1
−1.50
0.010
Mcoln3
AK033008
−1.68
0.008
GO:0032502 Il2
GO:0007275 Isl1
Bermingham et al. BMC Medical Genomics 2013, 6:7 http://www.biomedcentral.com/1755-8794/6/7
Page 5 of 18
Table 2 Significantly over-represented gene ontology biological processes associated with differentially expressed genes in the liver of mice supplemented with adequate levels of selenium and folate post-weaning (n = 6 per treatment) (Continued) Mus musculus 12 days embryo male wolffian duct includes surrounding region cDNA
Cellular process
System development
Organ development
Ndrg4
NM_145602
Mus musculus N-myc downstream regulated gene 4
−1.55
0.009
Frem2
NM_172862
Mus musculus Fras1 related extracellular matrix protein 2
−1.52
0.007
GO:0009987 Fpr-rs2
NM_008039
Mus musculus formyl peptide receptor, related sequence 2
1.51
0.005
Il2
NM_008366
Mus musculus interleukin 2
−1.50
0.010
Isl1
NM_021459
Mus musculus ISL1 transcription factor, LIM/ homeodomain
−1.59
0.007
Mbp
NM_010777
Mus musculus myelin basic protein, transcript variant 7
−1.62
0.004
Slc2a4
NM_009204
Mus musculus solute carrier family 2 (facilitated glucose transporter), member 4
−2.39
0.001
Ift172
NM_026298
Mus musculus intraflagellar transport 172 homolog (Chlamydomonas)
−1.52
0.002
Errfi1
NM_133753
Mus musculus ERBB receptor feedback inhibitor 1
1.73
0.000
Pcdhb10
NM_053135
Mus musculus protocadherin beta 10
−1.52
0.005
Dmbx1
NM_130865
Mus musculus diencephalon/mesencephalon homeobox 1, transcript variant 1
−1.50
0.010
Mcoln3
AK033008
Mus musculus 12 days embryo male wolffian duct includes surrounding region cDNA
−1.68
0.008
C79407
NM_172578
Mus musculus expressed sequence C79407
−1.66
0.005
Spon1
AK084717
Mus musculus 13 days embryo heart cDNA
−1.66
0.004
Tnrc6a
AK147327
Mus musculus cDNA
−1.71
0.003
Frem2
NM_172862
Mus musculus Fras1 related extracellular matrix protein 2
−1.52
0.007
Olfr1355
AF042360
Mus musculus clone OR27-3 putative olfactory receptor
−1.53
0.001
Olfr357
NM_146623
Mus musculus olfactory receptor 357
−1.52
0.008
Olfr646
NM_147056
Mus musculus olfactory receptor 646
−1.67
0.010
NM_008366
Mus musculus interleukin 2
−1.50
0.010
Isl1
NM_021459
Mus musculus ISL1 transcription factor, LIM/ homeodomain
−1.59
0.007
Mbp
NM_010777
Mus musculus myelin basic protein, transcript variant 7
−1.62
0.004
Ift172
NM_026298
Mus musculus intraflagellar transport 172 homolog (Chlamydomonas)
−1.52
0.002
Errfi1
NM_133753
Mus musculus ERBB receptor feedback inhibitor 1
1.73
0.000
Dmbx1
NM_130865
Mus musculus diencephalon/mesencephalon homeobox 1, transcript variant 1
−1.50
0.010
Mcoln3
AK033008
Mus musculus 12 days embryo male wolffian duct includes surrounding region cDNA
−1.68
0.008
Frem2
NM_172862
Mus musculus Fras1 related extracellular matrix protein 2
−1.52
0.007
Il2
NM_008366
Mus musculus interleukin 2
−1.50
0.010
NM_021459
Mus musculus ISL1 transcription factor, LIM/ homeodomain
−1.59
0.007
−1.62
0.004
GO:0048731 Il2
GO:0048513 Isl1 Mbp
NM_010777
Bermingham et al. BMC Medical Genomics 2013, 6:7 http://www.biomedcentral.com/1755-8794/6/7
Page 6 of 18
Table 2 Significantly over-represented gene ontology biological processes associated with differentially expressed genes in the liver of mice supplemented with adequate levels of selenium and folate post-weaning (n = 6 per treatment) (Continued) Mus musculus myelin basic protein, transcript variant 7
Cellular developmental process
Anatomical structure development
Negative regulation of macromolecule metabolic process
Cell surface receptor linked signaling pathway
Mus musculus intraflagellar transport 172 homolog (Chlamydomonas)
−1.52
0.002
NM_133753
Mus musculus ERBB receptor feedback inhibitor 1
1.73
0.000
Dmbx1
NM_130865
Mus musculus diencephalon/mesencephalon homeobox 1, transcript variant 1
−1.50
0.010
Mcoln3
AK033008
Mus musculus 12 days embryo male wolffian duct includes surrounding region cDNA
−1.68
0.008
Frem2
NM_172862
Mus musculus Fras1 related extracellular matrix protein 2
−1.52
0.007
NM_008366
Mus musculus interleukin 2
−1.50
0.010
Isl1
NM_021459
Mus musculus ISL1 transcription factor, LIM/ homeodomain
−1.59
0.007
Mbp
NM_010777
Mus musculus myelin basic protein, transcript variant 7
−1.62
0.004
Ift172
NM_026298
Mus musculus intraflagellar transport 172 homolog (Chlamydomonas)
−1.52
0.002
Errfi1
NM_133753
Mus musculus ERBB receptor feedback inhibitor 1
1.73
0.000
Dmbx1
NM_130865
Mus musculus diencephalon/mesencephalon homeobox 1, transcript variant 1
−1.50
0.010
Mcoln3
AK033008
Mus musculus 12 days embryo male wolffian duct includes surrounding region cDNA
−1.68
0.008
Frem2
NM_172862
Mus musculus Fras1 related extracellular matrix protein 2
−1.52
0.007
NM_008366
Mus musculus interleukin 2
−1.50
0.010
Ift172
NM_026298
Mus musculus intraflagellar transport 172 homolog (Chlamydomonas)
−1.52
0.002
Errfi1
NM_133753
Mus musculus ERBB receptor feedback inhibitor 1
1.73
0.000
Dmbx1
NM_130865
Mus musculus diencephalon/mesencephalon homeobox 1, transcript variant 1
−1.50
0.010
Tnrc6a
AK147327
Mus musculus cDNA
−1.71
0.003
NM_008366
Mus musculus interleukin 2
−1.50
0.010
Ift172
NM_026298
Errfi1
GO:0048869 Il2
GO:0048856 Il2
GO:0010605 Il2
GO:0007166 Il2
Bermingham et al. BMC Medical Genomics 2013, 6:7 http://www.biomedcentral.com/1755-8794/6/7
Page 7 of 18
Table 2 Significantly over-represented gene ontology biological processes associated with differentially expressed genes in the liver of mice supplemented with adequate levels of selenium and folate post-weaning (n = 6 per treatment) (Continued) Ift172
NM_026298
Mus musculus intraflagellar transport 172 homolog (Chlamydomonas)
−1.52
0.002
Plce1
AK035546
Mus musculus adult male urinary bladder cDNA
1.53
0.010
Errfi1
NM_133753
Mus musculus ERBB receptor feedback inhibitor 1
1.73
0.000
Olfr1355
AF042360
Mus musculus clone OR27-3 putative olfactory receptor
−1.53
0.001
Olfr357
NM_146623
Mus musculus olfactory receptor 357
−1.52
0.008
Olfr646
NM_147056
Mus musculus olfactory receptor 646
−1.67
0.010
A positive fold change indicates that supplementation increased the expression of the gene.
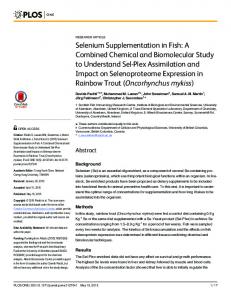
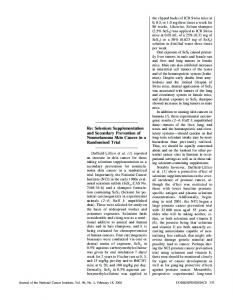
these genes, including Slc2a4, was decreased, the abundance of Dmbx1, Errfi1, Plce1 and Fpr-rs2 transcripts was increased in the liver (Table 2) in offspring supplemented with adequate levels of selenium and folate. Pooled differential proteomic analysis (HF-low-suf vs. HF-low-low) showed no effect of post-weaning supplementation with adequate levels of selenium and folate on protein expression in the colon (data not shown). In the liver, 22 proteins were differentially expressed (P < 0.05; Figure 1) and are shown in the gel image depicted in Additional file 3: Figure S1, and listed in Figure 1. These included proteins with a role in the oxidative stress response, metabolic proteins (in particular those in the urea cycle and amino acid metabolism), and cytoskeletal proteins such as actin and tropomysin (Figure 1). A network of interactions between genes and proteins, and the changes in expression associated with feeding of the HF-low-suf diet, can be seen in Figure 2. As shown in Figure 3, gene and protein expression fold changes in the liver were not highly correlated (Pearson Coefficient = 0.33). Global DNA methylation and histone modifications
There were no significant differences in the global levels of histone H3 acetylation (H3K9ac; P = 0.808) or methylation (H3K9me2; p = 0.788) detected in liver, while there was insufficient material available to accurately measure either of these changes in colon (Table 3). Gene-specific methylation of Slc2a4
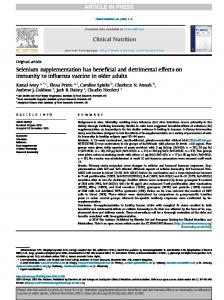
The expression of the Slc2a4 gene in liver was significantly down-regulated in supplemented mice; microarray data showed consistent decreased Slc2a4 mRNA abundance due to adequate selenium and folate supplementation, with 8 separate probes for this gene on the array showing a >2 |fold-change| (range −2.10 to −2.39). In addition, methylation of sites in the promoter region of Slc2a4 gene has been associated with transcriptional control of this gene [25,26]. This gene was therefore chosen to investigate gene-specific methylation. Data were generated by Sequenom analysis for 6 individual
CpG sites (1, 4, 6, 9, 16 and 17) and two CpG clusters (12-13-14-15, and 22–23) within the first amplicon (pp_27), and 6 individual CpG sites (1, 2, 3, 5, 6 and 9) within the second amplicon (pp_46). There were no significant differences with respect to the percentage methylation of any of these CpG sites due to selenium and folate supplementation post-weaning in mice fed high-fat diets (Figure 4), and there was also no effect on the overall pattern of methylation.
Discussion The study reported here shows that post-weaning supplementation with adequate levels of selenium and folate (following maternal consumption of a high-fat diet low in selenium and folate during gestation and lactation) altered metabolism-related pathways in both liver and colon. In colon, differential expression of genes was observed in DNA metabolic processes, with no changes observed in protein expression. In the liver, differential expression of both genes and proteins was observed (although not necessarily concomitant), and a reduction of total DNA methylation was also seen. Gene and protein expression
Analysis of the effect of post-weaning supplementation of adequate levels of selenium and folate on liver protein expression identified differential expression of proteins involved in oxidative stress response, metabolism, and cytoskeletal assembly. The changes in oxidative stress response are likely to be due to the antioxidant role of selenium being enhanced due to supplementation. Changes in expression levels of genes and their corresponding proteins were not highly correlated. This is not surprising, as the use of direct gene/protein correlation measures is unlikely to reflect the actual correspondence between the expression of a gene and its protein, which is complicated due to post-transcriptional and translational regulation [27]. Nevertheless, in this study both protein and/or gene expression patterns were altered in metabolism-related pathways (e.g., cellular process,
Bermingham et al. BMC Medical Genomics 2013, 6:7 http://www.biomedcentral.com/1755-8794/6/7
spot
accession number (NCBI)
Gene (MGI)
3
gi|33563240
Acta1*
3 1
gi|6752954 gi|31982300
Actg1* Hbb-b1
1 2
gi|255708425 gi|6754976
Mb Prdx1
4
gi|6754976
Prdx1
5
gi|10129957
Prdx5
Page 8 of 18
fold change
2.8 2.8 36.9 36.9 1.8 1.9 3.9
7
gi|29126205
Acaa2
1.5
11
gi|16741754
Asl
10 7
gi|6996911 gi|6996911
Ass1 Ass1
14
gi|124248512
Cps1
13 15
gi|199559885 gi|160298209
Eno1 Got1
6 6
gi|116283875 gi|31560689
Hgd Hmgcs2
11
gi|31560689
Hmgcs2
9
gi|172072677
Uroc1
1.5 15.3 1.5 1.5 1.6 1.6 2.0 2.0 1.5 1.7
3 3
gi|33563240 gi|6752954
Acta1* Actg1*
8 8
gi|62027399 gi|47894398
Tpm3 Tpm4
12
gi|56605979
Btf3
16
gi|254588014
Etfdh
protein identified Oxidative stress/Nrf2 mediated oxidative stress response/ Response to hypoxia actin, alpha 1, skeletal muscle actin, gamma, cytoplasmic 1 hemoglobin, beta adult major chain myoglobin peroxiredoxin 1 peroxiredoxin 1 peroxiredoxin 5 Metabolism acetyl-Coenzyme A acyltransferase 2 (mitochondrial 3oxoacyl-Coenzyme A thiolase) argininosuccinate lyase argininosuccinate synthetase 1 argininosuccinate synthetase 1 carbamoyl-phosphate synthetase 1 precursor enolase 1, alpha non-neuron-like glutamate oxaloacetate transaminase 1, soluble Hgd protein hydroxymethylglutaryl-CoA synthase 2 precursor hydroxymethylglutaryl-CoA synthase 2 precursor urocanase domain containing 1 Cytoskeletal
2.8 2.8 1.6 1.6
1.5 1.2
actin, alpha 1, skeletal muscle actin, gamma, cytoplasmic 1 Tpm3 protein tropomyosin 4 Miscellaneous basic transcription factor 3 electron-transferring-flavoprotein dehydrogenase precursor
Figure 1 Changes in protein expression in the liver of mice supplemented with adequate levels of selenium and folate post-weaning. This analysis is of duplicate technical replicates representing protein pooled from the 6 mice per treatment group used for microarray analysis. A positive fold change indicates that supplementation increased the expression of the protein. Note that 16 differentially expressed protein “spotfeatures” were identified, representing 22 unique proteins (spot features 1, 3, 6, 7, 8, and 11 each contain 2 proteins). * Indicates that a protein appears in multiple functional groups.
cellular component organization, organelle organization, and DNA metabolic process pathways, multicellular organismal process, developmental process, and multicellular organismal development) indicating a potentially important developmental role for post-weaning supplementation of selenium and folate. One gene which showed common differential expression of both transcript and protein was myoglobin, which had higher expression levels in offspring which had received the adequate diets. This is consistent with studies showing that administration of folic acid can enhance porphyrin production [28]. The haeme porphyrin ring is an essential component of both myoglobin and haemoglobin, and because folate functions as a carbon carrier in the formation of haeme [29], folate supplementation may result in increased availability of haeme.
This may be one mechanism explaining the observed large increase in myoglobin gene and protein expression, and in haemoglobin protein expression, in the current study. There were no genes that showed altered expression in both liver and colon. It is known that selenium supplementation effects selenoprotein activity differently in different tissues [30]. Furthermore, while liver is the main tissue of folate storage and metabolism [31], supplementation with methyl donors including folic acid has been shown to affect gene expression and DNA methylation in colon tissue in a mouse model of colitis [32], suggesting that colon may be an important target tissue for folate supplementation. It has also been shown that the effects of folate supplementation can differ depending on age and tissue [33]. It is therefore not
Bermingham et al. BMC Medical Genomics 2013, 6:7 http://www.biomedcentral.com/1755-8794/6/7
Page 9 of 18
Figure 2 The effects of adequate selenium and folate post-weaning on differentially expressed genes and proteins in the liver of female mice exposed to high-fat diets with low selenium and folate during gestation and lactation. A network of genes (Δ) and proteins (Ο) was generated using Ingenuity Pathways Analysis software. All genes and proteins differentially expressed in the liver in response to altered selenium and folate levels were included, and the IPA knowledge base developed links between these based on direct interactions previously reported in the literature. Genes and gene products with higher expression in the deficient animals are shown in red, those with lower expression in green. This approach was used to identify whether any genes or proteins showed direct interactions with a large number of other genes or proteins, and may therefore be of particular importance in mediating the effects of altered dietary selenium and folate.
surprising that there was no overlap between the pattern of gene and protein expression in these tissues in the current study, particularly given the relatively small number of genes and proteins that were differentially expressed in response to different levels of selenium and folate.
DNA methylation
We observed a small (approximately 10%) but significant decrease of global DNA methylation in the liver of offspring fed selenium and folate supplemented. Other studies have shown varying effects of selenium and folate supplementation on global DNA methylation. For
Bermingham et al. BMC Medical Genomics 2013, 6:7 http://www.biomedcentral.com/1755-8794/6/7
Page 10 of 18
Figure 3 Comparison of gene and protein data using unsupervised hierarchical clustering in the liver. Comparison of gene (“microarray FC”) and corresponding protein (protein FC) expression levels in liver tissue of mice receiving adequate levels of folate and selenium postweaning with expression levels in liver of mice with low dietary selenium and folate. Yellow (fold change >1) indicates greater expression in HFLow-Suf mice, blue (fold change < 1) indicates greater expression in HF-Low-Low mice. Proteins and genes were non-hierarchically clustered according to similarity in fold change. Multiple instances of genes/protein names indicate multiple microarray probes/protein spots. Data for all gene expression changes are shown in Additional file 1: Table S1 and Additional file 2: Table S2, and for protein changes in Figure 1.
example, selenium deficiency decreased global DNA methylation in the colon, with no effect in liver, in Fischer-344 rats fed a deficient diet from weaning; in the same study, folate had no effect on global DNA methylation [34]. In contrast, and in agreement with our data, adequate (0.15 mg/kg diet) and supra-nutritional (4 mg/ kg diet) selenium supplementation decreased total DNA methylation levels in the liver of rats maintained on Table 3 The effects of adequate levels of selenium and folate post-weaning life on histone H3 modifications (acetylation or methylation of lys9 residue, mean peak intensity) in the liver of mice fed high-fat diets Tissue
HF-low-low
HF-low-suf
n=6
n=6
SE
P-value
H3K9ac
100.0
109.1
0.15
0.808
H3K9me2
100.0
109.1
0.14
0.788
Note that colon was not studied as insufficient protein was obtained from these tissues to perform the analysis.
standard diets (AIN-93 G), compared to deficient diets [35]. This study involved feeding a standard diet, whereas our study had a high-fat diet, thus the same effect of supplementation on total DNA methylation has been observed within the context of two different diets. A reduction in overall levels of DNA methylation in the liver may indicate increased transcriptional activity, because methylation is usually inversely correlated with the transcriptional status of genes [36]. Although an overall reduction in liver DNA methylation was observed in mice supplemented with selenium and folate in the current study, genes differentially expressed in the liver largely showed reduced expression in response to supplementation. It has recently been observed that the epigenetic effects of folate on DNA methylation are highly complex, with factors such as gene and site specificity, cell type, target organ, degree and duration of folate manipulations, and interactions with other methyl group donors and dietary factors all potentially
Bermingham et al. BMC Medical Genomics 2013, 6:7 http://www.biomedcentral.com/1755-8794/6/7
Page 11 of 18
Slc2a4 gene CpG Islands Slc2a4_pp46
Slc2a4_pp27
Amplicons
Slc2a4_pp46
Slc2a4_pp27
16 HF-Low-Low HF-Low-Suf
Methylation (%)
12
8 4 0 -1000
-800
-600
-400
-200
0
200
400
Position relative to transcription start (bases)
Figure 4 Methylation of CpG sites at, and upstream of, the transcription start site of the Slc2a4 gene. The promoter region and transcription start site of the Slc2a4 gene were targeted to establish if differential DNA methylation was occurring at specific CpG sites within these regions. The upper panel represents the position of CpG islands, target amplicons, and CpG sites within the target region, while the graph represents mean ± SEM for the percentage methylation at each site, as measured using Sequenom EpiTYPER. No significant differences were observed as a result of selenium and folate supplementation for any of the CpG sites measured.
influencing the effects [37]. It is therefore perhaps not surprising that there is not a simple link between increased dietary folate and the degree of methylation, nor between methylation and gene expression. Results from our study may also be complicated by potential interactions between folate and selenium. Furthermore, a recently reported human population study found no positive associations between intake of methyl donor nutrients during pregnancy and overall DNA methylation in offspring [38]. Folate depletion has been associated with gene-specific changes in DNA methylation, for example of the p53 [39] and Slc394a [40] genes. Information on concurrent selenium and folate supplementation is less widely available. In the current study, we observed decreased expression of the Slc2a4 gene (which encodes the glucose transporter GLUT4) in offspring of the adequate selenium/folate group. It has been observed that combining selenium with insulin was able to restore, among other things, disturbances in GLUT4 levels in cardiac muscle in diabetic rats. Furthermore, methylation of sites in the promoter region of Slc2a4 gene has been associated with transcriptional control of this gene [25,26]. In this study, however, we found no association between changes in Slc2a4 expression and altered methylation in the promoter region. The site of methylation may be an important factor in the regulation of gene expression, with methylation of CpG sites in the promoter region closest to the transcription start site having more influence on gene expression than those further from this region due to the effects of methylation on transcription factor
binding [41]. Several studies have also shown that CpG methylation within introns is associated with changes in gene expression [42-44]. It is therefore possible that CpG sites within the Slc2a4 gene that were not analysed in the current study were differentially methylated, and thereby influenced its levels of expression. It is also plausible that the overall reduction in methylation observed in this study may have occurred in non-coding regions of the genome, or that a ‘redistribution’ of methyl marks may have occurred in response to altered dietary folate/selenium. A more comprehensive analysis of methylation, both across the Slc2a4 gene and at a genome-wide level, would be required to further clarify these points. It is also important to note that CpG methylation is only one possible factor by which gene expression may be regulated [41]. For example, modifications of chromatin structure, including acetylated histone H3, acetylated histone H4 and di-methylated histone H3 at lysine 4, within the promoter region have been shown to regulate expression of the Slc2a4 gene [45]. Additional studies would be required to clarify any role of these modifications in the observed change in expression of this gene.
Histone modifications
Previous research has shown that in addition to causing promoter DNA demethylation, selenium (in the form of selenite) can decrease histone deacetylase activity, increase levels of acetylated lysine 9 on histone H3 (H3-Lys 9), and (as a result of the increased acetylation)
Bermingham et al. BMC Medical Genomics 2013, 6:7 http://www.biomedcentral.com/1755-8794/6/7
decrease levels of methylated H3-Lys 9 in prostate cancer cell lines [46]. Supplementation with the methyl group donors folate (2 mg/kg), methionine (0.4%), and choline bitartrate (0.3%) has been shown to affect histone modifications (decreasing histone H3K9me3 levels) when compared with mice fed a diet with low folate, and lacking choline and methionine [47]. Furthermore, studies of a choline and methyl-deficient C57BL/6 mouse prostate cancer model suggest that chromatin modifications are more susceptible to methyl-deficient diets than DNA methylation at certain loci [48]. The current study is the first to our knowledge that has attempted to investigate the effects of a combination of selenium and folate on histone modifications. We showed adequate selenium and folate post-weaning did not affect global histone modifications in the liver of mice fed high-fat diets. There could be a number of reasons for this. Previous studies have used diets deficient in other methyl donors such as choline and methionine. This suggests that folate deficiency, even in the presence of a selenium deficiency, may not be sufficient to trigger global histone changes in the tissues studied. In addition, it may be that there are modifications occurring at histone sites associated with specific genes, and the global approach we have applied was not sufficiently sensitive to evaluate such changes. Future studies including measurement of gene-specific histone modifications using, for example, chromatin immunoprecipitation (ChIP) experiments would help to clarify this point.
Conclusions The data described here show that in addition to changes in gene and protein expression in metabolic and oxidative pathways, altering dietary levels of selenium and folate post-weaning can alter global DNA methylation. Because epigenetic mechanisms such as DNA methylation may have a role in disease processes, modulation of these by micronutrient supplementation may play a role in preventing or ameliorating negative health outcomes from inadequate nutrition. Further research is required to establish if epigenetic mechanisms are mediating the specific changes observed in gene and protein expression, and if so which are the precise mechanisms involved. In addition, further studies are required to establish whether there are any confounding effects due to combining selenium and folate, or to establish whether there is any interaction between these two compounds. Finally, it has been suggested that a five week dietary ‘run-in’ period is required to systemically reduce folate levels in mice [49], and data from rats suggest that at least 4 weeks may be required to deplete selenium [50]. While liver selenium content of the HF-low-low animals was less than that of the HF-low-suf animals in our
Page 12 of 18
study, it was not as low as has been observed in other studies which used a similar level of dietary selenium but had a longer feeding period [51]. While we do not have data on liver or colon folate levels, or colon selenium levels, of the mice in our study due to insufficient sample being available, it seems possible that these levels would not have been significantly reduced until early lactation due to our relatively short run-in period. Future studies could include a minimum five week run-in period, as well as measurement of selenium and folate [52] levels in red blood cells, colon and liver, to confirm that significant depletion had occurred and to more clearly link this depletion with the outcome measures of the study.
Methods Animals & diets
All procedures involving animals were approved by the Grasslands Animal Ethics Committee under the New Zealand Animal Welfare Act 1999. A pelleted “Western” diet [53,54] (D12079B; Research Diets, New Brunswick, NJ 08901, USA) containing 40%, 42% and 17% kcal from fat, carbohydrate and protein, respectively (Additional file 4: Table S3) was modified to contain either 0.4 mg/kg folate and 0.1 mg/kg selenium (high-fat, low selenium and folate; HF-low) or 1.8 mg/kg folate and 0.60 mg/kg selenium (high-fat, adequate selenium and folate; HF-suf ). Analysis of the diets after manufacture confirmed that these were the actual levels of selenium and folate. These levels of folate and selenium are commonly used for supplementation in mouse and rat diets [34,55,56] and are also in accordance with National Research Council guidelines for Laboratory Animals. Additional ethoxyquin was included in both diets to prevent rancidity (Additional file 4: Table S3). Thirty five female wild type C57BL-6 mice (Animal Resource Centre, Western Australia) were fed a HF-Low diet for 7 days prior to mating with male C57BL-6 mice (Ruakura Small Animal Facility, Hamilton, New Zealand). An important epigenetic period is oocyte maturation, which in the mouse is 3.5 days prior to fertilisation [57]. The experimental diet was therefore introduced prior to the phase of oestrus during which pregnancy occurs, i.e., a minimum of 4 days prior to mating [58]. Once pregnancy was confirmed via the presence of a vaginal plug, males were removed from the mating cages. The breeding dams were maintained on the HF-low diets during mating, gestation and lactation. Offspring remained with their dams until weaning (c. 28 days of age). At weaning, female offspring were randomly allocated to either the HF-low diet (n = 6; HF-low/low) or switched to the HF-Suf diet (n = 6; HF-low/suf) until 12 weeks of age. Mice were offered 20 g of food pellets twice weekly and had ad libitum access to water. Food intake (estimated by collecting and
Bermingham et al. BMC Medical Genomics 2013, 6:7 http://www.biomedcentral.com/1755-8794/6/7
weighing uneaten food) and bodyweight were determined twice weekly. General health score was determined daily. The mice were euthanised at 12 weeks of age via CO2 asphyxiation and cervical dislocation. Prior to tissue collection, mice were fasted and re-fed to minimise variation in food intake immediately before sampling [59]. Colon tissue and liver were excised, washed in cold saline and stored in tubes containing 1 mL of RNA later, then stored at 4°C overnight. The RNA later was removed and the tissues snap-frozen in liquid nitrogen and stored at −85°C until analysis. RNA and DNA isolation
Genomic DNA, total RNA and protein from whole colon and liver tissue was extracted using an AllPrepW DNA/RNA/Protein mini kit (Qiagen, Cat number 80004). DNA was quantified using a NanoDrop ND1000 (Thermo Fisher Scientific) and stored at −20°C until required for further analyses. Quality of the genomic DNA for subsequent analyses was determined by agarose gel electrophoresis. Total RNA was quantified using a NanoDrop ND1000 and RNA quality was determined using an Agilent 2100 Bioanalyser (Agilent Technologies, Palo Alto, CA, USA) to measure the RNA integrity number (RIN). RNA was stored at −85°C until required for microarray analysis. Microarray hybridization and analysis
Microarray hybridization has been described in detail elsewhere [60]. Briefly, a reference design was used for microarray hybridization: intestinal and liver RNA extracts from all mice were pooled in an equimolar proportion and used as the reference sample. Cy3-labelled sample cRNA (0.75 μg) and Cy5-labelled reference cRNA (0.75 μg) was prepared using an in situ hybridization kit-plus (Agilent Technologies Inc., Palo Alto, California, USA) and hybridised to Agilent Technologies Mouse G4122F – 4x44k 60mer oligonucleotide arrays, as previously described [61]. Slides were scanned using an Agilent scanner after an automatic gain and calibration prior to each scan. Spot identification and quantification were performed using Agilent Feature Extraction software version 9.5. Microarray fluorescence signals were normalized using a global loess algorithm in R2.14.1 with the Linear Models for Microarray Data (limma) package [62]. Differentially expressed genes were determined using an Empirical Bayes modified t-statistic from a linear model of microarray analysis. Genes with a greater than 1.5 fold change and a P value less than 0.01 were considered to be differentially expressed. Significantly over-represented Gene Ontology biological processes among differentially expressed genes were determined using the GOStats package in R 2.14.1 [63]. The data discussed in this publication have been deposited in NCBI’s Gene Expression Omnibus [64] and are accessible through GEO Series
Page 13 of 18
accession number GSE43038 (http://www.ncbi.nlm.nih.gov/ geo/query/acc.cgi?acc = GSE43038). Protein expression profiles and analysis
Sample preparation, 2D-gel electrophoresis, LC-MS peptide analysis and database searching were all performed as previously described [65]. Briefly, duplicate technical replicates of pooled aliquots of protein (50 μg per treatment, representing protein pooled from the 6 mice per treatment group used for microarray analysis) were labeled with 200 pmol CyDyes (GE Healthcare) as per manufacturer’s instructions. In all cases, HF-low-low mice were labeled with Cy2 and HF-low-suf samples were labeled with Cy5. Each control and test pair was mixed to give 100 μg of protein and run on the same first dimension strip, which (along with equilibration, second dimension, scanning, and staining) was performed as previously described [65]. Spot detection, warping, and statistical analysis were performed using Delta2D 4.2 software from Decodon (Greifswald, Germany). For accurate spot detection, settings were chosen according to manufacturer’s instructions (Decodon). Gel images were first warped using a combination of the ‘exact’ warping setting with additional manual vector adjustment. A fusion gel image was created using the ‘union’ mode (a weighted mean across the gel series). Spot detection on the fusion gel was performed automatically by the software, and manual editing was used to create the end product, spot boundaries from which were then transferred to all gels in the series. Normalised values following background subtraction were calculated by the software and a ratio of normalised volumes to that of the parent gel was used for quantitative analysis of protein expression level. Differentially expressed proteins were only flagged as significant where the fold abundance was greater than 2, and the t-test value was greater than 95%. Digestion of the differentially expressed proteins for subsequent identification was carried out as previously described [65]. Tryptic peptides were separated and analyzed using an Ettan multidimensional liquid chromatography system (GE Healthcare) coupled to an LTQ linear ion trap mass spectrometer with a nano-spray ionization interface (ThermoQuest, Finnigan, San Jose, CA, USA) [66]. MS/ MS data were analyzed using TurboSEQUEST protein identification software [67,68] and spectra were searched against the National Center for Biotechnology Information (NCBI) Mus musculus database. All matched peptides were confirmed by visual examination of the spectra. Functional analysis of proteins
Functional classification of proteins was based on GeneOntology using the Mouse Genome Informatics (MGI) database (http://www.informatics.jax.org/), the
Bermingham et al. BMC Medical Genomics 2013, 6:7 http://www.biomedcentral.com/1755-8794/6/7
Kyoto Encyclopedia of Genes and Genomes (KEGG) encyclopedia (http://www.genome.jp/kegg/genes.html), and Ingenuity Pathways Analysis (IPA) (Ingenuity Systems, http://www.ingenuity.com/), as previously described [66]. Global DNA methylation and histone modifications
Genomic DNA extracted from the colon and liver tissues was used to determine global DNA methylation using high performance liquid chromatography (HPLC) as described previously [69]. Briefly, 50 μg genomic DNA was treated with RNase enzymes to remove contaminating RNA, then enzymatically hydrolysed to mononucleotides. The samples were run on the HPLC and detected at an absorbance of 280 nm. The relative amounts of methylated and unmethylated cytosine were determined using the area under the peak for each nucleotide. In order to assess the effects of adequate levels of selenium and folate supplementation on histone modifications profiles in the liver previously reported methods [70,71] were modified in order to significantly increase the concentration of nuclear proteins by combining both the nuclear pellet and supernatant. 50 mg of frozen tissue was homogenised in 0.5 ml of ice-cold low salt extraction buffer (10 mM HEPES (pH 7.9), 10 mM KCl, 1.5 mM MgCl2, 1 mM DTT, 5 mM sodium butyrate, 20 mM NaF and a complete protease inhibitor cocktail (Roche)) and incubated on ice for 15 min. Igepal was added to a final concentration of 0.1% and incubated for a further 20 min on ice. Pellets remaining after centrifugation (17 500 × g, 5 min, 4°C) were washed four times with low salt extraction buffer then resuspended in 150 μl of ice-cold high salt extraction buffer (920 mM HEPES (pH 7.9), 420 mM NaCl, 1.5 mM MgCl2, 0.2 mM EDTA, 5 mM sodium butyrate, 1 mM DTT, 20 mM NaF and a complete protease inhibitor cocktail). Samples were incubated on ice for 30 min using a rocking platform and centrifuged at 17 500 × g, 4°C for 15 min. The supernatant was collected and stored on ice while the pellet was resuspended in a minimal volume of precipitation buffer (50 mM Tris–HCl (pH 7.6), 10 mM NaCl, 2 mM EDTA, 1 mM PMSF, 10 μg/ml aprotinin, 1% Igepal, 5 mM sodium butyrate and DNAse to a final concentration of 5 μg/mL), incubated for 30 minutes at room temperature to degrade genomic DNA, and centrifuged (17 500 × g, 4°C, 1 min). This supernatant was added to the previous supernatant and stored at −80°C for further studies. Protein concentration was determined using the Thermo Scientific Pierce Coomassie (Bradford) Protein Assay Kit according to the manufacturer’s instructions (Thermofisher Scientific Inc., Rockford, Illinois, USA). Western blot analysis was performed in triplicate on nuclear protein extracts (20 μg) isolated from liver using
Page 14 of 18
polyclonal anti-acetylated histone 3 (lys9 (H3K9ac); Cell Signaling Technology, Inc., Danvers, Massachusetts, USA), and polyclonal anti-dimethylated histone 3 (lys9 (H3K9me2); Cell Signaling) antibodies. Equal loading of samples was confirmed by staining with coomassie blue (Simply Blue™ Safestain, Invitrogen, Carlsbad, California, USA). Films were scanned and bands analysed using the ImageJ software to determine the average peak density. Statistical analysis of results was performed using a two tailed Student’s t-Test. Correlation analysis between values for the two types of histone modification was performed using the Spearman rho correlation coefficient. Gene specific DNA methylation
Microarray data showed consistent increased Slc22a4 mRNA abundance due to selenium and folate supplementation, with 8 separate probes for this gene on the array showing a >2-fold down-regulation (range −2.10 to −2.39) therefore this gene was chosen to investigate the effects of post-weaning selenium and folate supplement on genespecific DNA methylation in mice fed high-fat diets. Genomic DNA was purified from liver tissue using the AllPrepW DNA/RNA/Protein mini kit as described above. Quantitative analysis of DNA methylation of Slc22a4 was performed using the Sequenom MassARRAY Compact System (http://www.sequenom.com/). Briefly, this involves the gene-specific amplification of bisulfite-treated DNA, followed by in vitro transcription and analysis by matrix-assisted laser desorption ionization time-of-flight (MALDI-TOF) mass spectrometry [72]. 1 μg of DNA was bisulfite-converted using an EZ DNA Methylation kit (Zymo Research, Irvine, California, USA). Sequenom EpiDesigner software was used to design PCR primers specific for bisulfite-converted DNA. Each reverse primer contained a T7-promoter tag for in vitro transcription (50-cagtaatacgactcactatagggagaaggct-30), and the forward primer was tagged with a 10mer to balance Tm (50-aggaagagag-30). Two sets of primer pairs were designed, generating two amplicons: one of 374 bases (referred to as “pp_27”) encompassing the transcription start site of the Slc22a4 gene and including part of a CpG island within that region, and a second of 323 bases (“pp_46”) 976 base pairs upstream of the transcription start site and immediately upstream of a CpG island in that region. Details of the primer pairs are shown in Table 4, and their positions relative to the Slc22a4 transcription start site are shown in Figure 4. Bisulfite-treated DNA was PCR amplified (Qiagen HotStar Taq Polymerase; Bio-Strategy Ltd, Auckland, NZ) and treated with Shrimp Alkaline Phosphatase (Sequenom, Queensland, Australia), heat inactivated, and a simultaneous in vitro transcription/uracil-cleavage reaction was carried out. Transcription cleavage products were desalted and spotted on a 384-pad SpectroCHIP (Sequenom) using a MassARRAY nanodispenser (Samsung). Mass spectra
Bermingham et al. BMC Medical Genomics 2013, 6:7 http://www.biomedcentral.com/1755-8794/6/7
Page 15 of 18
Table 4 Primers for sequenom analysis of CpG methylation of the Slc2a4 promoter region Amplicon ID Genomic co-ordinates
mus_Slc2a4_pp27
mus_Slc2a4_pp46
chr11:69761390-69761763
chr11:69762346-69762668
Strand
–
–
Length
374
323
CCTGGCCAATGGGTGTT
Sequence
GTGAAGGGCGTGTCCTA
GGGAAGGGTTAATAGAA
TGGCGGGGCGGGAGTGG
GAGAGCCACCCCAGAA
GGAGGTGGCTTCAGCTCT
GTTAGCTACCCTGGTGC
CCGCATCTTTCCCCCTCA
AATCCACTAAGGTTCCT
AGCGGGTCTCACTAGAT
CGCTCTCCCTCTAGGTG
CCCGGAGAGCCTTGGTG
GCGCCAGAAGCCTTGC
CTCTCCGGTTCCGTGGGT
ACTTCTCTTGGGCCTTTT
TGTGGCAGTGAGTCCCAC
TCTGAATTGAGCTCTCTC
CAGACCCGCCCTTTGCAC
TCCACATTCTTCGCCAGC
ACGGCTTCCGAACGCCGG
TCTCTCCCTGGACGTGCTT
GGTCTCGTGCCGGCCAG
AGGTCGTGCCCTCTCAGCT
GCCCGGACCCTATACCC
GTAGACCCAAAACAGTAG
TATTCATTTTTTTCTTAT
CTGACTCTGGAAAGCTTGT
TGCAGCGCCTGAGTCTT
CGCCCACGCGGCCAGCACA
TTCTTCTTTTAAAACAAG
TGCCTGGAGGCTCAGGGA
ATGCCGTCGGGTTTCCAG
CTTCAGGGAGGGTGGTGT
CAGATCGGCTCTGACGTAA
GACTGGCGTGAGCACCTG
GGTTCAGCATACCGGGGC
TCCCTTGGGTCCCCTCCAAGA
GAATTGGGAAATCTGGTC CAGTTTTTCTTGGGCTGAGTT Left primer length Left primer sequence Right primer length
Right primer sequence
23
27
aggaagagagTTTGGTTAAT
aggaagagagGGGAAGGGTTA
GGGTGTTGTGAAG
ATAGAAGAGAGTTATT
25
25
cagtaatacgactcactatagggagaag
cagtaatacgactcactatagggagaagg
gctAACTCAACCCAAAAAA
ctTCTTAAAAAAAACCCAA
AACTAAACC
AAAACAAA
were acquired using a MassARRAY MALDI-TOF MS (Bruker-Sequenom) and peak detection, signal-to-noise calculations and quantitative CpG site methylation analysis were performed using proprietary EpiTyper software v1.0.5 (Sequenom). For fragments containing a single CpG site, DNA methylation state was calculated by the ratio of methylated to un-methylated fragments. For cleavage products containing multiple CpG sites the average methylation status of the fragment is reported. Analysis of liver selenium
Liver selenium content was measured using HNO3/ HClO4 digestion, followed by hydride generation atomic absorption spectroscopy. Analysis was performed by
Eurofins New Zealand (Ruakura Research Centre, Hamilton, New Zealand; http://www.eurofins.co.nz/). Statistical analysis
Food intake and bodyweight data were analysed using the Residual Maximum Likelihood (REML) method with a Repeated Measurements Model fitted (GenStat Release 12.2). Global DNA methylation data and liver selenium data were compared using analysis of variance (ANOVA; GenStat Version 9). Gene-specific methylation data was analysed using REML (GenStat Release 14.1). Additional statistical analyses were performed as described for the specific method in question. All data relate to n = 6 mice per treatment. This is because data from our previous
Bermingham et al. BMC Medical Genomics 2013, 6:7 http://www.biomedcentral.com/1755-8794/6/7
studies [73,74] have demonstrated that microarray analysis of RNA obtained from either 5 or 6 individual mice per treatment is sufficient to robustly identify differentially expressed transcripts. We therefore used RNA from 6 animals in each treatment group for microarray analysis in the current study, and used data derived from these mice for all other analyses.
Additional files Additional file 1: Table S1. Differentially expressed genes in the colon of mice supplemented with adequate levels of selenium and folate postweaning (n = 6 per treatment). A positive fold change indicates that supplementation increased the expression of the gene. Additional file 2: Table S2. Differentially expressed genes in the liver of mice supplemented with adequate levels of selenium and folate postweaning (n = 6 per treatment). A positive fold change indicates that supplementation increased the expression of the gene. Additional file 3: Figure S1. 2D-DIGE gel representing differentially expressed proteins identified in the liver tissue of female C57 mouse fed a high-fat diet supplemented with adequate selenium and folate (HF-low-suf) born to mothers fed a high-fat diet without supplementation, compared to female offspring maintained on the unsupplemented diet (HF-low-low). Protein annotations are shown in Figure 1 of the main text. The approximate pI and molecular weight (MW) in kDa are given on the x and y axes, respectively. Additional file 4: Table S3. Composition of diets used to determine the effects of post-weaning supplementation with adequate levels of selenium and folate in mice fed high-fat diets. Competing interests The authors declare that they have no competing interests. Authors’ contributions ENB conducted the research. Laboratory and/or data analysis was conducted by: SAB (histone modifications), ENB and WY (gene expression profiles), JMC, DTB, WAL (protein expression profiles), gene-specific DNA methylation (MPGB) ENB, MPGB, WCM and NCR designed the study. ENB, SB, MPGB, JMC, NCR and WY contributed to the writing of this paper. All authors read and approved the final manuscript. Authors’ information Emma N Bermingham, Shalome A Bassett, Wayne Young, Nicole C Roy, Warren C McNabb, Janine M Cooney, Di T Brewster, William A Laing and Matthew PG Barnett: Nutrigenomics, New Zealand (http://www.nutrigenomics.org.nz/). Acknowledgements This research was supported by the New Zealand Foundation for Research, Science & Technology (FRST) contracts C02X0403 and C10X0701, and The New Zealand Ministry for Science & Innovation (MSI) contract C11X1009. E.N. B. was supported by a FRST Postdoctoral Fellowship (AGRX0703) during the course of these studies. The authors thank Kelly Armstrong, Kelly Dunstan, Zaneta Park, Jason Peters, Leigh Ryan, Quentin Sciascia, Bruce Sinclair, Cameron McLean (AgResearch), Leticia Castro (The University of Auckland) and Dwayne Jensen (Plant & Food Research) for technical support, and Anar Khan, Scott Knowles and Anna Russ (AgResearch) for critical evaluation of the manuscript. We also thank Helge Dzierzon (Plant & Food Research) for assistance with submission of the microarray data to GEO. The work described in this paper is part of Nutrigenomics New Zealand, a collaboration between AgResearch Limited, Plant & Food Research and The University of Auckland, which is largely funded by The New Zealand Ministry of Business, Innovation, and Employment, and its predecessors MSI and FRST. Author details 1 Food Nutrition & Health Team, Food & Bio-based Products Group, AgResearch Grasslands, Palmerston North 4442, New Zealand. 2Riddet
Page 16 of 18
Institute, Massey University, Palmerston North 4442, New Zealand. AgResearch Grasslands, Palmerston North 4442, New Zealand. 4Biological Chemistry & Bioactives, Food Innovation, Plant & Food Research Ruakura, Hamilton 3240, New Zealand. 5Biological Chemistry & Bioactives, Food Innovation, Plant & Food Research Mt Albert, Auckland 1025, New Zealand.
3
Received: 11 June 2012 Accepted: 18 February 2013 Published: 5 March 2013
References 1. Gluckman PD, Lillycrop KA, Vickers MH, Pleasants AB, Phillips ES, Beedle AS, Burdge GC, Hanson MA: Metabolic plasticity during mammalian development is directionally dependent on early nutritional status. Proc Natl Acad Sci USA 2007, 104(31):12796–12800. 2. Martin-Subero JI: How epigenomics brings phenotype into being. Pediatr Endocrinol Rev 2011, 9(Suppl 1):506–510. 3. Migliore L, Coppede F: Genetics, environmental factors and the emerging role of epigenetics in neurodegenerative diseases. Mutat Res 2009, 667(1–2):82–97. 4. Quintero-Ronderos P, Montoya-Ortiz G: Epigenetics and autoimmune diseases. Autoimmune Dis 2012, 2012:593720. 5. Cooney CA, Dave AA, Wolff GL: Maternal methyl supplements in mice affect epigenetic variation and DNA methylation of offspring. J Nutr 2002, 132(8):2393S–2400S. 6. Wolff GL, Kodell RL, Moore SR, Cooney CA: Maternal epigenetics and methyl supplements affect agouti gene expression in Avy/a mice. FASEB J 1998, 12(11):949–957. 7. Katada S, Imhof A, Sassone-Corsi P: Connecting threads: epigenetics and metabolism. Cell 2012, 148(1–2):24–28. 8. Li CC, Cropley JE, Cowley MJ, Preiss T, Martin DI, Suter CM: A sustained dietary change increases epigenetic variation in isogenic mice. PLoS Genet 2011, 7(4):e1001380. 9. Barnett MPG, Bassett SA, Bermingham EN: Epigenetics – what role could this play in functional foods and personalized nutrition? In Nutrigenetics and nutrigenomics in functional foods and personalised nutrition. Edited by Ferguson LR. Kentucky: CRC Press; 2012 (accepted). ISBN 9781439876800. 10. Mathers JC: Session 2: Personalised Nutrition: Epigenomics: a basis for understanding individual differences? Proc Nutr Soc 2008, 67:390–394. 11. Cordain L, Eaton SB, Sebastian A, Mann N, Lindeberg S, Watkins BA, O’Keefe JH, Brand-Miller J: Origins and evolution of the western diet: health implications for the 21st century. Am J Clin Nutr 2005, 81:341–354. 12. McCann JC, Ames BN: Vitamin K, an example of triage theory: is micronutrient inadequacy linked to diseases of aging? Am J Clin Nutr 2009, 90(4):889–907. 13. Thomson CD, Robinson MF: The changing selenium status of New Zealand residents. Eur J Clin Nutr 1996, 50(2):107–114. 14. Esworthy RS, Yang L, Frankel PH, Chu FF: Epithelium-specific glutathione peroxidase, Gpx2, is involved in the prevention of intestinal inflammation in selenium-deficient mice. J Nutr 2005, 135(4):740–745. 15. Russell D, Parnell W, Wilson N: NZ Food: NZ People. Key results of the, 1997 National Nutrition Survey. Wellington, NZ: Ministry of Health; 1997. 1999. 16. Davis CD, Uthus EO: DNA methylation, cancer susceptibility, and nutrient interactions. Exp Biol Med 2004, 229:988–995. 17. Barnett M, Bermingham E, McNabb W, Bassett S, Armstrong K, Rounce J, Roy N: Investigating micronutrients and epigenetic mechanisms in relation to inflammatory bowel disease. Mutat Res 2010, 690(1–2):71–80. 18. Waterland RA, Jirtle RL: Transposable elements: targets for early nutritional effects on epigenetic gene regulation. Mol Cell Biol 2003, 23(15):5293–5300. 19. Waterland RA: Epigenetic mechanisms and gastrointestinal development. J Pediatr 2006, 149(5 Suppl):S137–142. 20. Lu Q, Qiu X, Hu N, Wen H, Su Y, Richardson B: Epigenetics, disease, and theraputic interventions. Ageing Res Rev 2006, 5:449–467. 21. Adcock IM, Lee KY: Abnormal histone acetylase and deacetylase expression and function in lung inflammation. Inflammation Res 2006, 55:311–321. 22. Lu Q, Qiu X, Hu N, Wen H, Su Y, Richardson BC: Epigenetics, disease, and therapeutic interventions. Ageing Res Rev 2006, 5(4):449–467. 23. Cheung P, Lau P: Epigenetic regulation by histone methylation and histone variants. Mol Endocrinol 2005, 19:563–573.
Bermingham et al. BMC Medical Genomics 2013, 6:7 http://www.biomedcentral.com/1755-8794/6/7
24. Radford EJ, Isganaitis E, Jimenez-Chillaron J, Schroeder J, Molla M, Andrews S, Didier N, Charalambous M, McEwen K, Marazzi G, et al: An unbiased assessment of the role of imprinted genes in an intergenerational model of developmental programming. PLoS Genet 2012, 8(4):e1002605. 25. Ruegg J, Cai W, Karimi M, Kiss NB, Swedenborg E, Larsson C, Ekstrom TJ, Pongratz I: Epigenetic regulation of glucose transporter 4 by estrogen receptor beta. Mol Endocrinol 2011, 25(12):2017–2028. 26. Yokomori N, Tawata M, Onaya T: DNA demethylation during the differentiation of 3 T3-L1 cells affects the expression of the mouse GLUT4 gene. Diabetes 1999, 48(4):685–690. 27. Fagan A, Culhane AC, Higgins DG: A multivariate analysis approach to the integration of proteomic and gene expression data. Proteomics 2007, 7(13):2162–2171. 28. Ma L, Steindal AE, Juzeniene A, Iani V, Moan J: The effect of folic acid on porphyrin synthesis in tumors and normal skin of mice treated with 5aminolevulinic acid or methyl 5-aminolevulinate. Photochem Photobiol Sci 2006, 5(8):755–759. 29. Iyer R, Tomar SK: Dietary effect of folate-rich fermented milk produced by Streptococcus thermophilus strains on hemoglobin level. Nutrition 2011, 27(10):994–997. 30. Kuhbacher M, Bartel J, Hoppe B, Alber D, Bukalis G, Brauer AU, Behne D, Kyriakopoulos A: The brain selenoproteome: priorities in the hierarchy and different levels of selenium homeostasis in the brain of seleniumdeficient rats. J Neurochem 2009, 110(1):133–142. 31. Chanson A, Sayd T, Rock E, Chambon C, Sante-Lhoutellier V: Potier de Courcy G, Brachet P: Proteomic analysis reveals changes in the liver protein pattern of rats exposed to dietary folate deficiency. J Nutr 2005, 135(11):2524–2529. 32. Schaible TD, Harris RA, Dowd SE, Smith CW, Kellermayer R: Maternal methyl-donor supplementation induces prolonged murine offspring colitis susceptibility in association with mucosal epigenetic and microbiomic changes. Hum Mol Genet 2011, 20(9):1687–1696. 33. Kim KC, Jang H, Sauer J, Zimmerly EM, Liu Z, Chanson A, Smith DE, Friso S, Choi SW: Folate supplementation differently affects uracil content in DNA in the mouse colon and liver. Br J Nutr 2011, 105(5):688–693. 34. Davis C, Uthus E: Dietary folate and selenium affect dimethylhydrazineinduced aberrant crypt formation, global DNA methylation and onecarbon metabolism in rats. J Nutr 2003, 133:2907–2914. 35. Zeng H, Yan L, Cheng W-H, Uthus EO: Dietary Selenomethionine Increases Exon-Specific DNA Methylation of the p53 Gene in Rat Liver and Colon Mucosa. J Nutr 2011, 141(8):1464–1468. 36. Singal R, Ginder GD: DNA Methylation. Blood 1999, 93(12):4059–4070. 37. Ly A, Hoyt L, Crowell J, Kim YI: Folate and DNA Methylation. Antioxid Redox Signal 2012, 17(2):302–326. 38. Boeke CE, Baccarelli A, Kleinman KP, Burris HH, Litonjua AA, Rifas-Shiman SL, Tarantini L, Gillman M: Gestational intake of methyl donors and global LINE-1 DNA methylation in maternal and cord blood: prospective results from a folate-replete population. Epigenetics 2012, 7(3):253–260. 39. McKay JA, Williams EA, Mathers JC: Effect of maternal and post-weaning folate supply on gene-specific DNA methylation in the small intestine of weaning and adult apc and wild type mice. Front Genet 2011, 2:23. 40. McKay JA, Wong YK, Relton CL, Ford D, Mathers JC: Maternal folate supply and sex influence gene-specific DNA methylation in the fetal gut. Mol Nutr Food Res 2011, 55(11):1717–1723. 41. Widiker S, Karst S, Wagener A, Brockmann GA: High-fat diet leads to a decreased methylation of the Mc4r gene in the obese BFMI and the lean B6 mouse lines. J Appl Genet 2010, 51(2):193–197. 42. Godler DE, Slater HR, Bui QM, Ono M, Gehling F, Francis D, Amor DJ, Hopper JL, Hagerman R, Loesch DZ: FMR1 intron 1 methylation predicts FMRP expression in blood of female carriers of expanded FMR1 alleles. J Mol Diagn 2011, 13(5):528–536. 43. Mostovich LA, Prudnikova TY, Kondratov AG, Loginova D, Vavilov PV, Rykova VI, Sidorov SV, Pavlova TV, Kashuba VI, Zabarovsky ER, et al: Integrin alpha9 (ITGA9) expression and epigenetic silencing in human breast tumors. Cell Adh Migr 2011, 5(5):395–401. 44. Xue Q, Zhou YF, Zhu SN, Bulun SE: Hypermethylation of the CpG island spanning from exon II to intron III is associated with steroidogenic factor 1 expression in stromal cells of endometriosis. Reprod Sci 2011, 18(11):1080–1084. 45. Zheng S, Rollet M, Pan YX: Protein restriction during gestation alters histone modifications at the glucose transporter 4 (GLUT4) promoter
Page 17 of 18
46.
47.
48.
49.
50.
51.
52. 53.
54.
55.
56.
57.
58.
59.
60.
61.
62.
63. 64.
region and induces GLUT4 expression in skeletal muscle of female rat offspring. J Nutr Biochem 2011. Nov 11. [Epub ahead of print]. Xiang N, Zhao R, Song G, Zhong W: Selenite reactivates silenced genes by modifying DNA methylation and histones in prostate cancer cells. Carcinogenesis 2008, 29(11):2175–2181. Pogribny IP, Tryndyak VP, Bagnyukova TV, Melnyk S, Montgomery B, Ross SA, Latendresse JR, Rusyn I, Beland FA: Hepatic epigenetic phenotype predetermines individual susceptibility to hepatic steatosis in mice fed a lipogenic methyl-deficient diet. J Hepatol 2009, 51(1):176–186. Dobosy JR, Fu VX, Desotelle JA, Srinivasan R, Kenowski ML, Almassi N, Weindruch R, Svaren J, Jarrard DF: A methyl-deficient diet modifies histone methylation and alters Igf2 and H19 repression in the prostate. Prostate 2008, 68(11):1187–1195. McKay JA, Waltham KJ, Williams EA, Mathers JC: Folate depletion during pregnancy and lactation reduces genomic DNA methylation in murine adult offspring. Genes Nutr 2011, 6(2):189–196. Hurt HD, Cary EE, Visek WJ: Growth, reproduction, and tissue concentrations of selenium in the selenium-depleted rat. J Nutr 1971, 101(6):761–766. Oh SH, Park KK, Kim SY, Lee KJ, Lee YH: Evaluation of chemopreventive effect of dietary selenium-rich egg on mouse skin tumor induced by 2'(4-nitrophenoxy)oxirane and 12-O-tetradecanoylphorbol-13-acetate. Carcinogenesis 1995, 16(12):2995–2998. Martin H, Comeskey D: Folate measurement in mammalian tissues by fluorescence polarization. Pteridines 2011, 22:105–110. Joseph SB, McKilligin E, Pei L, Watson MA, Collins AR, Laffitte BA, Chen M, Noh G, Goodman J, Hagger GN, et al: Synthetic LXR ligand inhibits the development of atherosclerosis in mice. Proc Natl Acad Sci USA 2002, 99(11):7604–7609. Bradley MN, Hong C, Chen M, Joseph SB, Wilpitz DC, Wang X, Lusis AJ, Collins AR, Hsueh WA, Collins JL, et al: Ligand activation of LXRβ reverses atherosclerosis and cellular cholesterol overload in mice lacking LXRα and apoE. J Clin Invest 2007, 117:2337–2346. Ghoshal K, Li X, Datta J, Bai S, Pogribny I, Poribnh M, Huang Y, Young D, Jacob S: A folate- and methyl-deficient diet alters the expression of DNA methyltransferases and methyl CpG binding proteins invlolved in epigenetic gene silencing in livers of F344 rats. J Nutr 2006, 136:1522–1527. Thompson KM, Haibach H, Evenson JK, Sunde RA: Liver Selenium and Testis Phospholipid Hydroperoxide Glutathione Peroxidase Are Associated with Growth during Selenium Repletion of SecondGeneration Se-Deficient Male Rats. J Nutr 1998, 128:1289–1295. Watkins AJ, Wilkins A, Cunningham C, Perry VH, Seet MJ, Osmond C, Eckert JJ, Torrens C, Cagampang FRA, Cleal J, et al: Low protein diet fed exclusively during mouse oocyte maturation leads to behavioural and cardiovascular abnormalities in offspring. J Physiol 2008, 586(8):2231–2244. Sarmento OF, Digilio LC, Wang Y, Perlin J, Herr JC, Allis CD, Coonrod SA: Dynamic alterations of specific histone modifications during early murine development. J Cell Sci 2004, 117(19):4449–4459. Park EI, Paisley EA, Mangian HJ, Swartz DA, Wu M, O’Morchoe PJ, Behr SR, Visek WJ, Kaput J: Lipid Level and Type Alter Stearoyl CoA Desaturase mRNA Abundance Differently in Mice with Distinct Susceptibilities to Diet-Influenced Diseases. J Nutr 1997, 127(4):566–573. Knoch B, Barnett MPG, Zhu S, Park ZA, Nones K, Dommels YEM, Knowles SO, McNabb WC, Roy NC: Genome-wide analysis of dietary eicosapentaenoic acid- and oleic acid-induced modulation of colon inflammation in interleukin-10 gene-deficient mice. J Nutrigenet Nutrigenomics 2009, 2:9–28. Roy NC, Barnett MPG, Knoch B, Dommels YEM, McNabb WC: Nutrigenomics applied to an animal model of Inflammatory Bowel Diseases: transcriptomic analysis of the effects of eicosapentaenoic acid- and arachidonic acid-enriched diets. Mutat Res 2007, 622(1–2):103–116. Smyth GK: Limma: linear models for microarray data. In Bioinformatics and Computational Biology Solutions using R and Bioconductor. Edited by Gentleman R, Carey V, Dudoit S, Irizarry R, Huber W. New York: Springer; 2005:397–420. Falcon S, Gentleman R: Using GOstats to test gene lists for GO term association. Bioinformatics 2007, 23(2):257–258. Edgar R, Domrachev M, Lash AE: Gene Expression Omnibus: NCBI gene expression and hybridization array data repository. Nucleic Acids Res 2002, 30(1):207–210.
Bermingham et al. BMC Medical Genomics 2013, 6:7 http://www.biomedcentral.com/1755-8794/6/7
Page 18 of 18
65. Knoch B, Barnett MP, Cooney J, McNabb WC, Barraclough D, Laing W, Roy NC: Dietary oleic acid as a control fatty acid for polyunsaturated fatty acid intervention studies: a transcriptomics and proteomics investigation using interleukin-10 gene-deficient mice. Biotechnol J 2010, 5(11):1226–1240. 66. Cooney JM, Barnett MP, Brewster D, Knoch B, McNabb WC, Laing WA, Roy NC: Proteomic analysis of colon tissue from interleukin-10 gene-deficient mice fed polyunsaturated Fatty acids with comparison to transcriptomic analysis. J Proteome Res 2012, 11(2):1065–1077. 67. Eng JK, McCormack AL, Yates Iii JR: An approach to correlate tandem mass spectral data of peptides with amino acid sequences in a protein database. J Am Soc Mass Spectrom 1994, 5(11):976–989. 68. Yates JR 3rd, Eng JK, McCormack AL, Schieltz D: Method to correlate tandem mass spectra of modified peptides to amino acid sequences in the protein database. Anal Chem 1995, 67(8):1426–1436. 69. Armstrong KM, Bermingham EN, Bassett SA, Treloar BP, Roy NC, Barnett MP: Global DNA methylation measurement by HPLC using low amounts of DNA. Biotechnol J 2011, 6(1):113–117. 70. Glauben R, Batra A, Stroh T, Erben U, Fedke I, Lehr HA, Leoni F, Mascagni P, Dinarello CA, Zeitz M, et al: Histone deacetylases: novel targets for prevention of colitis-associated cancer in mice. Gut 2008, 57(5):613–622. 71. Kis A, Yellon DM, Baxter GF: Role of nuclear factor-κB activation in acute ischaemia-reperfusion injury in myocardium. Br J Pharmacol 2003, 138:894–900. 72. Ehrich M, Nelson MR, Stanssens P, Zabeau M, Liloglou T, Xinarianos G, Cantor CR, Field JK, van den Boom D: Quantitative high-throughput analysis of DNA methylation patterns by base-specific cleavage and mass spectrometry. Proc Natl Acad Sci USA 2005, 102:15785–15790. 73. Barnett MP, McNabb WC, Cookson AL, Zhu S, Davy M, Knoch B, Nones K, Hodgkinson AJ, Roy NC: Changes in colon gene expression associated with increased colon inflammation in interleukin-10 gene-deficient mice inoculated with Enterococcus species. BMC Immunol 2010, 11:39. 74. Knoch B, Barnett MP, McNabb WC, Zhu S, Park ZA, Khan A, Roy NC: Dietary arachidonic acid-mediated effects on colon inflammation using transcriptome analysis. Mol Nutr Food Res 2010, 54(Suppl 1):S62–74. doi:10.1186/1755-8794-6-7 Cite this article as: Bermingham et al.: Post-weaning selenium and folate supplementation affects gene and protein expression and global DNA methylation in mice fed high-fat diets. BMC Medical Genomics 2013 6:7.
Submit your next manuscript to BioMed Central and take full advantage of: • Convenient online submission • Thorough peer review • No space constraints or color figure charges • Immediate publication on acceptance • Inclusion in PubMed, CAS, Scopus and Google Scholar • Research which is freely available for redistribution Submit your manuscript at www.biomedcentral.com/submit