Poster: A Visual Survey of Tree Visualization
1
Susanne J¨ urgensmann∗
Hans-J¨org Schulz†
University of Rostock
University of Rostock
Introduction
The number of available visualization techniques grows with each year’s Visweek, EuroVis, and PacificVis conferences. This is promising, as it shows that 20 years after the field of Information Visualization started to take shape, there is still room for plenty of new developments and improvements. Yet with each newly developed visualization technique, it becomes more and more challenging for users and visualization researchers alike to maintain an overview of the vast numbers of available visualizations. As a result, we see many re-inventions of already existing visualizations that simply were not known to the re-inventors. Hence, the more mature the field of visualization grows and the more techniques are developed, the more the need arises to survey and keep track of them. This need to catalogue and consolidate the “visualization zoo” [2] is underlined by a recent surge of survey articles, such as [4, 1, 3] just for the subdomain of graph visualization alone. This poster adds on to this list, by specifically targeting tree visualizations in all their facets – not only from scholarly publications, but also interesting variants from blog entries, flickr galleries, and newspaper articles throughout the internet. The result and main contribution of this poster is the poster itself, which features 105 tree visualization techniques and classifies them in a number of different ways, e.g., by dimensionality or edge representation. Additionally, the poster serves as a handy tool to quickly look-up the original source of a technique on the internet, as the PDF of the poster includes a hyperlink for each technique that leads directly to the respective paper or website it stems from. The poster can be freely downloaded in high resolution for printing or in lower resolution to be used as a visual on-screen bibliography from http://treevis.shows.it 2
The Survey
Building on the gallery of 40 implicit tree visualization techniques in [3], this visual survey adds visualizations beyond the realm of implicit ones: explicit, node-link tree visualizations, hybrid tree visualizations, and special purpose tree visualizations that were developed for particular output devices (e.g., tabletops or handhelds) or input data (e.g., space- or time-dependent trees). The collection of the numerous techniques and their references was manually conducted: conference proceedings from the fields of information visualization and graph drawing were scanned for tree visualization techniques. If a paper was found, its references were searched for papers/techniques so far not included, and the web was searched for other tree visualization papers referencing the found paper – in the hope to produce some kind of a transitive closure. On top of that, the internet was also searched for common terms surrounding tree visualizations and typical applications, such as “genealogy visualization” or “family tree visualization” for the field of ancestry research, which yielded additional, mostly unpublished tree visualizations. While the resulting list of visualizations ∗ e-mail: † e-mail:
[email protected] [email protected]
is certainly far from exhaustive, to our knowledge all the major, well-known examples as of today are included. The collection of tree visualizations was then categorized by hand into a hierarchy of different visualization properties: • edge representation (explicit, implicit, hybrid): on the top level, we divided the visualizations according to whether they utilize explicitly drawn links between the nodes, or not. Hence, the category explicit contains node-link visualization, the category implicit contains Treemap- and Sunburst-style visualizations, and visualizations mixing both in one representation are considered as hybrid. • alignment (radial, axis-parallel, free): the visualizations were further subdivided by the layout alignment they employ – either a radial layout with the tree’s root in the center and the children positioned mostly on a circular or spherical range around it, or an axis-parallel layout that adheres to the Cartesian screen coordinates and usually maps the levels (and thus the height of each node) onto one axis, and the width of the tree onto the other axis. Free layouts often follow more complex alignment strategies, such as space filling curves, or they do not adhere to any alignment at all. • dimensionality (2D, 3D, hybrid): dimensionality is probably the most controversial property of visualizations. While most visualization experts disregard 3D techniques for serious use, the number of 3D tree visualizations and the research community’s continued interest in them tells another story. We acknowledge this by not only including them in this survey, but also by making this the third important distinction in our classification scheme. As diverse as the collected visualization techniques are, these three visual properties seem to influence their design most significantly. A further refinement, e.g., into their applicability for rooted and unrooted trees, would certainly be possible, but rather obfuscate the structured, high-level overview gained from the subdivision along these most notable considerations in tree visualization design. The general tree visualizations stand at the core of this survey. Additional tree visualization techniques, which go beyond showing the plain tree structure, have been added on top of these. They depict special-purpose tree visualizations – each with an explicit and an implicit example: • • • • • • • •
tree visualizations specifically adapted to handhelds, tree visualizations developed for tabletop devices, tree visualizations for time-dependent trees, tree visualizations for spatially referenced trees, tree visualizations utilized for document or text visualization, tree visualizations showing multiple trees for comparison, tree visualizations for trees with additional cross-edges, tree visualizations being embedded in other visualizations or vice versa.
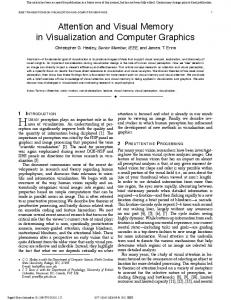
As a result, the survey gives a good overview on the variety of tree visualization for different design properties and also a first glimpse of the many other design considerations needed in real-world application scenarios, where trees are often changing over time or must be fitted on the tiny display of a handheld device. A scaled-down preview of the survey is provided in Figure 1.
Figure 1: Our visual survey as of 29-JUN-2010. The core of pure tree visualizations and their classification is shown in the middle. Additional techniques that visualize, e.g., time-dependent or space-dependent tree structures are arranged around it.
3 Conclusion With this poster we have collected the majority of two decades of research on tree visualization. The poster can be used for a number of purposes, such as: • • • • •
teaching the field of tree visualizations, identifying related work to one’s own ideas, looking-up bibliographical references, determining open research questions, showing domain experts their options.
For the future, we plan to keep the electronic version of this poster regularly updated, so that tree visualization techniques yet to be invented will be reflected in upcoming versions of this visual survey. Besides the actual poster, we also provide the corresponding bibliography with currently some 100+ entries in PDF and BibTeX-format on the website, which will be updated with the poster: http://treevis.shows.it
Acknowledgements The authors wish to thank the anonymous reviewer of [3] who suggested the idea for this poster, Steffen Hadlak for double checking it, as well as the EU Coordination Project “VisMaster” for supporting it. References [1] M. Graham and J. Kennedy. A survey of multiple tree visualisation. Information Visualization, 2010. to appear. [2] J. Heer, M. Bostock, and V. Ogievetsky. A tour through the visualization zoo: A survey of powerful visualization techniques, from the obvious to the obscure. ACM Queue, 8(5), May 2010. [3] H.-J. Schulz, S. Hadlak, and H. Schumann. The design space of implicit hierarchy visualization: A survey. IEEE Transactions on Visualization and Computer Graphics, 2010. to appear. [4] T. von Landesberger, A. Kuijper, T. Schreck, J. Kohlhammer, J. J. van Wijk, J.-D. Fekete, and D. W. Fellner. Visual analysis of large graphs, 2010. EuroVis State-of-the-Art Report.