ο Jason Lawrence (TA) - CS 415, office Thur 4:30-5:30. • Book ο Computer
Graphics with OpenGL, Third Edition,. Donald Hearn and M. Pauline Baker,.
Prentice ...
Overview • Administrivia ! People, times, places, etc.
Computer Graphics
• Syllabus ! What will I learn in this course?
• Raster Graphics Adam Finkelstein Princeton University
! Getting started …
COS 426, Spring 2005
Administrative Matters • Instructors ! Adam Finkelstein - CS 424, stop in any time, or email ! Jason Lawrence (TA) - CS 415, office Thur 4:30-5:30
• Book ! Computer Graphics with OpenGL, Third Edition, Donald Hearn and M. Pauline Baker, Prentice Hall, 2004! ISBN: 0-13-015390-7
• Web page ! http://www.cs.princeton.edu/courses/cos426
Coursework • Exams (30%) ! In class (Mar 10 and Apr 26)
• Programming Assignments (40%) ! ! ! !
Assignment #1: Image Processing (due Feb 20) Assignment #2: Ray Tracing (due Mar 20) Assignment #3: Modeling (due Apr 3) Assignment #4: Animation (due Apr 17)
• Final Project (20%) ! Do something cool! (due at end of semester)
• Class Participation (10%)
Programming Assignments • When? ! Roughly every two weeks
• Where?
Art Contest • Everybody should submit entries! ! 1 point for submitting ! 2 points for winning
! Anywhere you want, e.g. home or Friend 017 lab
• How? ! Windows (017), Unix/Linux (“hats”), or MacOSX ! C and C++, OpenGL, GLUT
• What? ! Basic feature lists ! Extra credit lists ! Art contest
Cool Images (Brian Beck, CS 426, Sprint04)
Videos (Jon Beyer, CS 426, Spring04)
Bloopers (Kathleen Mulcahey, CS 426, Fall99)
Collaboration Policy • Overview: ! You must write your own code (no credit for other code) ! You must reference your sources of any ideas/code
• It’s OK to …
Precepts • Schedule? ! Wednesday, 7-8PM
• Place? ! TBA
! Talk with other students about ideas, approaches, etc. ! Get ideas from information in books, web sites, etc. ! Get “support” code from example programs » But, you must reference your sources
• It’s NOT OK to … ! Share code with another student ! Use ideas or code acquired from another sources without attribution
Overview • Administrivia ! People, times, places, etc.
! Syllabus ! What will I learn in this course?
Introduction • What is computer graphics? ! ! ! !
Imaging = representing 2D images Modeling = representing 3D objects Rendering = constructing 2D images from 3D models Animation = simulating changes over time
• Raster Graphics ! Getting started …
Applications
Applications
• Entertainment
• Entertainment
• Computer-aided design
• Computer-aided design
• Scientific visualization
• Scientific visualization
• Training
• Training
• Education
• Education
• E-commerce
• E-commerce
• Computer art
• Computer art
Jurasic Park (Industrial, Light, & Magic)
Geri’s Game (Pixar Animation Studios)
Quake (Id Software)
Applications
Applications
• Entertainment
• Entertainment
• Computer-aided design
• Computer-aided design
• Scientific visualization
• Scientific visualization Los Angeles Airport
• Training
(Bill Jepson, UCLA)
• Education
• Education
• E-commerce
• E-commerce
• Computer art
Airflow Inside a Thunderstorm
• Training
(Bob Wilhelmson, University of Illinois at Urbana-Champaign)
• Computer art
Gear Shaft Design (Intergraph Corporation)
Apo A-1
Boeing 777 Airplane
(Theoretical Biophysics Group, University of Illinois at Urbana-Champaign)
(Boeing Corporation)
Applications
Applications
• Entertainment
• Entertainment
• Computer-aided design
• Computer-aided design
• Scientific visualization
• Scientific visualization Driving Simulation
• Training
(Evans & Sutherland)
• Training
• Education
• Education
• E-commerce
• E-commerce
• Computer art
• Computer art
Desk Assembly (Silicon Graphics, Inc.)
Flight Simulation
Forum of Trajan
(NASA)
Applications
• Entertainment
• Entertainment
• Computer-aided design
• Computer-aided design
• Scientific visualization
• Scientific visualization Interactive Kitchen Planner
Human Skeleton (SGI)
(Bill Jepson, UCLA)
Applications
• Training
Visible Human (National Library of Medicine)
• Training
(Matsushita)
• Education
• Education
• E-commerce
• E-commerce
• Computer art
• Computer art Virtual Phone Store (Lucent Technologies)
Blair Arch (Marissa Range ‘98)
Syllabus
Part I: Image Processing
I. Image processing
• Raster Graphics ! Display devices ! Color models
II. Rendering III. Modeling Rendering
IV. Animation
(Michael Bostock, CS426, Fall99)
Image Processing (Rusty Coleman, CS426, Fall99)
• Image Representation ! Sampling ! Reconstruction ! Quantization & Aliasing
Image Composition (Michael Bostock, CS426, Fall99)
• Image Processing Modeling
Animation
(Dennis Zorin, CalTech)
(Angel, Plate 1)
Part II: Rendering
Filtering Warping Composition Morphing
Image Morphing (All students in CS 426, Fall98)
Part III: Modeling
• 3D Rendering Pipeline ! ! ! ! ! ! !
! ! ! !
• Representations of geometry
Modeling transformations Viewing transformations Hidden surface removal Illumination, shading, and textures Scan conversion, clipping Hierarchical scene graphics OpenGL
! Curves: splines ! Surfaces: meshes, splines, subdivision ! Solids: voxels, CSG, BSP OpenGL (Chi Zhang, CS 426, Fall99)
• Procedural modeling ! Sweeps ! Fractals ! Grammars
• Global illumination
Shell
! Ray tracing ! Radiosity
(Douglas Turnbull, CS 426, Fall99)
Scenery Designer
Ray Tracing
(Dirk Balfanz, Igor Guskov, Sanjeev Kumar, & Rudro Samanta, CS426, Fall95)
(James Percy, CS 426, Fall99)
Part IV: Animation
Overview
• Keyframing
• Administrivia
! Kinematics ! Articulated figures
! People, times, places, etc.
• Syllabus
• Motion capture ! Capture ! Warping
• Dynamics
! What will I learn in this course?
! Raster Graphics
Ice Queen
! Let’s get started …
(Mao Chen et al CS426, Fall98)
! Physically-based simulations ! Particle systems
• Behaviors ! Planning, learning, etc.
Animation (Jon Beyer, CS426, Spring04)
Raster Graphics
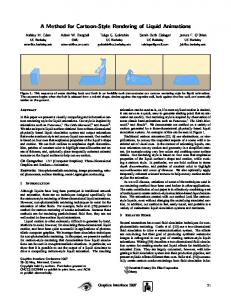
What is an Image?
• Images
• An image is a 2D rectilinear array of pixels
! What is an image? ! How are images displayed?
• Colors ! How do we perceive colors? ! How do we represent colors in a computer?
Continuous image
What is an Image?
What is an Image?
• An image is a 2D rectilinear array of pixels
Continuous image
Digital image
A pixel is a sample, not a little square!
Image Acquisition • Pixels are samples from continuous function ! Photoreceptors in eye ! CCD cells in digital camera ! Rays in virtual camera
Digital image
• An image is a 2D rectilinear array of pixels
Continuous image
Digital image
A pixel is a sample, not a little square!
Image Display • Re-create continuous function from samples ! Example: cathode ray tube
Image is reconstructed by displaying pixels with finite area (Gaussian)
Liquid Crystal Display (LCD)
Display Hardware • Video display devices » » ! ! !
Cathode Ray Tube (CRT) Liquid Crystal Display (LCD) Plasma panels Thin-film electroluminescent displays Light-emitting diodes (LED)
• Hard-copy devices
Figure 2.16 from H&B
Image Resolution
! ! ! ! !
Ink-jet printer Laser printer Film recorder Electrostatic printer Pen plotter
Frame Buffer
• Intensity resolution ! Each pixel has only “Depth” bits for colors/intensities
• Spatial resolution ! Image has only “Width” x “Height” pixels
• Temporal resolution
Typical Resolutions
! Monitor refreshes images at only “Rate” Hz
NTSC Workstation Film Laser Printer
Width x Height 640 x 480 1280 x 1024 3000 x 2000 6600 x 5100
Depth 8 24 12 1
Rate 30 75 24 -
Frame Buffer Figure 1.2 from FvDFH
Frame Buffer Refresh
Refresh rate is usually 60-75Hz
Color Frame Buffer
Figure 1.3 from FvDFH
Color CRT
Raster Graphics • Images ! What is an image? ! How are images displayed?
! Colors ! How do we perceive colors? ! How do we represent colors in a computer?
Figure 2.8 from H&B
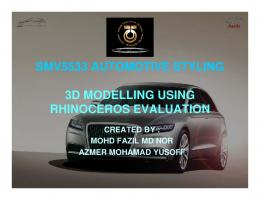
Electromagnetic Spectrum
Visible Light
• Visible light frequencies range between ... ! Red = 4.3 x 10¹⁴ hertz (700nm) ! Violet = 7.5 x 10¹⁴ hertz (400nm)
• The color of light is characterized by … ! Hue = dominant frequency (highest peak) ! Saturation = excitation purity (ratio of highest to rest) ! Lightness = luminance (area under curve)
White Light Figures 15.1 from H&B
Color Perception
Figures 15.3-4 from H&B
Color Models Spectral-response functions of each of the three types of cones on the human retina.
• RGB • XYZ • CMY • HSV
Tristimulus theory of color
Figure 13.18 from FvDFH
Orange Light
• Others
RGB Color Model
RGB Color Cube R 0.0 1.0 0.0 0.0 1.0 1.0 0.0 1.0 0.5 1.0 1.0 0.5
Colors are additive
G 0.0 0.0 1.0 0.0 1.0 0.0 1.0 1.0 0.0 0.5 0.5 0.3
B 0.0 0.0 0.0 1.0 0.0 1.0 1.0 1.0 0.0 0.5 0.0 0.1
Color Black Red Green Blue Yellow Magenta Cyan White ? ? ? ? Figures 15.11&15.12 from H&B
Plate II.3 from FvDFH
RGB Spectral Colors
XYZ Color Model (CIE)
Amounts of RGB primaries needed to display spectral colors
?
Amounts of CIE primaries needed to display spectral colors
Figure 15.5 from H&B
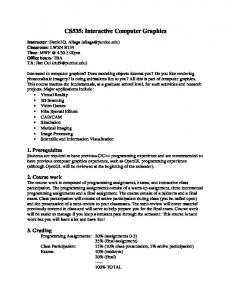
CIE Chromaticity Diagram
Figure 15.6 from H&B
CIE Chromaticity Diagram
Normalized amounts of X and Y for colors in visible spectrum
(White)
Compare Color Gamuts
Figure 15.7 from H&B
Identify Complementary Colors
Determine Dominant Wavelength and Purity
Figures 15.8-10 from H&B
RGB Color Gamut
CMY Color Model
Color gamut for a typical RGB computer monitor
Colors are subtractive
C 0.0 1.0 0.0 0.0 1.0 1.0 0.0 1.0 0.5 1.0 1.0
M 0.0 0.0 1.0 0.0 1.0 0.0 1.0 1.0 0.0 0.5 0.5
Figure 15.13 from H&B
CMY Color Cube
Color White Cyan Magenta Yellow Blue Green Red Black ? ? ?
Plate II.7 from FvDFH
HSV Color Model H 0 120 240 * * * 60 270 270
Figure 15.14 from H&B
Summary • Images ! ! ! !
Y 0.0 0.0 0.0 1.0 0.0 1.0 1.0 1.0 0.0 0.5 0.0
Pixels are samples Frame buffers Display hardware (CRTs, LCDs, printers, etc.) Devices have limited resolution
• Colors ! Tristimulus theory of color ! CIE Chromaticity Diagram ! Different color models for different devices, uses, etc.
S 1.0 1.0 1.0 0.0 0.0 * 1.0 0.5 0.0
V 1.0 1.0 1.0 1.0 0.5 0.0 1.0 1.0 0.7
Color Red Green Blue White Gray Black ? ? ?
Figure 15.16&15.17 from H&B