Feb 19, 2008 - 3Mark Kac Complex Systems Research Centre, Jagellonian ... In the following Sec. 5 we will discuss finite-size effects observed ... km i p(m),. (4) where Zi is the partition function for a graph with N − ..... E 72, 056123 (2005).
arXiv:0802.2688v1 [cond-mat.stat-mech] 19 Feb 2008
EPJ manuscript No. (will be inserted by the editor)
Power laws in zero-range processes on random networks B. Waclaw1 , Z. Burda2,3 , and W. Janke1,4 1
Institut f¨ ur Theoretische Physik, Universit¨ at Leipzig, Postfach 100 920, 04009 Leipzig, Germany Marian Smoluchowski Institute of Physics, Jagellonian University, Reymonta 4, 30059 Krak´ ow, Poland 3 Mark Kac Complex Systems Research Centre, Jagellonian University, Krak´ ow, Poland 4 Centre for Theoretical Sciences (NTZ), Universit¨ at Leipzig, Emil-Fuchs-Straße 1, 04105 Leipzig, Germany 2
19.02.2008 Abstract. We study statistical properties of a zero-range process (ZRP) on random networks. We derive an analytic expression for the distribution of particles (also called node occupation distribution) in the steady state of the ZRP in the ensemble of uncorrelated random graphs. We analyze the dependence of this distribution on the node-degree distribution. In particular, we show that when the degree distribution is tuned properly, one can obtain scale-free fluctuations in the distribution of particles. Such fluctuations lead to a power law in the distribution of particles, just like in the ZRP with the hopping rate u(m) = 1 + b/m on homogeneous graphs. PACS. 89.75.-k Complex systems – 05.20.-y Classical statistical mechanics – 05.70.Fh Phase transitions: general studies
1 Introduction Many statistical systems are defined on random networks or random lattices. Usually, this means that one considers a system on a lattice with some irregularities, or even on a purely random network, but instead of looking at what happens on a single network, one performs an annealed average over a statistical ensemble of networks that is over a collection of random graphs with some statistical weights. The question of how averaging over the disorder influences the statistical properties of the system has been previously addressed in the context of two-dimensional statistical models. It was shown that additional degrees of freedom related to fluctuations of the geometry can lead to quite distinct behavior, in comparison to analogous systems defined on a fixed lattice. For example, critical properties of the two-dimensional Ising model on a fixed lattice are described by Onsager exponents [1] while on a random lattice, represented as a sum over planar networks, by “dressed” KPZ-DDK ones [2,3]. A similar change of critical exponents is observed for other models. In this paper we address the same problem but for a statistical system on complex random networks. As a particularly simple but interesting example we consider a zero-range process (ZRP), which has been thoroughly studied on fixed networks [4,5,6,7,8,9,10]. The particular feature of this out-of-equilibrium model is that under certain conditions particles tend to condense on a single node. Here we analyze the influence of the averaging over random networks on the distribution of particles in the steady state. We shall discuss an ensemble of networks
with given probability distribution of degrees. To make things as simple as possible we shall restrict the discussion to uncorrelated networks with independent node degrees. The paper is organized as follows. In the next section we shall recall the definition of the ZRP on a network and introduce quantities describing the steady state of this model. Then we shall consider the free ZRP process being a particular class of ZRP, in which the hopping rates do not depend on the distribution of particles but only on the connectivity of the network. For this case we will present in Secs. 3 and 4 an exact solution to the problem of how the distribution of particles averaged over nodes depends on the node-degree distribution and how to choose the latter one to obtain a scale-free distribution of particles. In the following Sec. 5 we will discuss finite-size effects observed in the distribution of particles for some models of random networks like Erd¨ os-R´enyi graphs. We will finish in Sec. 6 with some concluding remarks.
2 Model description Consider the ZRP on a connected simple graph with N nodes and a sequence k = {k1 , . . . , kN } of node degrees. The state of the ZRP is given by the distribution of particles m = {m1 , . . . , mN } on nodes of the network, where mi ≥ 0 is the number of particles at node i. The total number of particles M = m1 + . . . + mN is conserved during the process. A particle can hop from node i to one of its neighbors with rate u(mi )/ki . The function u(m), called hopping rate, depends only on the number of parti-
2
B. Waclaw et al.: Power laws in zero-range processes on random networks
cles at the departure node i. The factor 1/ki takes care of distributing the outflow of particles equally between the neighbors. The hopping rates u(m) are non-negative and identical for all nodes. The ZRP is known to have a unique steady state [11]. Static properties of this state are described by a partition function Z(N, M, k) depending only on the degree sequence k: Z(N, M, k) =
M X
δm1 +...+mN ,M
m1 ,...,mN =0
N Y
p(mi )kimi ,
i=1
(1) with statistical weights p(m) defined as p(m) =
m Y
1 , p(0) = 1. u(n) n=1
(2)
We will refer to Z(N, M, k) as to a microcanonical partition function. The main quantity describing the system is the distribution of particles π(m), averaged over all configurations m with the weight given by the partition function (1) and over all nodes: 1 X hδm,mi i, π(m, k) = N i
(3)
where the argument k means that it is calculated for a single network with a given sequence of degrees. It is also called node occupation distribution. It can be calculated [10] as follows: π(m, k) =
N 1 X Zi (N − 1, M − m, k′ ) m ki p(m), N i=1 Z(N, M, k)
(4)
where Zi is the partition function for a graph with N − 1 nodes and degrees k′ = {k1 , . . . , ki−1 , ki+1 , . . . , kN }. Equation (4) holds for any connected graph with a given degree sequence. Suppose now that we are interested in the behavior of the ZRP on a random network. In this case we have to take the average over networks. Denote by P (k) ≡ P (k1 , . . . , kN ) the probability of choosing a network with the degree sequence k1 , . . . , kN . We can now define a canonical partition function as the average over all degree sequences: X P (k)Z(N, M, k). (5) Z(N, M ) =
The canonical partition function assumes then a simple, symmetric form: X
Z(N, M ) =
δm1 +...+mN ,M
m1 ,...,mN
N Y
i=1
where pb(m) = p(m)
∞ X
pb(mi ),
Π(k)k m
(6)
(7)
k=1
is an effective weight for a node occupied by m particles. As we see, the effective weight pb(m) is calculated from the node degree distribution Π(k) and the occupation weight p(m). The effective partition function Z(N, M ) in Eq. (6) has the form of a partition function of the balls-in-boxes model with identical weights, which has been thoroughly studied [14,15,16]. Z(N, M ) is invariant with respect to any permutation σ of node occupation numbers mi → mσ(i) .
3 Free ZRP In this section we shall consider a particular example of a ZRP for which the hopping rate u(m) = 1 is independent of m. We shall call it free ZRP (FZRP). In this case, also the occupation weight (2) is constant, p(m) = 1, and the canonical partition function (6) reduces to X
Z(N, M ) =
δm1 +...+mN ,M
m1 ,...,mN
where µ(m) =
N Y
µ(mi ),
(8)
i=1 ∞ X
Π(k)k m
(9)
k=1
is the m-th moment of the node-degree distribution. The probability that a node is occupied by m particles is now: π(m) =
Z(N − 1, M − m) µ(m), Z(N, M )
(10)
just as it was in the balls-in-boxes model [14]. For further convenience, let us introduce a generating function for the moments µ(m): X zm , (11) M (z) = µ(m) m! m
which encodes the same information as Π(k). Indeed, inserting Eq. (9) into the last equation we see that it can In general, P (k) may have a complicated form. We shall be interpreted as a Fourier transform of the node-degree restrict our attention to uncorrelated networks [12,13] for distribution, X which P (k) is a product measure: P (k) = Π(k1 ) · · · Π(kN ). M (−iz) = Π(k)e−ikz . (12) This means that node degrees are independent of each k 1 other and that the observed degree distribution is Π(k). From the generating function one can formally reconstruct 1 We neglect the fact that the total number of links is often the moments, fixed, which leads to an additional Kroenecker delta constraint I δ2L,k1 +...+kN . This constraint can be usually neglected in the m! M (z)z −m−1dz, (13) µ(m) = thermodynamic limit. 2πi k1 ,...,kN
B. Waclaw et al.: Power laws in zero-range processes on random networks
as well as the degree distribution, Z π 1 dz eizk M (−iz). Π(k) = 2π −π
(14)
The partition function (8) is well defined if all moments of the distribution Π(k) are finite. Usually, we are interested in the behavior of the system in the thermodynamic limit N → ∞. We can distinguish two cases: (a) the limiting distribution Π(k) for N → ∞ has all moments finite, as for instance for Erd¨ os-R´enyi (ER) graphs, where it is Poissonian, (b) higher moments of the limiting distribution Π(k) diverge for N → ∞ as it happens for scale-free graphs [17]. For (a), the large N limit presents no difficulty, while for (b) it has to be taken very carefully since it depends on the details of how the ensemble is defined. Moreover, in case (a) one can show that for random graphs2 the probability of any sequence of degrees k factorizes in the limit N → ∞ [17]. This factorization often breaks down for (b). One observes particularly strong deviations from the factorization for Π(k) ∼ k −γ with 2 < γ ≤ 3 where finitesize effects are especially strong [12,18,19]. Below we shall discuss only the case (a) which is free of these problems.
4 Power-law distribution of particles We have shown in the previous section that averaging over fluctuating geometries leads to an effective model with the partition function (8) and weights µ(m) being the moments of the node-degree distribution. This model has an interesting critical behavior for weights which fall off like µ(m) ∼ m−b . For example [20], for µ(m) ∝ Γ (m + 1)/Γ (m + b + 1) ∼ m−b ,
(15)
one observes a condensation of particles when the density of particles ρ = M/N is larger than a critical density ρc = 1/(b−2). In the thermodynamic limit, at the critical point ρ = ρc , fluctuations of the number of particles become scale-free and π(m) = µ(m) displays a power law. Below ρc it has an exponential cut-off: π(m) = µ(m) exp(A − Bm),
(16)
where the constants P A and B are chosen so that the normalization m π(m) = 1 and the density of partiP cles m mπ(m) = ρ are fixed. Above ρc , the distribution π(m) is approximately given by µ(m) but with an additional peak centered around m∗ ≈ M − ρc N . One now can ask whether the weights (15) can be obtained in our FZRP by tuning the node-degree distribution of the underlying network. Before we proceed, it is important to notice that the model given by the partition function (8) is invariant with respect to the rescaling: µ(m) → N φm µ(m).
(17)
2 By a random graph we understand here a graph being maximally random among all graphs with a given sequence of degrees.
3
Indeed, the partition function (8) changes only by a factor: Z(N, M ) → N N φM Z(N, M ), which is constant for given N and M , while physical quantities stay intact because the normalization factor cancels out. Thus, we expect that if the moments are given by µ(m) = N
Γ (m + 1) φm , Γ (m + 1 + b)
(18)
then the degree distribution of node occupation numbers at the critical density should be given by π(m) ∝
Γ (m + 1) ∼ m−b . Γ (m + b + 1)
(19)
The question we face now is whether there is a nodedegree distribution Π(k) which has moments given by Eq. (18). First of all, we observe that the parameter φ in Eq. (18) plays the role of a scale parameter of the distribution Π(k) as follows from the definition of the moments (9): under the rescaling k → k/φ the moments change as µ(m) → µ(m)φm . We will use the freedom of choosing the parameter φ to fix the average degree k¯ and thus also ¯ the number of links L = kN/2. The parameter N has to be chosen in such a way that Π(k) takes the proper normalization of a probability. The integral in Eq. (14) is hard to calculate and cannot be easily expressed in terms of elementary functions. However, if we assume φ ≫ 1, then the function M (−iz) goes to zero sufficiently fast when z → ±∞ and thus we can extend the limits of integration to ±∞. In this case the integral can be done analytically. Equation (14) becomes a Fourier transform of the function M (−iz) which is a special case of the Mittag-Leffler functions having a known form of an infinite series expansion (see e.g. [21]). Changing variables k → xφ we obtain N Π(xφ) = 2πφ
Z
∞
−∞
dz e
izx
∞ X
(−iz)m . Γ (m + 1 + b) m=0
(20)
According to Eq. (B21) of Ref. [21], the above integral yields ∞ N X (−x)m , (21) φ m=0 m!Γ (b − m) and hence Π(k) =
∞ N N X (−k/φ)m = (φ − k)b−1 . (22) φ m=0 m!Γ (b − m) Γ (b)φb
In Fig. 1 we compare Π(k) computed numerically using the integral (14) with the original limit ±π, and calculated by means of Eq. (22). Because the probability Π(k) must be non-negative, the above solution is physical only for k ≤ φ and we have to set Π(k) = 0 for k > φ. We see that the integer part of φ can be interpreted as the maximal degree which can exist in the network. The existence of the upper cut-off in the node-degree distribution is not only a property of the approximate solution. Also when one uses the exact relation (14) to calculate the degree
4
B. Waclaw et al.: Power laws in zero-range processes on random networks 3.5
Π(k/φ)/φ
3 2.5 2 1.5 1 0.5 0 0
0.5
k/φ
1
1.5
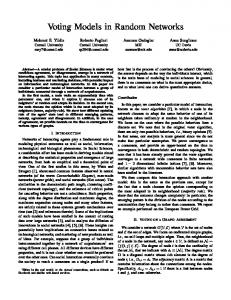
Fig. 1. Π(k) calculated from the exact formula (14) (points) and approximated one (Eq. (22), thick line), for N = 2π and b = 3. Squares: φ = 6, circles: φ = 30. The approximate solution diverges for x = k/φ > 1 and has to be cut. For 0 < x ≤ 1 the approximation is the better, the larger is φ. -1
k¯ is almost linear: Rφ Pφ b−1 (φ − k)k b−1 dk k φ k=1 (k − φ) ¯ ≈ 0 Rφ = . k = Pφ b−1 b+1 k b−1 dk k=1 (k − φ) 0 (23) This implies that in order to obtain the power-law distribution (19) for N → ∞, the value of k¯ should increase to infinity. For sparse networks k¯ would be finite. We see thus that the price to pay for having a scale-free distribution of particles is to make networks denser when their size increases. The normalization factor N must be chosen so that the degree distribution is normalized to unity: Pφ k=1 Π(k) = 1. For example, for b = 2, 3, 4 we obtain the following degree distributions Π(k) for 0 < k ≤ φ: b=2: b=3: b=4:
10
2(φ − k) , φ(φ − 1) (φ − k)2 , φ(φ − 1)(2φ − 1) 4(φ − k)3 , φ2 (φ − 1)2
(24) (25) (26)
-2
10
and zero for both k = 0 and k > φ, with φ given by the following formulas for b = 2, 3:
-3
10
φ = 3k¯ − 1, � � p φ = −1 + 4k¯ + 1 − 16k¯ + 16k¯2 /2,
µ(m)
-4
10
-5
10
-6
10
(28)
and by the solution of a cubic equation for b = 4:
-7
10
(1 + φ)(3φ2 − 2) ¯ = k. 15φ(φ − 1)
-8
10
-9
10 1
(27)
10
m
100
1000
Fig. 2. Desired (dashed line) versus real distribution of par¯ (solid ticles µ(m) for networks with finite average degree k lines), obtained from Eqs. (22) and (9) for b = 3. Lines from left to right: φ = 5, 10, 20, 40, 80 which corresponds to ¯ = 1.67, 2.89, 5.4, 10.4, 20.4 from Eq. (28). These plots apk proximate also π(m) at the critical point. The parameter φ ¯ grows almost linearly with k.
distribution Π(k) for the moments of the form (15), one obtains negative values of Π(k) for k > φ, so again one has to cut off the solution and set Π(k) to zero for k > φ. If one now calculates moments for the distribution (22) with the cut-off directly from the definition (9), one will see that they deviate slightly from those given by Eq. (18). However, the deviation decreases when φ increases and finally becomes negligible for sufficiently large φ. In Fig. 2 we plot the moments µ(m) from Eq. (18) and those calculated from Eq. (9), for various φ. As φ increases, the curves tend asymptotically to a power law. The parameter φ is related to the average degree as P k¯ = φk=1 Π(k)k. For large φ, the relation between φ and
(29)
How does it come about that the power laws are observed in the distribution of particles π(m) when one averages it over networks while they are not seen in π(m)’s for individual nodes, for any single network in the ensemble? The answer is that the effective distribution π(m) averaged over networks is a subtle result of a well-tuned superposition of many exponential distributions: for a node with degree k, the distribution of particles is π(m) ∝ (k/kmax )m , where kmax is the maximal degree in the network [9]. On the node with maximal degree, however, there is a condensation just as for scale-free networks [8], but it disappears in the thermodynamic limit. This happens because the critical density for the condensation becomes larger than ρ = 1/(b − 2) which we assumed to hold in our system, and the system is always in the fluid phase.
5 Other random graphs In the previous section we found a node degree distribution for the ensemble of random, uncorrelated networks for which the corresponding FZRP has a power-law particle distribution π(m). What happens with FZRP on generic random networks? Can the particle distribution be scale
B. Waclaw et al.: Power laws in zero-range processes on random networks 0
Π(kmax ) ≈ 1/(nN ), where n is the number of samples in MC simulations. Next, for the distribution with the cut-off kmax we calculated the moments (9) and we got rid of the leading exponential behavior of µ(m), using the freedom (17), by multiplying them by a factor exp(−mB) with B appropriately chosen. As we can see in Fig. 3 we obtained almost a straight line in the log-log plot. The discussion from the beginning of this section tells us, however, that this quasi-power-law behavior is only a finite-size effect which will disappear in the limit N → ∞.
10
-1
10
-2
10
-3
10
π(m)
5
-4
10
-5
10
-6
10
-7
10
-8
6 Conclusion
10
-9
10 1
10 m
100
Fig. 3. The particle distribution π(m) for ER graphs, N = 400, obtained from Eq. (9) by using a Poissonian degree distribution with kmax ≈ 22, calculated for n = 200 samples as described in the main text. The almost straight line on the log-log plot explains partially the quasi-power-law observed in numerical experiments (see the data points).
free? Let us begin with what happens in the limit N → ∞. Consider some typical examples of graphs like random trees [22] or ER graphs for which the limiting shapes of the degree distribution are known: Π(k) = e−1 /(k − 1)! ¯ and Π(k) = e−k k¯k /k!, respectively. So we can calculate the corresponding critical distribution π(m). In the first case, the generating function has a closed form M (z) = exp(z + ez ), as follows from Eq. (11), and we can deduce the coefficients µ(m) from the inverse Laplace transform (13). Using the saddle-point method and integrating around z0 ≈ log(m/ log m) we can find the asymptotic behavior for large m: log µ(m) = m(log m − log log m) + O(m).
(30)
We see that µ(m) grows over-exponentially for large m. This means that in the thermodynamic limit the condensation always happens, regardless of the density of particles. The distribution π(m) in the bulk falls faster than any power law. Similarly, one can estimate that for ran¯ z )−1 and the leading term dom ER graphs M (z) ∝ exp(ke in log µ(m) is also m log m. So again it is clear that in the limit M → ∞ one cannot obtain a power-law distribution of particles. Surprisingly, in Monte Carlo (MC) simulations of random trees and ER graphs one observes distributions π(m) which very much resemble those with power-law tails. Why does it happen? The answer is that this is caused by finitesize effects. When one repeats the calculations for finite systems, including sub-leading terms and a finite-size cutoff, one obtains a line like that in Fig. 3, which very much resembles a scale-free plot. The line is compared to MC simulations. In our analytic calculations aimed at mimicking the result of the simulation, finite-size effects were taken into account as follows. In order to compute the moments we introduced a finite-size cut-off to Π(k). The position of the cut-off kmax was estimated from the condition:
We analytically investigated the influence of annealed averaging over random networks on the statistical properties of ZRP. In particular, we calculated how the particle distribution depends on the node-degree distribution. We showed that by tuning the node-degree distribution we can make the corresponding zero-range process critical and having a power-law distribution of particles. We believe it is the first step towards the analysis of more complex systems, where the topology and the dynamics of the system are coupled to each other and influence mutually. An example of this type of interactions was discussed in the context of 2d statistical systems on random lattices (2d gravity), where a back-reaction of the system on the lattice was observed [2,3,23], which manifested as a change of fractal properties of the underlying geometry when the system became critical. It would be very interesting to see such an adaptation mechanism also for random complex networks.
Acknowledgments We thank the EC-RTN Network “ENRAGE” under grant No. MRTN-CT-2004-005616 and the Alexander von Humboldt Foundation for support. Z. B. acknowledges support from a Marie Curie Actions Transfer of Knowledge project “COCOS”, Grant No. MTKD-CT-2004-517186 and a Polish Ministry of Science and Information Society Technologies Grant 1P03B-04029 (2005-2008). B. W. thanks the DAAD for support.
References 1. L. Onsager, Phys. Rev. 65, 117 (1944). 2. V. Kazakov, Phys. Lett. A 119, 140 (1987); D. Boulatov and V. Kazakov, Phys. Lett. B 186, 379 (1987). 3. V. Knizhnik, A. Polyakov, and A. Zamolodchikov, Mod. Phys. Lett. A 3, 819 (1988); F. David, Mod. Phys. Lett. A 3, 1651 (1988); J. Distler and H. Kawai, Nucl. Phys. B 321, 509 (1989). 4. M. R. Evans, S. N. Majumdar, and R. K. P. Zia, J. Phys. A: Math. Gen. 39, 4859 (2006). 5. A. G. Angel, T. Hanney, and M. R. Evans, Phys. Rev. E 73, 016105 (2006). 6. J. D. Noh, Phys. Rev. E 72, 056123 (2005).
6
B. Waclaw et al.: Power laws in zero-range processes on random networks
7. J. D. Noh, J. Korean Phys. Soc. 50, 327 (2007). 8. J. D. Noh, G. M. Shim, and H. Lee, Phys. Rev. Lett 94, 198701 (2005). 9. L. Bogacz, Z. Burda, W. Janke, and B. Waclaw, in Noise and Stochastics in Complex Systems and Finance, edited by J. Kert´esz, S. Bornholdt, and R. N. Mantegna, Proceedings of SPIE, Vol. 6601, 66010V (2007). 10. B. Waclaw, L. Bogacz, Z. Burda, and W. Janke, Phys. Rev. E 76, 046114 (2007). 11. M. R. Evans and T. Hanney, J. Phys. A: Math. Gen. 38, R195 (2005). 12. Z. Burda and A. Krzywicki, Phys. Rev. E 67, 046118 (2003). 13. L. Bogacz, Z. Burda, and B. Waclaw, Physica A 366, 587 (2006). 14. Z. Burda, P. Bialas, and D. Johnston, Nucl. Phys. B 493, 505 (1997). 15. P. Bialas and Z. Burda, Phys. Lett. B 384, 75 (1996). 16. Z. Burda, P. Bialas, and D. Johnston, Nucl. Phys. B 542, 413 (1999). 17. S. N. Dorogovtsev, J. F. F. Mendes, and A. N. Samukhin, Nucl. Phys. B 666, 396 (2003). 18. M. Boguna, R. Pastor-Satorras, and A. Vespignani, Eur. Phys. J. B 38, 205 (2004). 19. B. Waclaw, PhD thesis, arXiv:0704.3702v1. 20. C. Godr´eche and J. M. Luck, J. Phys. A 38, 7215 (2005). 21. B. Waclaw and I. M. Sokolov, Phys. Rev. E 75, 056114 (2007). 22. P. Bialas, Z. Burda, J. Jurkiewicz, and A. Krzywicki, Phys. Rev. E 67, 066106 (2003). 23. M. Weigel and W. Janke, Nucl. Phys. B 719, 312 (2005).