Power-output regularization in global sound equalization (L) Nick Stefanakis,a兲 John Sarris, and George Cambourakis School of Electrical and Computer Engineering, National Technical University of Athens, Heroon Polytechniou 9, 157 73, Athens, Greece
Finn Jacobsen Acoustic Technology, Ørsted DTU, Technical University of Denmark, Ørsted Plads, Building 352, DK-2800 Kgs, Lyngby, Denmark
共Received 24 June 2007; revised 31 October 2007; accepted 1 November 2007兲 The purpose of equalization in room acoustics is to compensate for the undesired modification that an enclosure introduces to signals such as audio or speech. In this work, equalization in a large part of the volume of a room is addressed. The multiple point method is employed with an acoustic power-output penalty term instead of the traditional quadratic source effort penalty term. Simulation results demonstrate that this technique gives a smoother decline of the reproduction performance away from the control points. © 2008 Acoustical Society of America. 关DOI: 10.1121/1.2816580兴 PACS number共s兲: 43.55.Br, 43.38.Md, 43.60.Pt 关NX兴
I. INTRODUCTION
Traditionally, equalization in room acoustics uses digital filters to pre-process the input signal before it is fed to a set of loudspeakers so that the spectral coloration and the reverberation tail associated with the transmission path are removed.1,2 Recently, techniques that allow the zone of equalization to be extended to a much larger region inside the room have been proposed.3,4 In these techniques a plane propagating wave was generated in a rectangular enclosure in a region that occupied almost the complete volume of the room. This paper is also concerned with equalization in a large part of the volume of a rectangular room. The process is studied below the Schroeder frequency where the modal density and the modal overlap is low and the sound field is dominated by discrete modes.5 The method is based on the conventional multiple point technique which minimizes a cost function that expresses the difference between the desired complex sound pressure and the sound pressure that is actually reproduced at a small number of sampling points in the room.2,3 Instead of the quadratic effort penalty term used in traditional regularization, a sound power-output penalty term is introduced. The main advantage of this new technique is shown to be a smoother decline of the reproduction performance away from the control points. II. SOURCE POWER OUTPUT IN THE REPRODUCTION OF SOUND FIELDS IN ROOMS
One possible principle of sound field reproduction is based on the fact that given a spatial volume any sound field can be reproduced perfectly in both space and time, given a complete description of the acoustic pressure and pressure gradient on the hypothetical surface that bounds the spatial volume. This principle is mathematically expressed by the
a兲
Author to whom correspondence should be addressed. Electronic mail:
[email protected]
J. Acoust. Soc. Am. 123 共1兲, January 2008
Pages: 33–36
Kirchhoff–Helmholtz integral equation.6 For sound field reproduction purposes, a continuous layer of dipole and monopole sources should be assigned the values of the sound pressure and the pressure gradient that correspond to the sound field. If the sources that generate the original sound field are outside the volume then as much sound energy flows into the volume as out of it. It follows that reproduction of a sound field generated by sources outside the volume implies that the total sound power output of the source layer should be zero. This suggests that the monopole and dipole strengths should be adjusted so that one part of the source layer absorbs the sound power that is emitted from another part. A well-known physical implementation of the Kirchhoff–Helmholtz integral equation is wave field synthesis 共WFS兲.7 Classical WFS assumes that the reproduction environment is anechoic and therefore does not perform well in a real reproduction environment.8 Nevertheless, the mechanisms of power output minimization and power absorption9 between the reproduction sources still hold for sound field reproduction in closed spaces, as pointed out by Gauthier et al., who observed that sound absorption becomes important in reverberant enclosures when using optimal control techniques.8 It was also observed that, at frequencies where the modal density is low, optimal control acts to create a sound energy flow over the sensor array and mainly prevents a pure standing wave pattern. This relation between spatial sound field reproduction and the suppression of the standing wave pattern that is likely to occur is also related to Santillán’s work, where the reproduction of a plane wave serves as a solution for global equalization in a rectangular room.3 These observations suggest that when spatial sound field reproduction is desired, the total sound power emitted from the reproduction sources should avoid the peaks that are likely to occur near the natural frequencies of the room. The addition of a power-output penalty term in the cost function of the multiple point method would therefore seem to be a promising strategy for spatial sound field reproduction.
0001-4966/2008/123共1兲/33/4/$23.00
© 2008 Acoustical Society of America
33
III. CONTROL MODEL
H
Suppose that it is desired to control the sound field in a spatial region inside an enclosure that is surrounded by L reproduction sources. The pressure in this spatial region is sampled by M monitor sensors placed at 兵r1 , r2 , . . . , r M 其, and they provide a measure of the performance of reproduction in the entire listening space. The pressure at the monitoring sensors subject to the L source excitations can be written as2 p = Z共m兲q,
共1兲
where p is a column vector with the M complex sound pressures at the monitor sensors 关Pa兴, q is a column vector with the complex strengths of the L sources 关m3 / s兴, and Z共m兲 is an 共m兲 being the acoustic transfer function M by L matrix with Zml from the lth source to the mth field point at rm. Assume that the reproduction system includes N control sensors placed at discrete points in the room, 兵r1 , r2 , . . . , rN其. It is assumed here that N ⬍ M, corresponding to a limited number of control sensors, covering only a small part of the listening space. The need for a compact control sensor array is based on the observation that a great number of control sensors that occupy the entire listening area not only would increase the computational cost but also interfere with the listeners inside the room. The system is informed about the performance of the reproduction in the controlled region by the difference between the target pressure and the reproduced pressure field 共c兲
where pd is the vector with the desired sound pressures at the N control sensors, and Z共c兲 is the transfer matrix with the transfer functions from the L sources to the N control sensors. The proposed control approach suggests the use of a cost function defined as J共兲 = eHe + qHWq,
共3兲
which should be minimized. Here is a real positive scalar that weights the contribution of the penalty term in the cost function, the quantity qHWq expresses the total sound power emitted by the reproduction sources 关W兴, and W is a symmetric and positive definite matrix with Wij representing the real part of the transfer function from the ith to the jth source.9 For distributed sources, each element of the matrix W is calculated with proper integration of the transfer function on the surface of each source. Equation 共3兲 implies the addition of an -weighted sound power-output penalty term instead of the source effort penalty term used in standard regularization,10 J共兲 = eHe + qHq.
共4兲
Substitution of Eq. 共2兲 into Eq. 共3兲 yields H
共c兲 J共兲 = qH共Z共c兲 Z共c兲 + W兲q − qHZ共c兲 pd − pH dZ q
+ pH d pd ,
共5兲
which is a quadratic function of q. Under the condition that H W + Z共c兲 Z共c兲 is also positive definite, the optimal vector that minimizes J共兲 can be found by 34
共6兲
The optimum source strengths derived here should be compared with those obtained by standard regularization,10 H
H
q共兲 = 共I + Z共c兲 Z共c兲兲−1Z共c兲 pd .
共7兲
It can be seen that the identity matrix has been replaced by the fully populated matrix W. The achieved quality of the reproduction of each of the two optimum source strengths is measured over the entire listening space with the use of the M monitor sensors. Similar to Eq. 共2兲 the error at the monitor sensors is measured as 共m兲 e共m兲 = p共m兲 d − Z q,
共8兲
where p共m兲 d is now the vector with the desired complex pressures at the monitor sensors. The quality of the performance is quantified over the entire listening space at the monitor sensors by the global reproduction errors, defined as 共兲 = ELS
and 共兲 = ELS
冉
冉
共m兲 共兲 共m兲 共兲 H 共m兲 共p共m兲 d − Z q 兲 共pd − Z q 兲 H
p共m兲 p共m兲 d d
冊
共m兲 共兲 H 共m兲 共m兲 共兲 共p共m兲 d − Z q 兲 共pd − Z q 兲 H
p共m兲 p共m兲 d d
1/2
冊
共9兲
1/2
共10兲
for power-output penalty and effort penalty regularization.
共2兲
e = pd − Z q,
H
H
q共兲 = 共W + Z共c兲 Z共c兲兲−1Z共c兲 pd .
J. Acoust. Soc. Am., Vol. 123, No. 1, January 2008
IV. SIMULATION RESULTS
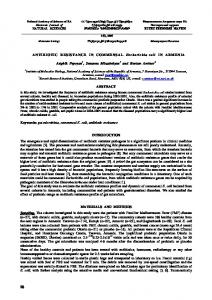
In the simulations presented in what follows, the conventional modal sum of the sound field in a lightly damped rectangular enclosure proposed by Morse11 is used in the form described by Bullmore et al.12 The sources are modeled as square pistons that vibrate with the normal velocity ul = ql / A, where A = a2 is the area of the piston sources and a is their side length. The piston sources are assumed parallel to the xz plane. A shallow rectangular room is modeled with dimensions Lx = 2 m, Ly = 3.2 m, and Lz = 0.2 m as shown in Fig. 1. Five square piston sources with side length equal to 0.1 m are placed along each of the walls at x = 0 and x = Lx, and 16 control sensors centered in the room are used to optimize the source strengths. All the modes up to 1100 Hz are used to model the sound field inside the room, and the damping factor is set equal to 0.03 for all the modes. An array of 405 monitor sensors is spread in the room, covering the dashed rectangle in Fig. 1, with lower left and upper right corner at 共0.3, 0.3兲 m and 共1.7, 2.9兲 m, respectively. The distance between the monitor sensors is 0.1 m in both the x and y direction, while a distance of 0.3 m is preserved between the outer monitor sensors and the closest vertical wall in the room. Following Santillán’s approach, equalization in the entire volume of the room is obtained by the generation of a plane wave traveling in the y direction.3 This requires that only the desired y-axial modes are significantly excited in the room. The reproduction error for this type of sound field at 300 Hz is illustrated as a function of the penalization paramStefanakis et al.: Letters to the Editor
FIG. 1. Schematic diagram of the room for the two-dimensional problem. The sensor plane is at z = 0.1 m while the x coordinates of the centers of the sources are at 0.05, 0.5, 1, 1.5 and 1.95 m. The y coordinates of their centers are at 0.05 m for the left sources and at 3.15 m for the right sources.
eters and at the control sensors and at the monitor sensors in Fig. 2. As can be seen in Fig. 2共a兲, the residual error as calculated at the control sensors is an increasing function of both and . Nevertheless, as seen in Fig. 2共b兲, the global reproduction error is minimized with both techniques for nontrivial values of the penalization parameters. It can also be seen that the two techniques give very similar curves except that the effort penalty curve is shifted to the right since must be larger in order to achieve a balance between eHe and the effort penalty term similar to the balance between eHe and the power penalty term in the two cost functions. 共兲 共兲 The minimum errors are 0.263 and 0.395 for ELS and ELS , respectively, corresponding to the optimum regularization parameters of = 16⫻ 0.5 and = 16⫻ 1000, as they are chosen from a range of values of the form N ⫻ 关5 ⫻ 10−4 , 10−3 , 5 ⫻ 10−3 , 10−2 , . . . , 5 ⫻ 104兴, where N is the
FIG. 2. Variation of the reproduction error as a function of the penalty parameter 共solid line兲 and 共dashed line兲 calculated 共a兲 at the monitor sensors and 共b兲 at the control sensors. J. Acoust. Soc. Am., Vol. 123, No. 1, January 2008
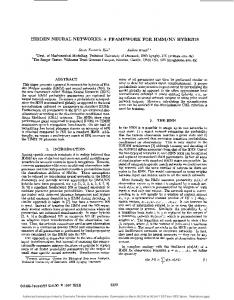
FIG. 3. Reproduction error as a function of the frequency 共a兲 at the monitor sensors and 共b兲 at the control sensors. The penalization parameter is = 8 for power penalty regularization and = 16 000 for effort penalty regularization. In 共a兲 is also shown the global reproduction error for global sensing.
number of the control sensors. Another interesting point is that even if the power penalty with optimum gives a global reproduction error lower than the one obtained with the effort penalty with optimum , they both give similar reproduction errors at the control sensors 共about 0.01 in Fig. 2共a兲兲. The global reproduction errors for the two strategies are plotted in the frequency range of concern in Fig. 3共a兲 where = 16⫻ 0.5 and = 16⫻ 1000. In the same figure the global reproduction error is also shown for the case where all the monitor sensors are used to optimize the source strengths 共d兲 . qm = 共Z共m兲 Z共m兲兲−1Z共m兲 pm H
H
共11兲
This corresponds to the best that can be done in the rather unrealistic case where a control sensor plane covering the entire listening space is used. Such a great number of control sensors are used in order to provide an independent measure of the optimal performance of the system but would, of course, be impractical in any real problem. The term global sensing will be used for this type of optimization. Among the ELS values of the two regularization methods in Fig. 3共a兲 it can be seen that the proposed strategy clearly outperforms traditional regularization, which is characterized by strong peaks at distinct frequencies. In Fig. 3共b兲, the reproduction error as a function of the frequency is plotted at the control sensors. It can be seen that the quality of the reproduction result at the control sensor locations is very similar for both techniques. This leads to the conclusion that the improvement in the global performance for the proposed technique is caused by better reproduction results outside the region of control. The best way of reproducing a progressive wave field in the control volume would be to activate only the y-axial modes by a piston that covers an entire wall and drive the corresponding piston on the opposite, “receiving wall” in such a way that it absorbs the incident wave, that is, in antiStefanakis et al.: Letters to the Editor
35
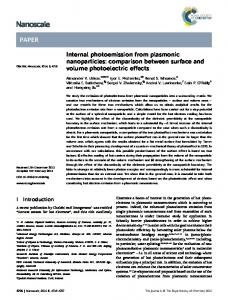
FIG. 5. Distribution of the sound pressure level in dB at 500 Hz using 共a兲 effort regularization and 共b兲 power-output regularization. The sound pressure is shown only at positions where the deviations of the reproduced sound pressure from the desired pressure are within ±6 dB. The positions of the control sensors are marked with white dots.
FIG. 4. 共a兲 Total sound power output of the reproduction sources as a function of the frequency and 共b兲 total source effort. The mode notation in 共a兲 is 共nx , ny兲.
phase with the pressure on the wall, leading to a plane wave in the entire volume of the room.3 The effect of using a small control sensor array without regularization is to generate a modal rearrangement that leads to an accurate reproduction of the progressive wave only in the control region and to inevitable deterioration of the sound field outside of it. For this reproduction mechanism, a much greater number of natural modes can contribute to the sound field. With penalization of the effort, the global performance is improved as a result of decreasing the source strengths and therefore the amplitude of the sound field outside the control region. However, this penalty term does not force the control system to avoid the unwanted modes. It forces it to use the modes with natural frequencies close to the excitation frequency, since the stronger the resonant term, the smaller the effort from the sources required to reproduce a given amplitude. Inspection of Figs. 3共a兲 and 4共a兲 shows that the error peaks in the global performance of effort penalty regularization are connected to peaks in the power output of the system that occur near the characteristic frequencies of undesired modes. Although this kind of modal rearrangement reproduces the sound field accurately in the control region, it does not avoid degradation outside the region, especially when the excitation frequency is close to a natural frequency of an unwanted mode. On the other hand, it seems that the power penalty makes the system behave more as a global sensing mechanism, with activation of the y-axial modes and suppression of the unwanted modes. An interesting difference between the two methods can be seen in Figs. 4共a兲 and 4共b兲. The total power output with traditional regularization is always greater than with the proposed technique, but the total source effort with the proposed technique is always greater than with the traditional method. The reduced global error achieved with the proposed technique is related to a smoother decline of the performance away from the control points. As can be seen in Fig. 5, the 36
J. Acoust. Soc. Am., Vol. 123, No. 1, January 2008
percentage of the listening area where the deviations of the reproduced sound pressure from the desired pressure are within ±6 dB at 500 Hz is 42% for traditional regularization and 67% for the proposed technique. V. CONCLUSIONS
The sound power output of a sound reproduction system in a room is related to standing waves. Therefore a power penalty term in the cost function obtained by a multiple point equalization system can lead to the suppression of undesired modes and to an extension of the region of equalization in the frequency range where the modal density is low. It remains to be seen, how this would be possible in real life. Matters concerning causality as well as the calculation and incorporation of matrix W in the solution should be addressed in future work. 1
J. Mourjopoulos, “On the variation and invertibility of room impulse response functions,” J. Sound Vib. 102, 217–228 共1985兲. 2 F. Asano and D. C. Swanson, “Sound equalization in enclosures using modal reconstruction,” J. Acoust. Soc. Am. 98, 2062–2069 共1995兲. 3 A. O. Santillán, “Spatially extended sound equalization in rectangular rooms,” J. Acoust. Soc. Am. 110, 1989–1997 共2001兲. 4 J. C. Sarris, F. Jacobsen, and G. E. Cambourakis, “Sound equalization in a large region of a rectangular enclosure,” J. Acoust. Soc. Am. 116, 3271– 3274 共2004兲. 5 M. R. Schroeder, “The statistics of frequency responses in large rooms, Die statistischen Parameter der Frequenzkurven von grossen Räumen 共in German兲,” Acustica 4, 594–600 共1954兲. 6 P. A. Nelson, “Active control of acoustic fields and the reproduction of sound,” J. Sound Vib. 177, 447–477 共1994兲. 7 A. K. Berkhout, D. de Vries, and P. Vogel, “Acoustic control by wave field synthesis,” J. Acoust. Soc. Am. 93, 2764–2778 共1993兲. 8 P. A. Gauthier, A. Berry, and W. Woszczyk, “Sound-field reproduction in-room using optimal control techniques,” J. Acoust. Soc. Am. 117, 662– 678 共2005兲. 9 S. J. Elliott, P. Joseph, P. A. Nelson, and M. E. Johnson, “Power output minimization and power absorption in the active control of sound,” J. Acoust. Soc. Am. 90, 2501–2512 共1991兲. 10 P. A. Nelson, “A review of some inverse problems in acoustics,” Int. J. Acoust. Vib. 6, 118–134 共2001兲. 11 P. M. Morse, Vibration and Sound, 2nd ed. 共McGraw–Hill, New York, 1948兲. 12 A. J. Bullmore, P. A. Nelson, A. R. D. Curtis, and S. J. Elliott, “The active minimization of harmonic enclosed sound fields, part II: A computer simulation,” J. Sound Vib. 117, 15–33 共1987兲. Stefanakis et al.: Letters to the Editor