Noname manuscript No. (will be inserted by the editor)
Power Series based Algorithm for Dedicated Protection in WDM Optical Networks Andr´ e V. S. Xavier · Raul C. Almeida Jr. · Daniel A. R. Chaves · Carmelo J. A. Bastos-Filho · Joaquim F. Martins-Filho
Received: date / Accepted: date
Abstract WDM optical networks allow the transmission of multiple services with high rates and low cost. Therefore, the occurrence of a failure in any network element can cause loss of several services. Some survival mechanisms may be used to try to overcome this type of failure event. We present in this paper a new dedicated protection algorithm for link-failure survivability in WDM optical networks, referred to as Power Series based Dedicated Protection (PSDP) Algorithm. PSDP is based on the evaluation of the network links’ costs by using a power series expansion. This power series expansion uses input variables based on some relevant information of the network such as link physical length and wavelength availability. Other contribution of this paper is to propose a new input variable based on the wavelength continuity constraint. The performance of the proposed algorithm is compared to other well known algorithms in the literature. We also propose a modification in Suurballe’s algorithm and compare it with our PSDP algorithm. Three different topologies are used in our simulations and statistical analysis is performed on the results of the investigated algorithms. In all simulated cases, PSDP algorithm outperformed the other analyzed algorithms. Keywords WDM optical networks · Dedicated protection · Single failure · Resilience · Function expansion Andre V. S. Xavier · Raul C. Almeida Jr. · Joaquim F. Martins-Filho Department of Electronics and Systems, Federal University of Pernambuco, 50.740–550 Recife, PE, Brazil E-mail:
[email protected] Daniel A. R. Chaves · Carmelo J. A. Bastos-Filho Polytechnic School of Pernambuco, University of Pernambuco, 50.720–001 Recife, PE, Brazil E-mail:
[email protected],
[email protected]
1 Introduction Optical communication systems have provided an infrastructure to deal with increased traffic demand in telecommunication systems. This increase nowadays is mainly caused by services and business on the Internet, such as video on demand, cloud and grid computing [1] [2]. Wavelength division multiplexing (WDM) optical networks can be classified in three different types regarding the presence or not of signal regeneration: opaque, translucent and transparent. In opaque WDM optical networks, the signal is regenerated in all intermediate nodes up to the destination. In transparent WDM optical networks, the signal is transmitted in the optical domain, without suffering Optical-Electrical-Optical (OE-O) regenerations. In translucent WDM optical networks, some of the nodes have regenerators and the signal can be regenerated in some of them according to a predefined policy. In this paper, we are considering transparent WDM optical networks, since this is the worst case because the physical layer effects are more severe in these networks. It occurs due to the accumulation of noise and distortion along the path, specially for long haul networks [3] [4]. In WDM optical networks, the traffic can be classified in three types: static, incremental, and dynamic. In the static traffic, the set of call requests is known in advance, and the main objective is to minimize the number of wavelengths needed to establish a predefined set of call requests for a given network physical topology. In the incremental traffic, call requests arrive sequentially, a lightpath is established for each call request, and the lightpath remains in the network indefinitely. For the case of dynamic traffic, a lightpath is set up for each call request as it arrives, and the lightpath is re-
2
leased after some finite amount of time. The objective in the incremental and dynamic traffic is to minimize the blocking probability, while optimizing the availability of resources [5]. In this paper, we consider the case of dynamic traffic for all simulations, since it is the more unpredictable scenario. Routing and wavelengths assignment (RWA) process is a key factor that influences how resources are efficiently used in optical networks. The RWA process consists of finding a proper route and a wavelength for each call request. One of the main challenges to the RWA process is the wavelength-continuity constraint. This restriction imposes that, without either wavelength or O/E/O conversion, the same wavelength must be used in all links along a route [5]. Other important challenge is to provide some survival mechanism against failure, since the occurrence of a single failure in any network element, such as optical fiber or crossconnectors, can lead to massive loss of information, in order of Terabits [6] [7]. The survivability mechanisms have been classified into protection or restoration schemes, as shown in Fig. 1. The protection schemes are based on resource reservation and its main advantages is the fast recovery of protected connections. Protection schemes can be divided into dedicated and shared protection. In dedicated protection, when a call request arrives, both a working lightpath (working route and wavelength) and a link-disjoint backup lightpath are set up to attend to this call request. In the shared protection, the backup route may share some or all of its physical resources with others backup routes [6]. Restoration schemes are based on dynamic discovery of resource after the occurrence of failure. When a connection is interrupted, the restoration algorithm tries to find a new lightpath to reestablish the interrupted connections. The restoration is more efficient in terms network capacity utilization, although it can not guarantee an available lightpaths to establish the affected calls. There are three main strategies to perform restoration in a network: Path restoration, Subpath restoration and Link restoration. In the path restoration, one tries to find a new lightpath from the source node to the destination node. In the link restoration, one tries to find a new lightpath between the adjacent nodes to the failure. Finally, in the subpath restoration, one tries to find a lightpath from the previous node to the failure until the destination node [7]. Some approaches to solve the survivability problem are based on graph algorithms. A first approach is known as two-step approach, in which the working path is determined over the network topology and the links used by the selected working path are temporarily
Andr´ e V. S. Xavier et al.
Fig. 1 Survivability mechanisms.
removed from the network in order to determine the backup path. Shortest path algorithms, such as Dijkstra’s algorithm or Bellman-Ford’s algorithm, are used to determine both the working and backup paths [8]. The implementation of the two-step approach is simple, but may fail in some network topologies, such as the one referred to as trap topology [9]. Trap topology has one or more critical links that may make unfeasible the backup path. A second approach is known as onestep approach, in which both working path and backup path are calculated simultaneously. This approach can resolve the above disadvantage of two-step approach. The Suurballe’s algorithm [10] and Bhandari’s algorithm [11] are examples of one-step approach. After the routing definition, a wavelength assignment policy is performed. In this paper, we focus on dedicated protection scheme in order to ensure a faster recovery from single failure and easier implementation, although such scheme presents a high resource utilization ratio. Although shared protection optimizes the use of resources since it does not require exclusive protection paths. We propose a novel algorithm to protect call requests against a single failure in transparent WDM network considering physical layer impairments. The proposed algorithm is named Power Series based Dedicated Protection (PSDP). PSDP evaluates the network links’ costs based on power series expansion in order to find a link-disjoint route pair (working route and backup route) with minimum cost. This power series expansion includes information from the physical layer in the routing decision process. The remainder of the paper is organized as follows. In Section 2, we present some related works and some solutions in the literature, whereas in Section 3 we present a detailed description of the PSDP algorithm and the used input variables to the problem. Section 4 details the simulation setup and the parameters used in the simulations. In Section 5, we present and discuss the simulation results and in Section 6 we present our conclusions.
Power Series based Algorithm for Dedicated Protection in WDM Optical Networks
2 Related works In this section, we review some contributions that are closely related to this work and some solutions in the literature for solving the dedicated protection problem in optical networks.
The second step is to describe the cost function in terms of a power series in agreement with the chosen parameters [13], as depicted in Eq. (3).
Ci,j = 2.1 Adaptive Routing Algorithms
di,j , (1) dmax in which di,j is the link length between nodes i and j, and dmax is the maximum link length in the network. The availability yi,j (between the nodes i and j) is defined as [12,13]: xi,j =
λai,j , λTi,j
N N ∑ ∑
n1 , ∀i ̸= j bn0 ,n1 xni,j0 yi,j
(3)
n0 =0 n1 =0
Chaves et al. proposed two optimized approaches to evaluate the link costs in a transparent optical network: Physical Impairment Aware Weight Function (PIAWF) [12] and Power Series Routing (PSR) [13]. Both algorithms use an adaptive link weight function that considers two simple network information to take into account the physical layer impairments in an indirect manner through a training phase: the physical link length and the link availability. These parameters are used as the inputs of an adaptive impairment aware routing algorithm. In [14] et al. proposed a novel path restoration algorithm based on the power series routing (PSR) algorithm, named PSR-R. PSR-R uses a cost function expanded on power series with the objective of finding restoration routes that minimize the rate of unsuccessful failure recovery. PSR proposes the use of an expanded function in terms of a power series (Taylor series) to evaluate the cost of a link during the calculations of the routes. This expansion in a power series for the PSR allows the routing process to include more information from the network. The PSR cost function definition has some steps. The first step is to choose the input variables for the cost function. The link availability and the link length were used in the original paper and are also used in this paper. Furthermore, a new input variable based on the continuity of available wavelengths is shown in subsection 3.1. The normalized physical link length xi,j is defined as [12, 13]:
yi,j =
3
(2)
in which λai,j and λTi,j are, respectively, the number of current unused wavelengths and the total number of wavelength in the link from node i to node j.
in which Ci,j is the cost function that is used to evaluate the cost of the link between nodes i and j, and N is an integer that defines the number of terms used in the power series expansion. We defined Ci,j = ∞, ∀i = j, and bn0 ,n1 are the coefficients of the series. This expansion allows the algorithm to include a weighted sum of the number of hops, physical length of the links and/or availability of wavelengths. The third step is to choose a network performance indicator as optimization target. We selected the network blocking probability as the optimization target, since we are dealing with dynamic traffic and this is the most common used measure for this case. The fourth step consists of using a global optimizer in order to find the bn0 ,n1 coefficients for the power series that optimize the selected performance indicator. One can observe from (3) that the bn0 ,n1 coefficients must be optimized in the cost function Ci,j . The PSR uses the Particle Swarm Optimization (PSO) algorithm as the global optimizer [15, 16]. The main reason to choose PSO is due to the PSO capability to solve optimization problems with numerous continuous variables. The coefficients bn0 ,n1 are calculated in an off-line manner (training phase), i.e. before the network operation. The PSO finds the cost function that matches the input parameters in the best manner in order to minimize the blocking probability. The main advantage of PSR is that the majority of the computational effort is required during training phase, which is performed offline, i.e., prior to the network operation. Another advantage is that the routing algorithm can work well in any topology and impairment profiles if they are properly considered in the training phase [13]. The PSO is a bio-inspired optimization algorithm. It is a population-based algorithm proposed by Kennedy and Eberhart [15, 16]. Each particle i has a position in the search space, which represents a possible solution for the problem. The positions are updated based on the velocities of the particles and the velocities of the particles depend on the best position obtained by the particle during the search process (pi ) and the best position obtained by neighbor particles during the search process (ni ).
4
2.2 Protection Algorithms Suurballe et al. [10] proposed an algorithm of one-step approach for efficient protection provisioning. This algorithm finds a pair of link-disjoint routes in the network, avoiding the problem of the trap topology. The complexity of Suurballe’s algorithm to find a pair of link-disjoint routes is O(nlogn), in which n is the number of nodes in the network. Some contributions in dedicated protection were proposed recently: Zhai et al. adapted a routing algorithm, called Highest Q factor (HQ) algorithm, in order to solve the dedicated protection problem in WDM optical networks. The HQ algorithm finds for each wavelength a candidate route and the Q factor is calculated for each route. Among all the found routes, the route with highest Q factor is selected to attend to the connection request. The adapted algorithm by Zhai et al. is a twostep approach algorithm, in which the first and second routes are selected according to the HQ algorithm [17]. Liu et al. [18] proposed three approaches based on two-step approach to solve the dedicated protection and grooming problems in Mixed Line Rates (MLR) optical networks. These approaches consider the maximization of transmission rate and reduction of transponders’ cost. Monti et al. [19] presented a heuristic based on Suurballe’s algorithm that finds a pair of link-disjoint routes with lower energy consumption in WDM optical networks with static traffic. The proposed algorithm is able to assign some links and nodes to support only protection lightpaths, where it is possible to set the devices on such links and nodes to sleep mode.
Andr´ e V. S. Xavier et al.
3 PSDP Algorithm In this work, we propose a new algorithm for dedicated protection in WDM optical networks. The proposed algorithm is named Power Series based Dedicated Protection (PSDP). It uses a cost function based on power series expansion to evaluate the cost of the network links. One or more input variables are used in the cost function. These variables are important network information such as physical length and/or wavelength availability. Another contribution of this paper is to propose a new input variable based on wavelength continuity constraint. The use of the PSDP in the network relies upon two phases: the training phase and the operational phase. In the training phase, the PSO finds the cost function that minimizes the network blocking probability. In the operational phase, the PSDP is used as a one-step approach algorithm during the online network operation. we evaluate our proposal through network simulations. In Section 3.1, we show the main stages used to define the cost function in the PSDP. This section also presents the considered input variables and we define the new proposal metrics to be used as an input variable. In Section 3.2, we present the training process phases, and in Section 3.3 the PSDP operational phase is presented.
3.1 Building the PSR cost function
The first step to build the PSR cost function is to choose appropriate input parameters. The normalized link length (xi,j ) and the normalized link availability (yi,j ) were used as input parameters, as shown in Eq. (1) and Eq. (2), respectively. The chosen input parameters Soproni et al. [22] proposed a meta-heuristic apmust have tight relation with the desired objective metproach based on Bacterial Evolutionary, referred as Bacrics. The information about link length, link availability terial Evolutionary Algorithm (BEA). It finds a miniand number of hops has high correlation with the camum cost dedicated protection solution with different pability of finding a free wavelength along the links of shared risk link groups (SRLGs). The performance of a route as well as with the noise accumulated along the BEA was compared with other heuristics in terms of lightpath in optical networks. In fact, as the link length SRLG failure and network load. increases, a larger number of optical amplifiers must be Beshir et al. [23] studied the regenerator placement deployed or higher gains must be provided by the amproblem in survivable WDM optical networks, where plifiers to compensate for the link losses. As a result, the objective is to minimize the total number of inmore ASE (Amplified Spontaneous Emission) noise is stalled regenerators such that feasible working and backup added by these devices in the lightpath. In addition, the lightpaths can be assigned to the call request given by link usage has impact in amplifier saturation and ASE a traffic matrix. They considered two cases: In the case noise generation, since the amplifier gain and noise fiof dedicated protection, they proposed one approach gure depend on the total input signal power. The link based on Suurballe’s algorithm; whereas for the case availability not just has impact on the chance of findof shared protection, they proposed two-step approach ing a free wavelength for a path request, but also on based on Dijkstra’s algorithm. the generation of non-linear noise effects like four-wave
Power Series based Algorithm for Dedicated Protection in WDM Optical Networks
mixing (FWM) and cross-phase modulation (XPM). Finally, as the number of hops increases, additional more cross-talk noise is added within the OXC (optical crossconnect) located at intermediate nodes [13]. The normalized link availability (yi,j )is based on the wavelengths availability in the link, but it does not consider information about the continuity of this channel over the adjacent links. In this paper, we propose a new input parameter based on the wavelength continuity constraint, called Local Wavelength Continuity. The local wavelength continuity (zi,j ) computes the wavelengths’ availability in the link between nodes i and j, as well as the continuity of the wavelength availability in adjacent links. zi,j is defined as:
zi,j =
1
δλ =
{ 1, if λ is free between the nodes i and j; 0, otherwise. {
φ∗ =
1, if δλ = 1 and a∗,λ ≥ 2; 0, otherwise.
5
(5)
(6)
λT
i,j ∑
(φi ai,λ + φj aj,λ )δλ , λTi,j (GTi + GTj ) λ=0
(4)
in which λTi,j is the total number of wavelengths in the link from node i to node j; GTi and GTj are, respectively, the total number of links connected to nodes i and j, i.e., the individual node degrees. The term λTi,j (GTi + GTj ) in (4) is used as normalization factor of zi,j . δλ represents the availability of the λ-th wavelength in the link between nodes i and j, as defined (5); ai,λ and aj,λ represent the number of links connected to nodes i and j, respectively, with availability on the λth wavelength; φi and φj (defined in Eq. (6)), inhibits the contribution of ai,λ and aj,λ , respectively, in case of there is not continuity of the λ-th wavelength in none of the adjacent links to the analyzed nodes. Note that in (6), the condition δλ = 1 and a∗,λ ≥ 2 ensures the availability of the λ-th wavelength between nodes i and j, and there is continuity of the λ-th wavelength on at least two of the links in a∗,λ . In (6), ∗ represents the analyzed node, either node i or j. When the PSR cost function using the parameter zi,j calculates the link cost, it considers the wavelengths’ availability in the analyzed link and the continuity of this wavelengths in adjacent links. This allows that the PSDP choose the links that make up the working and backup routes that have better wavelengths availability/continuity reducing network blocking probability. Already, PSR cost function using parameter yi,j calculates wavelengths’ availability, but it does not take into account the continuity of wavelengths in adjacent links, increasing the network blocking probability due the lack of continuity of wavelengths.
Fig. 2 Example of a network state and the calculation of the link cost.
Figure 2 illustrates an example to evaluate the cost of a link for a specific availability state of link i − j and its adjacent links. For each connection request, the evaluation of the network links’ cost is performed only once, although the adjacent links of an analyzed link may be considered in the calculation of the cost of another link. The length of the working and backup routes will depend on the importance that PSO gives to the link length and its wavelength availability/continuity, which results from the PSO training phase coefficient adjustment. In some cases, PSDP may choose a longer route, but with higher wavelength availability/continuity end to end. It is assumed that the total number of wavelengths, λTi,j = 3, what are represented as: λ1 (blue and continuous line), λ2 (green and dashed line) and λ3 (red and dotted line). Considering the constants λTi,j = 3, GTi = 3 and GTj = 4, one can calculate the cost of zi,j as shown in (7):
zi,j =
1 5 [(3 + 2) + (0) + (0)] = . 3(3 + 4) 21
(7)
The second step is to describe the cost function in terms of a power series, as in (3), after defining the number of network parameters chosen as input variables. The computational complexity of the PSR cost function in Eq. (3), which was O(N 2 ), can be reduced to O(N ) if we consider bn0 ,n1 = bn0 bn1 and substitute it in (3):
6
Andr´ e V. S. Xavier et al.
Ci,j = f (xi,j , yi,j ) =
N N ∑ ∑
n1 bn0 bn1 xni,j0 yi,j , ∀i ̸= j (8)
n0 =0 n1 =0
Reorganizing the terms in function of n0 and n1 in Eq. (8):
′
Ci,j = f (xi,j , yi,j ) = (
N ∑ n0 =0
N ∑
bn0 xni,j0 )(
n1 bn1 yi,j ), ∀i ̸= j.
n1 =0
(9) The advantage of evaluating the cost as shown in (9) is the reduction of the dimensionality that the optimization process must deal with during the training stage of PSDP. Eq. (3) uses (N + 1)2 coefficients to evaluate the network links, whereas in (9) there are just 2(N + 1) coefficients to be optimized.
3.2 PSDP algorithm training phase The training stage consists of finding the bn coefficients through an optimization process to minimize the network blocking probability. We used the particle swarm optimization (PSO) algorithm to perform this optimization. The main steps of the optimization process using the PSO algorithm are shown in Fig. 3.
equations used to update the velocity and the position of the particle are shown in equations (10) and (11), respectively, where χ is the constriction factor [16], ε1 and ε2 are random real numbers inside the interval 0 to 1 and c1 and c2 are constants. Algorithm 1 depicts the pseudocode of the PSO algorithm. Figure 3 shows a schematic diagram of the training phase of PSDP algorithm. In Fig. 3(a), a set of particles are randomly initialized in the search space of the problem. An example of particle is shown in Table 1. In Fig. 3(b), (c) and (d), the PSDP algorithm evaluates the coefficients of each particle in the network topology and updates the fitness of this particle with the obtained value from the performance indicator. The performance indicator is the resulting blocking probability obtained from the simulation tool using the PSDP algorithm with the coefficients of the particle. In Fig. 3(e), the particle with best stored information influences and attracts the other particles of the swarm for its region in the search space. Steps (b), (c), (d) and (e) are performed for all particles until the convergence of the algorithm is achieved. At the end, the best particle of the optimization process is chosen as the particle with coefficients that best fit the network configuration. vt+1 = χ[vti + c1 ε1 (pti − xti ) + c2 ε2 (nti − xti )], i
(10)
xt+1 = (vt+1 + xti ), i i
(11)
Algorithm 1 PSO pseudocode.
Fig. 3 The main steps of the optimization process using the PSO algorithm.
In the optimization process, the position (xi ) of each particle i within the search space represents the set of coefficients (bn0 ,n1 ) to be used in the PSR cost function. The positions (xi ) are updated based on the velocities of the particles and the velocities of the particles depend on the best position obtained by the particle during the search process (pi ) and the best position obtained by neighbor particles during the search process (ni ). The
1: 2: 3: 4: 5: 6: 7: 8: 9: 10: 11: 12: 13: 14: 15:
Generate particles randomly; for each IP SO iterations do for each particle i do Evaluate the velocity; Update the position; Evaluate the fitness in the new position; if f (pi ) > f (xi ) then pi := xi ; end if if f (ni < f (pi )) then ni := pi ; end if end for end for Return the best particle.
3.3 PSDP algorithm operational phase The PSDP algorithm defines a cost function for the network links based on a function expanded in a power
Power Series based Algorithm for Dedicated Protection in WDM Optical Networks Table 1 Example of a particle encoding for the training phase, considering N = 4. bn0
Value
bn1
Value
b0 b1 b2 b3 b4
-0.936646 0.498962 0.147461 -0.914551 -0.569153
b0 b1 b2 b3 b4
-0.605652 -0.066467 -0.445801 0.560547 -0.223999
series. The definition of the cost function is performed off-line. After the training phase, the cost function can be used in the online network operation. During the operational phase, for each request, the PSDP finds a pair of link-disjoint routes that present the lowest cost. The PSDP can aggregate the benefits of an adaptive RWA by considering the physical layer effects and can include information about the wavelength assignment.
7
Algorithm 2 PSDP operational pseudocode. 1: Input: call request, network topology; 2: Compute the network topology’s cost matrix (M) using the PSR cost function; 3: Find a route (P1 ) with minimum cost using the Dijkstra’s algorithm considering the costs recordered in M; 4: Remove temporarily the uplinks of P1 from M and find a new route (P2 ) with minimum cost using the Dijkstra’s algorithm; 5: Restore the uplinks of P1 in M; 6: if P1 shares links with P2 then 7: Remove the shared links between P1 and P2 from M; 8: Find the working route with minimum cost using the Dijkstra’s algorithm and M matrix; Remove the links of working route from M and find the 9: backup route with minimum cost using the Dijkstra’s algorithm and M matrix; 10: return working and backup routes. 11: else 12: working route ← P1 ; 13: backup route ← P2 ; 14: return working and backup routes. 15: end if
4 Simulation Setup The PSDP algorithm operational pseudocode is presented in Algorithm 2. It evaluates the cost of the network links using the PSR cost function to compute the network cost matrix, M (line 2). Then, the algorithm applies some steps proposed by Suurballe, as descrited in the section II in [10] and detailed below, in order to deal with the trap topology. It finds a route P1 with minimum cost in M (line 3), and finds a new route, P2 (line 4). If the route P2 is not found, which depends on the network topology, an empty route is returned by Dijkstra’s algorithm and, in the line 6, the evaluation becomes false and the PSDP performs the steps in lines 12-14. The PSDP compares and removes the shared links between P1 and P2 . These shared links must be avoided when the algorithm calculates the working and backup routes (lines 6-10), since the use of these links by the working route may turn it impossible to find a backup route [25]. Note that it is not possible that Suurballe’s algorithm returns a couple of feasible routes and PSDP doesn’t. However, PSDP may find a different solution in comparison to the Suurballe’s algorithm, as the coefficients of the PSR cost function is optimized for a specific topology so that the path blocking probability is reduced. If the pair of feasible routes provided by Suurballe’s algorithm or PSDP will be available will depend on the current network state. Simulations show that, with higher probability, the pair of feasible solutions provided by PSDP will have a greater chance of being available than the pair provided by Suurballe’s algorithm.
The BP is obtained as the ratio of the number of blocked connection requests to the total number of connection request. For the connection request to be accepted in the network, the dedicated protection algorithm has to find a pair of link-disjoint routes with both available resources (wavelength) and enough quality of transmission (QoT). Fig. 4 shows the flowchart of the dedicated protection and wavelength assignment algorithms in the network simulation. We have adapted the SIMTON simulation tool [26] to estimate the blocking probability of dedicated protection algorithms in survivable WDM optical network scenarios. The SIMTON uses the physical layer model described in [27], but other physical layer models can be used. For each network simulation, a set of 105 calls is generated with uniformly distributed source-destination node pairs for each connection request. The connection request arrival process is characterized as a Poisson process and the time duration for each established lightpath is characterized as an Exponential distribution. After the selection of a pair of link-disjoint routes, if any of them is not able to attend to either the working path or backup path of the connection request, because of either lack of resources or inadequate quality of transmission, the connection request is blocked, as shows the Fig. 4. We used three different network topologies in our simulations, which we call Topology 1, Topology 2 and Topology 3, as shown in Figs. 5, 6 and 7, respectively. All links from the Topology 3 have 100 km. We assume circuit-switched bidirectional connections in two
8
Andr´ e V. S. Xavier et al.
Fig. 5 Topology 1.
Fig. 6 Topology 2.
Fig. 4 Flowchart of the dedicated protection and wavelength assignment algorithms employed in the network simulations.
optical fibers and no wavelength conversion capabilities. The physical layer impairments considered in this paper are: the ASE (Amplified Spontaneous Emission) noise, optical amplifier gain and ASE saturation in the amplifiers. The optical parameters used in the simulations are shown in Table 2. The output transmission powers (Plaser ) for topologies 1, 2 and 3 were 0 dBm, −5 dBm and −5 dBm, respectively. The output transmission power has been adjusted for each topology so that the path blocking probability has contributions from both the lack of available wavelengths and of QoT. We assume a single modulation format in our simulations. The default parameters depicted in Table 2 are close to the values used in real systems. The link length (xi,j ), link availability (yi,j ) and local wavelength-continuity (zi,j ) are used as input parameters in our simulations. We used the PSDP algorithm with different combination of these input parameters as PSDP(x), PSDP(y), PSDP(x,y) and PSDP(x,z). We used two versions of the Suurballe’s algorithm for the sake of comparison algorithms. The first version is the classical algorithm, which uses the link length (xi,j ) for the link cost function. For the second version, we adapted the algorithm to use the link availability
Fig. 7 Topology 3. Table 2 Default simulation parameters. Parameter
Value
Definition
Psat OSN Rin OSN RQoS Bo W ∆f α LM ux LDemux LSwitch NF
24 dBm 30 dB 14 dB 100 GHz 40 100 GHz 0.2 dB/km 2 dB 2 dB 12 dB 5.5 dB
Ampl. output sat. power Input OSNR OSNR for QoT criterion Optical fiber bandwidth Number of wavelengths Channel spacing Fiber loss coefficient Multiplexer loss Demultiplexer loss Optical switch loss Amplifier Noise figure
(yi,j ) as parameter to evaluate the network links’ costs. Such versions are referred to as Suurballe(x) and Suurballe(y), respectively. We used the First Fit (FF ) as the
Power Series based Algorithm for Dedicated Protection in WDM Optical Networks
9
Table 3 Default simulation parameters used in PSO. 0.18
Parameter
Value
Definition
L IP SO c1 , c 2 ε1 , ε2 χ S V
30 200 2.05 U[0,1] 0.72984 [-1,+1] [-1,+1]
Numbers of particles Numbers of iterations Acceleration coefficients Random numbers Constriction factor Search space Velocity limits
PSDP(x)
0.16
Blocking probability
0.14
0.12
0.10
0.08
0.06
0.04
0.02
0.00 1
wavelength assignment policy in all algorithms in this paper. The coefficients bn for the cost function of PSDP were optimized only for a network load of 30 erlang for Topology 1, 70 erlang for Topology 2 and 165 erlang for Topology 3 (about the average load used in our simulations in subsection 3.2). For each topology, the chosen network load used on the training stage refers to an approximate blocking probability of 1% when Suurballe(y) algorithm is performed. The simulation parameters used in the PSO optimization process are shown in Table 3. In order to evaluate the blocking probability of a given particle, we simulated a set of 105 connection requests. We used N = 4 for the number of terms in the PSDP cost function based on the results presented in [28] for routing without protection. The computational complexity of the investigated algorithms in this simulation are shown in Table 4, where n represents the number of network nodes, N is the number of terms in the power series expansion, and λ is the total number of wavelengths in the network. Analyzing the computational complexity expressions, it can be observed that the higher is the amount of network information used to reduce the path blocking probability, the higher is the implementation cost of the algorithm.
Table 4 Computational complexity of the algorithms used in the simulations. Algorithm
Computational Complexity
Suurballe(x) Suurballe(y) P SDP (x) P SDP (y) P SDP (x, y) P SDP (x, z)
O(nlogn) O(n2 λ) O(n2 N ) O[n2 (λ + 2N )] O[n2 (λ + 4N )] O[n2 (nλ + 4N )]
5
10
20
30
40
50
60
70
80
90 100 120 140 160 180 200
Iterations
Fig. 8 Box and whiskers representation of the statistical analysis of P SDP (x) algorithm, obtained by a set of 30 different runs of the PSO for topology 2.
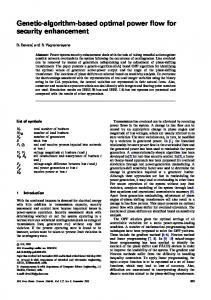
5 Results In this section, we present the simulation results when the PSDP algorithm is used to solve the dedicated protection problem. We performed a statistical analysis of all proposed algorithms in both the training and operational phase, but due to lack of space in this paper, we just present the statistical analysis for topology 2. We also performed a comparison of all investigated algorithms on all considered networks in terms of network blocking probability.
5.1 Training phase results The PSDP algorithm requires a training phase to find the optimized bn coefficients, as discussed in Section 3.2. We executed the PSO to perform the optimization. Since the connection request is only accepted in the network when it is protected, the goal of the optimization process is to minimize the network blocking probability. Figures 8, 9, 10 and 11 show, respectively, the box and whiskers representations of the statistical analysis of P SDP (x), P SDP (y), P SDP (x, y) and P SDP (x, z) algorithms in Topology 2. For each algorithm, the PSO was executed 30 times. One can observe from Fig. 8 that P SDP (x) converges after approximately 120 iterations and its minimum achieved blocking probability is the highest among the analyzed algorithms, which may be explained by the fact that it considers just the link length information as input parameter. P SDP (y), P SDP (x, y) and P SDP (x, z) algorithms’ convergences, occur after 80 iterations and they have presented the best results in terms of blocking probability. This occurs because such algorithms consider information about the wavelength availability during the training process.
10
Andr´ e V. S. Xavier et al.
0.03
0.013
PSDP(x)
PSDP(y)
PSDP(y)
0.012
PSDP(x,y)
Blocking probability
Blocking propability
PSDP(x,z)
0.02
0.011
0.010
0.009
0.01
0.008
1
5
10
20
30
40
50
60
70
80
90 100 120 140 160 180 200
0.007 0
iterations
50
100
150
200
Iterations
Fig. 9 Box and whiskers representation of the statistical analysis of P SDP (y) algorithm, obtained by a set of 30 different runs of the PSO for topology 2.
Fig. 12 Convergence trace of the average value of 30 different runs of PSO and its margin of error at 95% confidence interval for the P SDP (x), P SDP (y), P SDP (x, y) and P SDP (x, z) algorithms on topology 1.
0.03
PSDP(x,y) 0.05
PSDP(y) 0.02
PSDP(x,y)
0.04
PSDP(x,z) Blocking probability
Blocking probability
PSDP(x)
0.01
1
5
10
20
30
40
50
60
70
80
0.03
0.02
90 100 120 140 160 180 200
0.01
Iterations
Fig. 10 Box and whiskers representation of the statistical analysis of P SDP (x, y) algorithm, obtained by a set of 30 different runs of the PSO for topology 2.
0
50
100
150
200
Iterations
Fig. 13 Convergence trace of the average value of 30 different runs of PSO and its margin of error at 95% confidence interval for the P SDP (x), P SDP (y), P SDP (x, y) and P SDP (x, z) algorithms on topology 2.
0.03
Blocking probability
PSDP(x,z)
0.02
0.01
1
5
10
20
30
40
50
60
70
80
90 100 120 140 160 180 200
Iterations
Fig. 11 Box and whiskers representation of the statistical analysis of P SDP (x, z) algorithm, obtained by a set of 30 different runs of the PSO for topology 2.
Figures 12, 13 and 14 show the convergence trace of the average value of 30 different runs of PSO and its margin of error at 95% confidence interval for the P SDP (x), P SDP (y), P SDP (x, y) and P SDP (x, z) algorithms used at topologies 1, 2 and 3, respectively. Notice that, in some graphs, the margin of error is too small that can not be observed. One can observe that P SDP (x) obtained the worst performance in all topologies. In addition, the P SDP (x, z) algorithm obtained a similar performance to P SDP (x, y) algorithm topology 1, as can be noted in Fig. 12, whereas the P SDP (x, z) algorithm outperforms all other algorithms in both topologies 2 and 3, as shown in Figs. 13 and 14, respectively. This occurs because the P SDP (x, z) algorithm considers the same information as P SDP (x, y) does, but
Power Series based Algorithm for Dedicated Protection in WDM Optical Networks
11
0.10 0.2
Suurballe(x)
0.18
PSDP(x) 0.06
PSDP(y) PSDP(x,y) PSDP(x,z)
0.04
Blocking probability
Blocking probability
0.08
0.02
0.16
0.14
0.12
0.1
64
0.00 0
50
100
150
66
68
70
72
74
76
78
80
Network load (erlang)
200
Iterations
Fig. 14 Convergence trace of the average value of 30 different runs of PSO and its margin of error at 95% confidence interval for the P SDP (x), P SDP (y), P SDP (x, y) and P SDP (x, z) algorithms on topology 3.
Fig. 15 Box and whiskers representation of the statistical analysis of Suurballe(x) algorithm, obtained by a set of 30 different runs on the topology 2.
0,1
5.2 Operational phase results After finding the bn coefficients, we can use the PSDP to solve the dedicated protection problem during oper-
Suurballe(y)
Blocking probability
also analyzes the continuity of wavelengths in a region around each analyzed link. One important network characteristic is the node degree, which is the number of links connected to the node. The node degree will impact the number of alternative routes that a routing mechanism may choose and therefore is an important characteristic of the network. Topologies 1, 2 and 3 have an average node degree of 2.7, 3 and 4, respectively. In topology 1, the links are concentrated in a few nodes. In topologies 2 and 3, the links are more distributed across all nodes. One reason for the similar performance of P SDP (x, z) and P SDP (x, y) in topology 1, as shown in Fig. 12, is due the concentration of links in few nodes. Topology 1 has most nodes with connectivity equal to 2. Thus, when a connection request arrives to the network, if the source and/or destination nodes of this connection request have connectivity equal to 2, the information about the continuity of wavelengths in the parameter z do not provide much benefits to mitigate the network blocking probability. When the links are more distributed across all nodes such as occurs in topologies 2 and 3, the number of alternate routes in the network is increased and the benefit of the information about continuity of wavelengths in parameter z reduces the path blocking probability.
0,01
64
66
68
70
72
74
76
78
80
Network load (erlang)
Fig. 16 Box and whiskers representation of the statistical analysis of Suurballe(y) algorithm, obtained by a set of 30 different runs on the topology 2.
ational phase. Note that the bn coefficients were optimized only for a network load in each network topology as shown in sec. 4. Figures 15, 16, 17, 18, 19 and 20 show the box and whiskers representation of the statistical analysis of all investigated algorithms, obtained by a set of 30 different runs on the topology 2. Note that for each set of bn coefficients obtained in the training phase, a curve was generated with the network blocking probability as a function of network load. One can observe that the variability of the results is not high and is similar for PSDP and the suurballe’s algorithm Figures 21, 22 and 23 show the comparison of the blocking probability as a function of the network load of the average value of 30 different runs and its margin of error at 95% confidence interval for all investigated algorithms on the topologies 1, 2 and 3, respectively. One can observe from Fig. 21 that P SDP (x, z)
12
Andr´ e V. S. Xavier et al.
0.1
0.1
PSDP(x,z)
Blocking probability
Blocking probability
PSDP(x)
0.01
0.01
64
66
68
70
72
74
76
78
80
64
66
68
70
72
74
76
78
80
Network load (erlang)
Network load (erlang)
Fig. 17 Box and whiskers representation of the statistical analysis of P SDP (x) algorithm, obtained by a set of 30 different runs on the topology 2.
Fig. 20 Box and whiskers representation of the statistical analysis of P SDP (x, z) algorithm, obtained by a set of 30 different runs on the topology 2.
0.1
0.01
Blocking probability
Blocking probability
PSDP(y)
0.01
PSDP(x) PSDP(y) PSDP(x,y) 1E-3
PSDP(x,z) Suurballe(x) Suurballe(y)
64
66
68
70
72
74
76
78
80
Network load (erlang)
20
25
30
35
40
Network load (erlang)
Fig. 18 Box and whiskers representation of the statistical analysis of P SDP (y) algorithm, obtained by a set of 30 different runs on the topology 2.
Fig. 21 Comparison of the blocking probability as a function of the network load of the average value of 30 different runs and its margin of error at 95% confidence interval of all investigated algorithms on the topology 1.
0.1
Blocking probability
PSDP(x,y)
0.01
64
66
68
70
72
74
76
78
80
Network load (erlang)
Fig. 19 Box and whiskers representation of the statistical analysis of P SDP (x, y) algorithm, obtained by a set of 30 different runs on the topology 2.
obtained similar performance P SDP (x, y), but it outperformed the other algorithms on topologies 2 and 3, as shown in Figs. 22 and 23. Suurballe(x) obtained the worst performance in all the topologies, but if we change the cost function of the algorithm to consider link availability (y), represented as Suurballe(y), we can see that the algorithm achieves a significant improvement in the network blocking probability. One should observe that the Suurballe(y) is also a proposal of this paper. We can also observe that the wavelength management is extremely important to minimize the network blocking probability for all algorithms. In all scenarios, P SDP (x, z) obtained either similar or better performance compared to the other algorithms. This suggests that the proposed algorithm can be used in different network scenarios.
Power Series based Algorithm for Dedicated Protection in WDM Optical Networks
Blocking probability
0.1
0.01
PSDP(x) PSDP(y) PSDP(x,y) PSDP(x,z) Suurballe(x) Suurballe(y) 1E-3 62
64
66
68
70
72
74
76
78
80
82
Network load (erlang)
Fig. 22 Comparison of the blocking probability as a function of the network load of the average value of 30 different runs and its margin of error at 95% confidence interval of all investigated algorithms on the topology 2.
Blocking probability
0.1
0.01
13
PSDP. We performed simulations in three different topologies. For physical impairment evaluation we used a simple model based on ONSR that considers ASE noise generation, optical amplifier gain and ASE saturation. PSDP uses network parameters to calculate the cost of each link. In this paper, we assessed three input parameters for the link cost function: link length, link availability and the last parameter takes into account the wavelength continuity constraint. The PSDP algorithm requires a training phase to determine the coefficients bn before the network operation. This characteristic of a priori knowledge of the network behavior reduces the computational time for the online dedicated protection process. We compared our algorithm to other well known algorithm in terms of the blocking probability and we demonstrated that the PSDP algorithm outperformed it. We also performed a statistical analysis of all the investigated algorithm in both training and operational phase for all topologies. All results show the importance of taking into account information about the wavelengths availability and the network characteristics in the dedicated protection process, as connectivity, for instance, because it may influence the performance of the algorithms.
PSDP(x) PSDP(y) PSDP(x,y) PSDP(x,z) Suurballe(x) Suurballe(y)
Acknowledgements The authors acknowledge the financial support from UPE, UFPE, CNPq, CAPES and FACEPE for scholarships and grant.
1E-3 150
155
160
165
170
175
Network load (erlang)
References Fig. 23 Comparison of the blocking probability as a function of the network load of the average value of 30 different runs and its margin of error at 95% confidence interval of all investigated algorithms on the topology 3.
Some network characteristics that affect the performance of the P SDP (x, z) are average node degree and distribution of links in the network topology. These characteristics influence to obtain the routes with wavelength available / continuity end to end. Other important network characteristics is the number of wavelengths. Reducing the number of wavelengths in the network, the information of the parameter z do not provide much benefit in relation to the parameter y.
6 Conclusion In this paper we propose and analyze a dedicated protection algorithm for WDM optical networks, called
1. A. A. M. Saleh and J. M. Simmons, Technology and architecture to enable the explosive growth of the internet, IEEE Communications Magazine, v. 49, n. 1, pp. 126-132, January 2011. 2. G. Zhang, M. De Leenheer, A. Morea and B. Mukherjee, A Survey on OFDM-Based Elastic Core Optical Networking, IEEE Communications Surveys & Tutorials, v. 15, n. 1, pp. 65-87, F. Quarter 2013. 3. B. Mukherjee, Optical Communication Networks: Progress and Challenges, Journal of Selected Areas in Communications, v. 18, pp. 1810-1824, n. 10, 2000. 4. A. Rahbar, Review of dynamic impairment-aware routing and wavelength assignment techniques in all-optical wavelength-routed networks, Communications Surveys & Tutorials, IEEE, v. 14, n. 4, pp. 1065-1089, November 2012. 5. H. Zang, J. P. Jue and B. Mukherjee, A review of routing and wavelength assignment approaches for wavelengthrouted optical WDM networks, Optical Networks Magazine. v. 1, pp. 47-60, n. 1, 2000. 6. S. Ramamurthy and B. Mukherjee, Survivable WDM mesh networks. Part I-Protection, INFOCOM ’99. Eighteenth Annual Joint Conference of the IEEE Computer and Communications Societies. Proceedings. IEEE, v. 2, pp. 744-751, March 1999. 7. S. Ramamurthy and B. Mukherjee, Survivable WDM mesh networks. II. Restoration, Communications, 1999. ICC ’99.
14 1999 IEEE International Conference on, v. 3, pp. 2023-2030, 1999. 8. E. Horowitz, S. Sahni and S. Rajasekaran, Computer Algorithms. Computer Science Press, 1998. 9. W. D. Grover, Mesh-based Survivable Networks: Options and Strategies for Optical, MPLS, SONET/SDH, and ATM networking. Prentice Hall PTR, 2004. 10. J. W. Suurballe and R. E. Tarjan, A quick method for finding shortest pairs of disjoint paths. Networks, v. 14, pp. 325-336, 1984. 11. R. Bhandari, Survivable Networks: Algorithms for Diverse Routing. Kluwer Academic Publishers, 1999. 12. D. A. R. Chaves, D. O. Aguiar, C. J. A. Bastos-Filho and J. F. Martins-Filho, Fast and adaptive impairment aware routing and wavelength assignment algorithm optimized by offline simulations, Optical Switching and Networking, v. 7, pp. 127-138, n. 3, 2010. 13. D. A. R. Chaves, D. O. Aguiar, C. J. A. Bastos-Filho and J. F. Martins-Filho, A Methodology to Design the Link Cost Functions for Impairment Aware Routing Algorithms in Optical Networks, Photonic Network Communications, v. 22, pp. 133-150, october 2011. 14. C. J. A. Bastos-Filho, R. C. Freitas, D. A. R. Chaves, R. C. L. Silva, M. L. P. Freire, H. A. Pereira, and J. F. Martins-Filho, An adaptive path restoration algorithm based on power series routing for all-optical networks, 2013 15th International Conference on Transparent Optical Networks (ICTON), pp. 1-4, June 2013. 15. J. Kennedy and R. Eberhart, Particle swarm optimization, Proceedings of the 1995 IEEE Internacional Conference on Neural Networks, v. IV, pp. 1942-1948, 1995. 16. M. Clerc and J. Kennedy, The particle swarm - explosion, stability, and convergence in a multidimensional complex space, IEEE Transactions on Evolutionary Computation, v. 6, pp. 5873, n. 1, 2002. 17. Y. Zhai, Y. Pointurier, S. Subramaniam, and M. BrandtPearce, Performance of Dedicated Path Protection in Transmission-Impaired DWDM Networks, ICC ’07. IEEE International Conference on Communications, 2007, pp. 2342-2347, June 2007. 18. M. Liu, M. Tornatore and B. Mukherjee, New Strategies for Connection Protection in Mixed-Line-Rate Optical WDM Networks, Journal of Optical Communications and Networking. IEEE/OSA, 2011, pp. 641-650, September 2011. 19. P. Monti, A. Muhammad, I. Cerutti, C. Cavdar, L. Wosindka, P. Castoldi and A. Tzanakaki, Energy-effiecient lightpath provisioning in a static WDM network with dedicated path protection, 2011 13th International Conference on Transparent OPtical Networks (ICTON), 2011, pp. 1-5, June 2011. 20. P. Soproni, P. Babarczi, J. Tapolcai, T. Cinkler and P. Ho, A meta-Heuristic Approach for Non-Bifurcated Dedicated Protection in WDM Optical Networks, 2011 8th International Workshop on the Design of Reliable Communication Networks (DRCN), pp. 110-117, 2011. 21. P. Soproni, P. Babarczi, J. Tapolcai, T. Cinkler and P. Ho, A meta-Heuristic Approach for Non-Bifurcated Dedicated Protection in WDM Optical Networks, 2011 8th International Workshop on the Design of Reliable Communication Networks (DRCN), pp. 110-117, 2011. 22. P. Soproni, P. Babarczi, J. Tapolcai, T. Cinkler and P. Ho, A meta-Heuristic Approach for Non-Bifurcated Dedicated Protection in WDM Optical Networks, 2011 8th International Workshop on the Design of Reliable Communication Networks (DRCN), pp. 110-117, 2011.
Andr´ e V. S. Xavier et al. 23. A. Beshir, F. Kuipers, A. Orda and P. Mieghem, Survivable Routing and Regenerator Placement in Optical Networks, 2012 4th International Workshop on Reliable Networks Design and Modeling, co-located with ICUMT 2012 Conference), pp. 684-690, 2012. 24. A. P. Engelbrecht, Fundamentals of Computational Swarm Intelligence. John Wiley and sons, England, 2005. 25. Canhul and B. Mukherjee, Survivable Optical WDM Networks. Springer Science & Business Media, 2010. 26. D. A. R. Chaves, H. A. Pereira, C. J. A. Bastos-Filho and J. F. Martins-Filho, SIMTON: A Simulator for Transparent Optical Networks, Journal of Communication and Information Systems, v. 25, pp.1-10, n. 1, 2010. 27. H. A. Pereira, D. A. R. Chaves, C. J. A. Bastos-Filho and J. F. Martins-Filho, OSNR model to consider physical layer impairments in transparent optical networks, Photonic Network Communication, v. 18, pp. 137-149, 2009. 28. A. V. S. Xavier, R. C. L. Silva, D. A. R. Chaves, C. J. A. Bastos-Filho and J.F. Martins-Filho, An adaptivealternative routing algorithm for all-optical networks, 2011 SBMO/IEEE MTT-S International Microwave Optoelectronics Conference (IMOC), pp. 719-723, October, 2011.