Intensity-based modified Doppler variance algorithm dedicated for phase instable optical coherence tomography systems Gangjun Liu1,2, Wangcun Jia1, Danny Chou, Wenjuan Qi1, Bernard Choi1,2, Zhonping Chen1,2,* 1
Beckman Laser Institute, University of California, Irvine, Irvine, California 92612, USA
2
Department of Biomedical Engineering, University of California, Irvine, Irvine, California 92697, USA *
[email protected], Tel: 949-824-1247 Fax:949-824-8413
Abstract: Traditional phase-resolve Doppler method demonstrates great success for in-vivo imaging of blood flow and blood vessel. However, the phase-resolved methods always require high phase stability of the system. During phase instable situations, the performance of the phaseresolved methods will be degraded. We propose a modified Doppler variance algorithm that is based on the intensity or amplitude value. Performances of the proposed algorithm are compared with traditional phase-resolved Doppler variance and color Doppler methods for two phase instability systems. The proposed algorithm demonstrates good performances without phase instability induced artifacts.
Optical coherence tomography (OCT) is a powerful interferometric technology to obtain tissue cross section images noninvasively with micrometer resolution, millimeter penetration depth and video-rate imaging speed [1]. Extension of the OCT technique to functionally image the blood flow is of great interest. Doppler optical coherence tomography (DOCT) or optical Doppler tomography (ODT) is one kind of functional extension of OCT which combines the Doppler principle with OCT and provides in-vivo imaging of blood vessels, blood flow direction, and flow speed [2-5]. Phase-resolved Doppler OCT has become dominated methods for blood vessels imaging because its high sensitivity. It is based on the phase information obtained from the complex OCT data. By analyzing the phase information, information such as the blood flow speed, blood flow direction et al. can be obtained [5]. OMAG is one kind of DOCT method that filters out the lower Doppler frequency component with numerical or hardware methods [6, 7]. OMAG is sensitive to the phase term although it may not use the phase term directly. Phase resolved method is sensitive to the phase term and the phase stability of the OCT system is important for obtaining the high quality images. Intensity based methods has also been proposed to image the blood vessels. Barton et al. proposed a method based on the speckle of conventional amplitude optical coherence tomography images [8]. Mariampillai et al. used the speckle variance in a small 3D volume to image the blood vessels [9, 10]. Yasuno et al. used the intensity based threshold method for retinal and choroidal blood vessel imaging [11]. Jonathan et al. used a 2-D correlation map based on the OCT intensity images for blood vessel extraction [12]. Doppler variance method is a method that uses the bandwidth of the Doppler frequency spectrum to image the blood vessels [13]. Doppler variance has benefits of being less sensitive to the pulsatile nature of the blood flow, of being less sensitive to the incident angle, and may be used to obtain the transverse flow velocity [14]. Doppler variance is not sensitive to the gradient phase changes and can be used
Optical Coherence Tomography and Coherence Domain Optical Methods in Biomedicine XVI, edited by Joseph A. Izatt, James G. Fujimoto, Valery V. Tuchin, Proc. of SPIE Vol. 8213, 821315 © 2012 SPIE · CCC code: 1605-7422/12/$18 · doi: 10.1117/12.907151 Proc. of SPIE Vol. 8213 821315-1 Downloaded From: http://proceedings.spiedigitallibrary.org/ on 04/26/2014 Terms of Use: http://spiedl.org/terms
without bulk-motion-correction [15]. In this letter, we modified the averaging Doppler variance algorithm to make it an intensity based method for blood vessel imaging. The algorithm to calculate Doppler variance is derived from the autocorrelation technology [13,15]:
A j , z A*j +1, z 1 ⎛ σ = 2 ⎜1 − T ⎜ Aj , z A*j , z ⎝ 2
⎞ ⎟. ⎟ ⎠
(1)
Where Aj , z is the complex data at jth A line and depth of z. The algorithm is usually used with averaging to improve the signal to noise ratio (SNR). The averaging the can be performed in both lateral and depth direction [13, 15].
⎡ ⎢ 1 ⎢ 2 σ = 2 1− T ⎢ ⎢ ⎢⎣
⎤ A*j +1, z ) ⎥ j =1 ⎥ J ⎥ * (Aj ,z Aj , z ) ⎥ ∑ j =1 ⎥⎦ J
∑ (A
⎡ ⎢ 1 ⎢ 2 σ = 2 1− T ⎢ ⎢ ⎢⎣
j,z
⎤ A*j +1, z ) ⎥ j =1 z =1 ⎥ J N ⎥ ( Aj , z A*j , z ) ⎥ ∑∑ j =1 z =1 ⎥⎦ J
(2)
N
∑∑ ( A
j,z
(3)
It can be found that Eq.(1) is only related to the intensity of the complex data . When the averaging algorithms as in Eq.(2) and Eq.(3) are used, the phase terms are also involved and the value is affected by the adjacent A line phase difference variance in the averaging area. The effect of the phase difference variance can be neglected when the phase difference changes gradually [15].
However, if phase
difference does not change gradually, the phase terms will affect the value of variance. The Doppler variance obtained with the Eqs.(2) or (3) shows good results when the phase stability of the system is good. However, in phase instability situation where there is phase jumping between adjacent A line, the variance value will be affected greatly by the phase terms. Here, we propose modified averaging Doppler variance algorithms to eliminate the effect of the phase terms. Instead of using Eqs. (2) and (3) for the averaging, we used the modified averaging algorithm as follows: J ⎡ ⎤ A j , z A*j +1, z ) ⎥ ( ∑ ⎢ 1 ⎥ σ 2 = 2 ⎢1 − j =1J T ⎢ * ( Aj , z Aj , z ) ⎥⎥ ∑ ⎢ j =1 ⎣ ⎦
(4)
Proc. of SPIE Vol. 8213 821315-2 Downloaded From: http://proceedings.spiedigitallibrary.org/ on 04/26/2014 Terms of Use: http://spiedl.org/terms
J N ⎡ ⎤ A j , z A*j +1, z ) ⎥ ( ∑∑ ⎢ 1 ⎥ σ 2 = 2 ⎢1 − j =1J z =1N T ⎢ * ( Aj , z Aj , z ) ⎥⎥ ∑∑ ⎢ j =1 z =1 ⎣ ⎦
(5)
With the modified algorithm, all the phase terms will be cancelled out and the value is only related to the intensity or amplitude terms. The variance value obtained with Eqs. (4) and (5) is usually smaller than that obtained with Eqs. (2) and (3) because the phase variance is also took into consideration when Eqs.(2) and (3) are used. In the following, we use J=4 and N=4 to calculate the variance value and when Eq.(5) is used, the final variance value is multiplied by 3. Spectrometer based Fourier domain OCT systems usually show very good phase stability because no moving parts included in the system. Most demonstrated phase-sensitive techniques are based on this kind of OCT systems. However, there are situations that the system phase stability degrades due to effects such as vibration, galvo morror scanner jittering et al. Here, we demonstrated a special case where the system phase stability degrades due to galvo scanner jittering. Details of the system used in this study can be found in references 15. Briefly, the spectrometer-based Fourier domain OCT uses a super luminescent diode (SLD) light source which has a central wavelength of 890 nm and FWHM bandwidth of 150 nm . The CCD integration time was set at 50 μ s . The system sensitivity was measured to be about 100 dB at around zero imaging depth. The 6-dB sensitivity roll-off distance was found to be at an imaging depth of 1.6 mm . The imaging process includes background signal subtraction, linear interpolation to convert data from the linear wavelength space to the linear wavenumber space, and numerical dispersion. The axial resolution was measured to be 3.5 μ m . Two axial galvonanometer mirror based scanner was used to scan the beam. In this case, the galvonanometer mirror based scanner decrease phase instability of the system and introduces phase jumping between adjacent A-lines. Fig.1 shows the images of the skin of a hamster. Figs. 1 (a), (b), (c) and (d) show the OCT structure image, color Doppler image, Doppler variance image obtained with Eq.(3) and Doppler variance image obtained with modified algorithm Eq.(5). From the color Doppler images, the phase difference jumping can be seen at several locations as indicated by the red arrows. The phase instability affects the Doppler variance images more seriously and the vertical lines in the images degrade the quality of the final results. With the modified algorithm as Eq.(5), the results show great improvement as shown in Fig.1(d). It should be noted that images shown in Fig.1(d) was obtained by multiplying 3 of the value got by Eq.(5). This demonstrates that images obtained with Eq.(2) and (3) will show better results when
phase
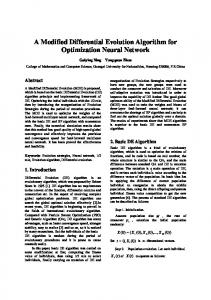
stability of the system is good enough. Figure 2 shows the while light camera photograph of the window chamber and the en-face projection image obtained with proposed method. The black box in Fig.2 (a) shows the imaging region of OCT and it covers an area of 5mm ൈ 5mm. The 3D volume obtained by OCT includes 120 frames of OCT B-scan images with 2048 A-lines per frame.
Proc. of SPIE Vol. 8213 821315-3 Downloaded From: http://proceedings.spiedigitallibrary.org/ on 04/26/2014 Terms of Use: http://spiedl.org/terms
Fig. 1 (a) OCT structure image; (b)(a) color Doppler image; (c) Doppler variance image obtained with Eq.(3); (d) Doppler variance image obtained with modified algorithm Eq.(5).
Fig.2 (a) While light camera photograph of the window chamber. The black box (5mm ൈ 5mm) shows the imaging region of optical coherence tomography. (b) En-face projection image obtained with the intensity-based modified Doppler variance algorithm.
Proc. of SPIE Vol. 8213 821315-4 Downloaded From: http://proceedings.spiedigitallibrary.org/ on 04/26/2014 Terms of Use: http://spiedl.org/terms
Swept source based Fourier domain OCT systems usually use tunable filters that based on mechanically scanning of galvo mirror, polygon mirror or Fabry–Pérot (FP) filter. Due to the mechanical scanning schemes used, swept source OCT systems usually show worse phase stability than spectrometer based OCT systems. If phase sensitive methods are used, the phase must be corrected before using [16, 17]. Fig.3 shows the in-vivo images of human skin obtained with a swept source OCT systems. Figs. 3(a), (b), (c) and (d) are, respectively, OCT structure image, color Doppler image, Doppler variance image obtained with Eq.(3) and Doppler variance image obtained with modified algorithm Eq.(5).
The system used a MEMS technique based swept source laser with central wavelength of
1310nm , a A-line speed of 50KHz and total average power of 16mW (SSOCT-1310, Axsun Technologies Inc, Billerica, MA). The system used a Mach-Zehnder type interferometer with 90% light in the sample arm and 10% light in the reference arm. A dual-balanced detection scheme is used to acquire the signal. The system works in the K-trigger mode so that no re-calibration is needed. The color Doppler image as shown in Fig. 2(b) show background may be due to the sample movement during imaging. In addition, we can find that there are abrupt phase difference changes in the image as indicated by the red arrows. This may be caused by the time jitter between adjacent A line trigger signals and introduce phase jumping. This time jitter degrades the phase stability of the system. The phase instability degrades the performance of images obtained with the phase-resolved method such as phase resolved color Doppler and phase resolved Doppler variance with Eq. (2) and (3). This can be seen from Figs. 3 (b) and (c). The color Doppler image shows artifacts of vertical lines as indicated by the arrows. This shows that the phase difference changes abruptly in the adjacent A lines. More evident vertical lines exist in the Doppler variance image obtained with the phased resolved algorithm. These vertical lines do not show up in the OCT structure image as in Fig.3 (a) and it demonstrates that the vertical lines are due to the phase terms. With the modified the algorithm, the result as in Fig.3 (d) shows much clear image without any artifact.
Proc. of SPIE Vol. 8213 821315-5 Downloaded From: http://proceedings.spiedigitallibrary.org/ on 04/26/2014 Terms of Use: http://spiedl.org/terms
Fig.3 (a) OCT structure image; (b) color Doppler image; (c) Doppler variance image obtained with Eq.(3); (d) Doppler variance image obtained with modified algorithm Eq.(5).
In conclusion, we proposed a modified algorithm to calculate the Doppler variance when system has worse phase stability. The modified algorithm is based on the intensity or amplitude value and not related to the phase terms. Performances of the proposed algorithm are compared with traditional Doppler variance and color Doppler methods for two phase instable systems. The proposed algorithm demonstrates good performances without phase instability induced artifacts. This work was supported by the National Institutes of Health (EB-00293, EB-10090, and RR-01192, HL-103764, HL105215), Air Force Office of Scientific Research (FA9550-04-0101), and the Beckman Laser Institute Endowment. References 1.
D. Huang, E. A. Swanson, C. P. Lin, J. S. Schuman, W. G. Stinson, W. Chang, M. R. Hee, T. Flotte, K. Gregory, C. A. Puliafito, and J. G. Fujimoto, Science 254, 1178–1181 (1991).
2.
Z. Chen, T. E. Milner, D. Dave, and J. S. Nelson, Opt. Lett. 22, 64–66 (1997).
3.
Z. Chen, T. E. Milner, S. Srinivas, X. J. Wang, A. Malekafzali, M. J. C. van Gemert, and J. S. Nelson, Opt. Lett. 22, 1119–1121 (1997).
4.
J. A. Izatt, M. D. Kulkarni, S. Yazdanfar, J. K. Barton, and A. J. Welch, Opt. Lett. 22, 1439-1441 (1997) .
5. 6.
Y. Zhao, Z. Chen, C. Saxer, S. Xiang, J. de Boer, and J. Nelson, Opt. Lett. 25, 1358–1360 (2000). R. K. Wang, S. L. Jacques, Z. Ma, S.Hurst, S. R. Hanson, and A.Gruber, Opt. Express 15, 40834097 (2007).
7.
Y. K. Tao, K. M. Kennedy, and J. A. Izatt, Opt. Express 17, 4177-4188 (2009).
8.
J. Barton and S. Stromski, Opt. Express 13, 5234-5239 (2005).
9.
A. Mariampillai, B.A. Standish, E. H. Moriyama, M. Khurana, N.R. Munce, M. K. K. Leung, J. Jiang, A.Cable, B. C. Wilson, I. A. Vitkin, and V. X. D. Yang, Opt. Lett. 33, 1530-1532 (2008).
10. A.Mariampillai, M. K. K. Leung, M. Jarvi, B. A. Standish, K. Lee, B. C. Wilson, A. Vitkin, and V. X. D. Yang, . Opt. Lett. 35, 1257-1259 (2010). 11. Y. Yasuno, Y. J. Hong, S. Makita, M. Yamanari, M. Akiba, M. Miura,and T. Yatagai, Opt. Express 15, 6121–6139 (2007). 12. E. Jonathan, J. Enfield, and M. J. Leahy, Journal of Biophotonics, doi: 10.1002/jbio.201000103 13. Y. Zhao, Z. Chen, C. Saxer, S. Xiang, J. de Boer, and J. Nelson, Opt. Lett. 25, 114–116 (2000). 14. H. Ren, K. M. Brecke, Z. Ding, Y.Zhao, J. St. Nelson, and Z. Chen, Opt. Lett. 27, 409-411 (2002). 15. G. Liu, W. Qi, L. Yu, and Z. Chen, Opt. Express 19, 3657-3666 (2011). 16. J. Zhang and Z. Chen, Opt. Express 13, 7449-7457 (2005). 17. B. Vakoc, S. Yun, J. de Boer, G. Tearney, and B. Bouma, Opt. Express 13, 5483-5493 (2005).
Proc. of SPIE Vol. 8213 821315-6 Downloaded From: http://proceedings.spiedigitallibrary.org/ on 04/26/2014 Terms of Use: http://spiedl.org/terms