Aug 9, 2004 - able power sources such as solar panels and wind generators, be- ... tonomous aircraft make extensive use of solar power, while sensor.
Power Utility Maximization for Multiple-Supply Systems by a Load-Matching Switch Chulsung Park and Pai H. Chou Center for Embedded Computer Systems University of California, Irvine, CA 92697-2625 USA {chulsung,phchou}@uci.edu Sunlight Intensity measured Feb. 6 2004
ABSTRACT
Categories and Subject Descriptors C.3.8 [Computer Systems Organization]: Special-Purpose and application-based systems—Real-time and embedded systems
General Terms
120000
Sunlight Intensity(Lux)
For embedded systems that rely on multiple power sources (MPS), power management must distribute the power by matching the supply and demand in conjunction with the traditional power management tasks. Proper load matching is especially critical for renewable power sources such as solar panels and wind generators, because it directly affects the utility of the available power. This paper proposes a power distribution switch and a source-consumption matching algorithm that maximizes the total utility of the available power from these ambient power sources. Our method yields over 30% more usable power than conventional MPS designs.
Threshold
80000
40000
B
A
C
0 8
9
10
11
12
13
14
15
16
17
Time(Hour)
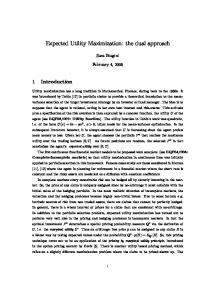
Figure 1: A typical solar power profile. Conventional systems can use only the energy in zone A, and zones B and C are wasted.
Design, experimentation
Keywords Solar energy, photovoltaics, power model, solar-aware, power management, load matching
1.
INTRODUCTION
A growing number of embedded systems has come to be known as multiple power source (MPS) embedded systems. As the name suggests, they rely on multiple power sources to replenish their energy over time for extended operations. Examples of these systems include satellite systems and sensor nodes. Satellites and some autonomous aircraft make extensive use of solar power, while sensor nodes may draw from other ambient energy sources such as wind and vibration. Because they must harvest energy from sources that are unstable and have a wide dynamic range, power management in MPS systems must consider power distribution and consumption together.
Permission to make digital or hard copies of all or part of this work for personal or classroom use is granted without fee provided that copies are not made or distributed for profit or commercial advantage and that copies bear this notice and the full citation on the first page. To copy otherwise, to republish, to post on servers or to redistribute to lists, requires prior specific permission and/or a fee. ISLPED’04, August 9–11, 2004, Newport Beach, California, USA. Copyright 2004 ACM 1-58113-929-2/04/0008 ...$5.00.
Today’s MPS systems manage their power as follows. When the ambient source cannot supply power, the rechargeable battery must provide the power. The battery is recharged when the ambient sources can supply sufficient power. An important assumption is that the battery cannot be recharged and supply power at the same time. Instead, the supply power must be divided so that the entire system is powered on by the ambient source, while the remaining power goes to recharging the battery. A problem with the conventional scheme is that much of the ambient power is wasted. This is because if the ambient power is not high enough to both drive the system and recharge the battery at the same time, then the battery must drive the system. Any power from the ambient source must be discarded in this case. As a result, these MPS systems must either use larger solar panels than necessary, or they operate for much shorter than optimal. To illustrate this issue, consider a sensor node that must take 200 samples of vibration data and transmit them over a wireless link 24 hours a day. Its power sources consist of a solar panel and a rechargeable battery. The only time solar power can be utilized is zone A in Fig. 1, because that is when it can power up both the system and the rechargeable battery at the same time. During the other times, such as zones B and C, even though the output power is sufficiently high to drive either the entire system or at least some subsystems, the solar power must be discarded. The goal of this paper is to maximize the utility of such power that otherwise would be wasted. This is accomplished with a new load-matching power switch that distributes the available power to the power consumers as much as possible. This has the potential of
power generation solar paddle
power supply voltage Power control Power distribution unit unit charge discharge user equipment, etc Battery
Figure 2: Power system of a satellite. reclaiming 25%–50% of the power that would be wasted by conventional designs. By making more efficient use of the available power, the system can be designed to be more compact, operate for longer, and even slow down the aging process of batteries due to frequent recharge cycles.
2.
This section surveys the power systems of existing MPS systems and the characteristics of the power sources.
2.1
Power systems of MPS
Many existing electronic systems already use multiple power sources. The most well-known MPS system is a satellite. As shown in Fig. 2, the satellite power system consists of the solar paddle, rechargeable batteries, the power control unit, and the power distribution unit [1, 2, 3, 4]. The power control unit regulates the output voltage of solar arrays using a DC/DC converter and controls charging and discharging of the battery. The power distribution unit is for distributing proper power to each subsystem. The Mars exploration rover [5] is another example of a MPS system. Its main power source is a multi-panel solar array, which can generates about 140 watts of power for up to four hours per sol (a Martian day). Its power system also includes two rechargeable batteries to supply power at night. One emerging MPS system is a wireless sensor node (WSN). Due to its limited size, a WSN cannot carry a battery of sufficient capacity for the entire mission. Therefore, researchers proposed energy renewing mechanisms from its environment of operation. In all conventional designs listed so far, the battery cannot be recharged and discharged at the same time. As a result, the solar power can be utilized only if it is at least powerful enough to drive the system. Any excess power not utilized by the system is used to recharge the battery. When the available solar power drops below the minimum needed to drive the system, then the system switches to the battery as the power supply. We believe this scheme wastes significant amounts of solar energy, and this paper presents power distribution hardware and policies to utilize such power that would be wasted otherwise.
2.2
(Figure from Hansen [8])
RELATED WORK
Characteristics of power sources
MPS systems use a variety of power sources with different characteristics. They often consist of one or more batteries plus renewable sources. A battery is the most widely used power source in embedded systems, MPS or otherwise. Here, we consider mainly rechargeable ones for the ability to continue operation when other sources are not available. The chemistry of the battery determines its characteristics [6]. For instance, a NiCd battery has a high discharge rate (20C) and long cycle life (1500 charge/discharge cycles), but its energy density (45–80 Wh/Kg) and cell voltage (1.25V) are low. On the other hand, a Li-Ion or Li-Polymer battery has high energy density (110–160 Wh/Kg) and high cell voltage (3.6V), but
Figure 3: I/V(solid line) and P/V(dotted line) characteristics of a typical GaAs solar cell. The maximum power point is marked by diamond.
comparatively low discharge rate (1C or lower) and short cycle life (300–500). A problem with these rechargeable batteries is that they suffer from degradation with use, due to memory effect and aging effect. Generally, fewer cycles and less charge taken out in each cycle lead to a longer battery life. A battery also has a relaxation effect, where a “rest” is beneficial for the battery. Discharging a battery at high discharge rates continuously results in reduced lifetime, because the energy still in the battery becomes inaccessible. A solar panel has totally different characteristics from batteries [7]. It is a renewable power source. However, since the sunlight intensity is not always constant, its power output has a wide dynamic range. Even though the sunlight intensity is almost constant within a short time interval, because a solar cell behaves like a current source with a voltage limiter, it is very important to operate the load at the maximum-power point. Fig. 3 shows the maximum point at a given sunlight intensity [8]. The conversion efficiency depends on the material of solar cell, but it is at most 25% and is relatively low. A wind generator is another potential power source for MPS systems [9, 10]. Currently, most wind generators are vertical types and are designed to generate high power. These large wind generators may not be applicable to small MPS systems, but recently smaller, high efficiency ones can be a good power source. Depending on the location, it may be difficult to predict how much power will be generated. Therefore, it may be more appropriate to use a wind generator as an instant power source for bulk data transmission. Other potential power sources such as vibration, temperature difference, and acoustic noise are under research [11, 12, 13]. However, because the power level they can generate is extremely low, they are currently used only in exceptional or experimental systems.
3.
PROBLEM STATEMENT
The goal is to maximally utilize the ambient power that would otherwise be wasted, as illustrated in zones B and C in Fig. 1 earlier. To achieve this, we need (1) the mechanisms for tracking the available power level and “routing” power from multiple source to multiple subsystems, and (2) power management policies to go with
Ambient Power
Ψ
Ambient power-toElectricity Converter
under the conditions of a) power demand should not exceed the available power:
Available Power
PU
Regulator
PA
er
ec
pA1 pA2 pA3
≥ ≥ ≥
pD1 pD2 pD3
pAm
≥
pDm
= = = ... =
c11 pC1 + c12 pC2 + . . . + c1n pCn c21 pC1 + c22 pC2 + . . . + c2n pCn c31 pC1 + c32 pC2 + . . . + c3n pCn
(5)
cm1 pC1 + cm2 pC2 + . . . + cmn pCn
b) one subsystem can be connected to only one power source:
Power Source
m−1
∑ ci j = 1
these mechanisms. This section present the power source model, problem formulation, and an algorithm for policy generation. Fig. 4 shows the power source consisting of an ambient powerto-electricity converter and a voltage regulator. A converter such as a solar panel and wind generator generates unregulated power PU with the conversion efficiency ec from the ambient power, whose intensity is Ψ. PU = ec · Ψ
(1)
To step up or down the output voltage of this converter, we use a voltage regulator whose regulation efficiency is er , and thus the available power PA on the power source is PA = er · PU = er ec · Ψ
(2)
The problem statement is given as follows. Given the following: (a) An MPS system consisting of m − 1 ambient power sources and one rechargeable battery G = {gi |1 ≤ i ≤ m}, where g1 . . . gm−1 are ambient power sources and gm is the rechargeable battery, and n − 1 subsystems and one battery charger S = {s j |1 ≤ j ≤ n}, and sn is the battery charger
∑ ∑ ci j = n − 1
We define the following: (d) The connection matrix C, which indicates the connection between gi and s j , and whose elements are ci j , where ci j ∈ {0, 1}, for 1 ≤ i ≤ m − 1, 1 ≤ j ≤ n. (e) The power demand pDi on each power source gi . PD = {pDi |1 ≤ i ≤ m} n
(3)
j=1
The problem is to find a connection matrix C to maximize m−1
∑
i=1
m−1 n
pDi =
∑ ∑ ci j pC
i=1 j=1
j
⇒
j=1 i=1
∑ cin = 1
(7)
i=1
This is a bin-packing problem and is NP-complete in the general case. However, for many systems, we cannot arbitrarily turn on or turn off individual subsystems due to system-level dependencies. Instead, the number of system-level power configurations to consider is rather small. The available power value pAi from each source is mapped to a digit q(pAi ), and the digits are concatenated to form a number x that is used to index into a table of configurations Γ. Each entry γ ∈ Γ specifies a connection matrix that maximizes the expression in Eqn. (4), and the satisfaction of Eqns. (5), (6), (7) are checked at compile time. At runtime, managing the load-matching switch can be made very simple. F IND C ONFIG(PA , Γ) � looks up a statically computed configuration at run time � based on power availability from different sources 1 x ← hq(pA1 ), . . . , q(pAm )i 2 return Γ[x]
4.1
j
m−1
n−1 m−1
POWER UTILITY MAXIMIZER (PUMA)
In this section, we propose the power utility maximizer switch, called PUMA, to maximize utilization of power sources. We also show how to apply PUMA to an actual MPS embedded system.
(c) The power consumption pC j by each subsystem s j . PC = {pC j |1 ≤ j ≤ n}
∑ ci j pC
(6)
c) the battery charging subsystem can be connected to the power source only after all other subsystems are already connected to power sources:
4.
(b) The available power pAi on each power source gi . PA = {pAi |1 ≤ i ≤ m}
pDi =
for j = 1, . . . , n − 1
i=1
Figure 4: Model of Power Source.
(4)
The PUMA Hardware
PUMA is to maximize the utility of power sources by matching load to available power. PUMA senses the available power on each power source and find a connection scheme between subsystems and power sources to maximize the utilization. Fig. 5 shows a PUMA consisting of sensors, switch array, and the controller. Sensors are to measure the intensity of ambient energy such as sunlight intensity, wind speed, and vibration. Those measured data are sent to the controller and used to calculate the available power on each source. The controller runs the algorithm or refers to look-up table to get the connection matrix C to maximize the utilization of power sources. Finally, it sends the connection matrix to the switch array, which establishes the connections between the power sources and the subsystems. Fig. 6 shows the switch unit of PUMA. Each switch unit has one power path controller (LTC4412) and as many PMOS switches (MIC94060) as power sources. The power path controller is for smoothing transitions between the battery and other power sources, and the PMOS switches physically establish the connections between the power sources and the subsystems according to the PUMA
Connection Matrix C
Power Source
Sensor
g1 1
g2
Silicon cell Solar Panel
s2
φ
2
Switch
g3
..
I2C Connection Matrix
s1
φ
φ
Power
Subsystem
Array
3
gm-1
s3
.. .
Control Logic
LiPolymer Battery
φ
m-1
sn
gm
Figure 5: The block diagram of the PUMA (power utility maximizer) switch.
..…
…
Mode
cm-1j
gm
sj 1 2 3
VIN G ND C TL
S E NS E G ATE S TAT
6 5 4
MIC4680
Battery Monitor DS2761
PUMA Switch Unit
T o Su b syst em
L T C 4412
Figure 6: Schematic of the PUMA switch unit.
Wireless Comm.
PUMA Switch Unit
Battery Charger
Switch Array
Subsystems
WLAN 802.11b
MAX1501
Connection Battery
Lux
Solar Panel
M0 M1
M, S, W S, W
M
M2
M, W
S
M3
W
M, S
M4
M, S
W
M5
S
M, W
M6
M
S, W M, S, W M, S, W, B
M: Microcontroller subsystem W: WLAN 802.11b subsystem
Implementation Example: DuraNode
121 435 477 773 813 942 979 1123
S: Sensor subsystem B: Battery Charging subsystem
Table 1: Lookup Table. source at a time between the battery and the solar panel. In other words, DuraNode had only two power mode: in M0 , all subsystems are powered by the battery; in M1 , all subsystems are powered by the solar panel. To apply PUMA, we modified the power system by adding a sunlight intensity sensor (TSL2550) and the switch array. The array has four switch units, as shown in Fig. 8. This modification enables DuraNode to have nine power modes, as shown in Table 1. DuraNode first computes the available power on the solar panel based on the sunlight intensity measured by the light sensor. Then, the lookup table maps the sunlight intensity to the best power mode, which enables the solar panel to power as many subsystems as possible.
5. 5.1
Figure 7: A photo of the DuraNode wireless sensor system.
Sensors ADXL202E SD1121
PUMA Switch Unit
M7
controller. The PUMA switch array consists of as many switch units as the subsystems.
We applied PUMA to an actual MPS embedded system called DuraNode, a wireless sensor node for real-time structural health monitoring. As shown in Fig. 7, DuraNode consists of three individual boards: wireless communication board, microcontroller and sensor board, and the power system board. Fig. 8 shows the block diagram of DuraNode. Its two power sources consist of a rechargeable battery and a solar panel, and its four subsystems are the microcontroller, sensor devices (ADXL and SD accelerometers), the wireless card (802.11b), and the battery charger. Its microcontroller (PIC18F6680) samples vibration from two accelerometers and sends them to the host computer via the 802.11b wireless LAN interface. Before applying PUMA, the power system of DuraNode had only one switch unit, and thus it was able to select one power
PIC18F6680
PUMA Switch Unit
M8
4.2
Microcontoller
Figure 8: Application of PUMA to the power system of DuraNode.
C on n ect ion M a t r ix C c1 j c2 j c3 j …
g1 g2 g3
M I C 94060
Buck Regulator
Power Sources
Available Power Vector= (φ1, φ2, φ3,…, φm-1)
F r om P ower Sou r ces
Sunlight Sensor TSL255D
EXPERIMENTAL RESULTS Experimental Setup
Fig. 9 shows our experimental setup. The DuraNode is programmed to sample vibration along the X, Y, and Z axes, to sample sunlight intensity, and to send the data to the host computer over UDP. The transmission speed is set to the full 11Mbps speed of 802.11b, and the data size for each transmission is 60 bytes. The solar panel has a fixed orientation facing south at 75◦ from the
Solar P anel H ost Computer
Consumed Energy by DuraNode
2.5
Dur aNode
Availabe Power on Solar Panel
Data
2
B atter y
Solar P anel
P ower System B oard
R egulator
A
M icr ocontoller
V
M4
M2
0.5
W ir eless Comm.
M5
M5
M4
M3
M3
M1
0
B attery C harger
8
9
10
11
12
13
Time(Hour)
14
15
16
17
Figure 11: Power mode of DuraNode tracking the sunlight intensity
Power 67.5mW 421mW 1125mW 450mW
Consumed Energy by DuraNode
2.5
Availabe Power on Solar Panel 2
Power (W)
Subsystem Microcontroller Sensor WLAN 802.11b Battery charging
Table 2: Power Consumption of each subsystem
D B2
1.5
1
ground. The sunlight intensity sensor of the DuraNode is placed at the center of the solar panel. To measure the power drawn from the solar panel, we connect an ampmeter in series and a voltmeter in parallel between the regulator of the solar panel and the DuraNode. Our measurement was conducted for 9 hours, from 8:00am to 5:00pm on January 6, 2004. We measured the power consumption of each subsystem shown in Table 2. We also measured the sunlight intensity level for each power mode to make a lookup table, shown in Table 1.
Results
Fig. 10 shows the profile of the available power on the solar panel and the power consumption profile by the DuraNode. The available power on the solar panel is calculated from the sunlight intensity data measured by the sensor. (1000Lux = 0.021Watts @33cm2 silicon cell solar panel). The power drawn by the DuraNode is calculated by multiplying the measured voltage and current values. The
J an 6 , 2 0 0 3 Power drawn by DuraNode
2.5
Availabe Power on Solar Panel 2
Power (W)
M7
M1
Figure 9: The experimental setup with DuraNode.
5.2
M6
M7
1
Sensor s
Switch A r r ay
B atter y M onitor
B atter y
Power (W)
M8 M6
1.5
1.5
1
C2
A
B
C
0.5
C1
B1
0
8
9
10
11
12
13
Time(Hour)
14
16
17
Figure 12: Energy zones of DuraNode gap between the solid and dotted graph represents the power loss due to the regulator (regulation efficiency er < 1.0) and, more significantly, the mismatch between the load and the optimal power output level of the solar panel. In Fig. 11, we observe that the power mode of DuraNode tracks changes in the sunlight intensity. At 9:47am, the sunlight intensity first exceeds the threshold for powering the entire system. So, DuraNode sets its power mode to M7. At 10:29am, DuraNode enters mode M8 in which the solar panel also charges the battery. In Fig. 12, we divide the graph into four zones. In zone A, the solar panel can solely power the entire system, and thus the area represents the energy drawn from the solar panel. In zones B and C, the solar power is not high enough to power the entire system, and DuraNode is powered by both the battery and the solar panel. The gray areas B1 and C1 represent the energy from the solar panel, whereas the white areas B2 and C2 represent the energy from the battery. In zone D, the area represents the portion of the solar energy allocated for charging the battery. Therefore, the total energy drawn from the solar panel is ES = EA + EB1 + EC1 + ED
0.5
15
(8)
and the energy from the battery is 0
8
9
10
11
12
13
Time(Hour)
14
15
16
17
Figure 10: Available power on solar panel and power drawn by DuraNode.
EB = EB2 + EC2
(9)
In contrast, the conventional MPS system must be powered by only the battery in zones B and C. Therefore, the energy from the solar panel reduces to ES0 = EA + ED and the energy from the battery will
7. 38.02KJ (68%) 40
EC1 EB1 ED
35 Energy (KJ)
30 25
28.08KJ(51%) ED
20 15
EA
EA
10 5 0
PUMA
Conventional
Figure 13: Comparison: Utilization of the solar energy
28.16KJ 30
Energy (KJ)
25
18.24KJ
EC2 EB2
EC1
EC1
EB1
EB1
20 15 10 5 0
PUMA
Conventional
Figure 14: Comparison: Energy drawn from the battery increase to EB0 = EB + EC . In our experiment, ES = 38.02KJ, EB = 18.24KJ, ES0 = 28.08KJ, and EB0 = 28.16KJ. Also, the total energy available on the solar panel is ET = 55.75KJ. Fig. 13 compares the utilization of the solar energy. The solar power utilization of PUMA is ES /ET = 68%, whereas the conventional system is ES0 /ET = 51%. In other words, PUMA extracts (ES − ES0 )/ES0 = 33% more energy from the same source. In terms of absolute energy, PUMA consumes 9.92KJ less than the conventional system, as shown in Fig. 14.
6.
CONCLUSIONS
This paper presents a novel technique for matching the power sources and power consumers. This is accomplished through a combination of the PUMA hardware switch and the power configuration policy. Our technique effectively increases the utilization of the ambient power that would otherwise be wasted. Because power is a precious resource in these MPS embedded systems, increasing the utility will be the most important step towards the optimization and extended operation of this important class of low-power embedded systems.
Acknowledgments This work was sponsored in part by the National Science Foundation under Grants CCR-0205712, EEC9701471, and CMS-0112665, by the Federal Highway Administration (FHWA) Contract DTFH61-98-C-00094 both through the Multi-disciplinary Center for Earthquake Engineering Research (MCEER), and by a Printronix Fellowship. The authors thank Prof. Masanobu Shinozuka for supporting the DuraNode project.
REFERENCES
[1] D. Loche, J.-M. Dubouch, and A. Lehmann. Power system for LEOSTARTM . In Proceedings of the Fifth European Space Power Conference, 1998. [2] Dermott O’Sullivan. Satellite power system topologies. ESA Journal, 13:77 – 88, 1989. [3] J.E. Haines. European LEO spacecraft power systems... what’s next? In Proceedings of the European Space Power Conference, 1993. [4] NASDA (National Space Development Agency of Japan). Report Research on Small, Lightweight Satellite Power System to Improve Mission Performance, (123), September 2003. [5] The rover’s energy. http://marsrovers.jpl.nasa. gov/mission/spacecraft_rover_energy.html. [6] David Linden and Tomas Reddy. Handbook of Batteries. McGraw-Hill, 2001. [7] Jeff Bailey, Scott A. McHugo, Henry Hieslmair, and Eicke R. Weber. Efficiency-limiting defects in silicon solar cell material. Journal of Electronic Materials, 25(9):1417 – 1421, September 1996. [8] Flemming Hansen. Electrical power system architecture for small scattersite. http://www.dsri.dk/dssp/EPS_ Smallsat_Architecture.pdf. [9] T¨onics Peets, Andres Annuk, Veli Palge, and Jaan Lepa. Modeling of characteristics of small scale wind unit. http://tehnika.eau.ee/pages/2002/Energy/ 33_Peets_Annuk_Palge_Lepa.pdf. [10] The energy development co-operative web page Aerogen wind generator technical specification. http://www. unlimited-power.co.uk/Aerogen_spec.html. [11] Scott Meninger, Jose Oscar Mur-Miranda, Rajeevan Amirtharajah, Anantha Chandrakasan, and Jeffrey Lang. Vibration-to-electric energy conversion. In Proceedings of the 1999 international symposium on Low power electronics and design, August 1999. [12] S. Roundy, B. Otis, Y.H. Chee, J. Rabaey, and P. Wright. A 1.9GHz RF transmit beacon using environmentally scavenged energy. In Dig. IEEE Int. Symposium on Low Power Elec. and Devices, 2003. [13] Aman Kansal and Mani B. Srivastava. An environmental energy harvesting framework for sensor networks. In International Symposium on Low Power Electronics and Design, 2003.