range, sample-data system, sigma-delta modulation, single-tone test, multitone test. I. INTRODUCTION. AS THE transistor feature size keeps scaling down, it be-.
IEEE TRANSACTIONS ON CIRCUITS AND SYSTEMS—II: ANALOG AND DIGITAL SIGNAL PROCESSING, VOL. 50, NO. 9, SEPTEMBER 2003
553
Practical Considerations in Applying - Modulation-Based Analog BIST to Sampled-Data Systems
61
Hao-Chiao Hong, Student Member, IEEE, Jiun-Lang Huang, Kwang-Ting (Tim) Cheng, Fellow, IEEE, Cheng-Wen Wu, Senior Member, IEEE, and Ding-Ming Kwai, Member, IEEE
61
Abstract—The analog built-in self-test (BIST) scheme, with stimulus generation and response extraction based on the modulation, is proven to be quite effective for sampled-data systems. We show that the - modulators can be selected optimally for certain applications and functional tests. The criteria for valid tests are also derived. In particular, a valid frequency response test is determined by the frequency response observation range FRORBIST of the BIST circuit. Given the transfer function of the circuit under test, the requirement becomes CUT FRORBIST CUT . Using the MOSIS 0.35- m CMOS process, we have implemented a test chip containing a Fleischer–Laker biquadratic low-pass filter as the circuit under test. An on-chip one-bit digital-to-analog converter provides the analog stimulus from a bit stream which is applied externally. For each test item, different bit streams, synthesized by first-, second-, and fourth-order modulators that are programmed by software, are compared for performance. First- and second-order - modulators are implemented on the test chip as the candidates for the analog response extractor. The measurement results by single-tone tests and multitone tests validate the feasibility of the BIST scheme.
61
()
61
() ()
1
()
61
Index Terms—Analog response extractor, analog stimulus generator, built-in self-test (BIST), frequency response observation range, sample-data system, sigma-delta modulation, single-tone test, multitone test.
I. INTRODUCTION
A
S THE transistor feature size keeps scaling down, it becomes beneficial to integrate analog and digital circuits into the same chip to improve the overall performance and reduce the manufacturing cost. However, testing the analog parts of the mixed-signal designs has been a costly process. Traditionally, this requires high-end and, thus, expensive automatic test equipment (ATE), and the test time is usually long. The total testing cost can be even higher than the die manufacturing cost [1]. In addition, integrating more analog circuits makes the diagnosis of the chip more difficult. Increasing the number of off-chip observation nodes may help, but it results in higher Manuscript received October 7, 2002; revised May 6, 2003. This paper was recommended by Associate Editor A. Baschirotto. H.-C. Hong and C.-W. Wu are with the Department of Electrical Engineering, National Tsing Hua University, Hsinchu 300, Taiwan, R.O.C. J.-L. Huang is with the Department of Electrical Engineering, National Taiwan University, Taipei 106, Taiwan, R.O.C. K.-T. Cheng is with the Department of Electrical and Computer Engineering, University of California, Santa Barbara, CA 93106 USA. D.-M. Kwai is with the Intellectual Property Library Company, Hsinchu 300, Taiwan, R.O.C. Digital Object Identifier 10.1109/TCSII.2003.814812
packaging cost and larger interference to the analog circuits. Consequently, there is a strong demand on a low-cost and efficient analog built-in self-test (BIST) scheme. Many analog BIST schemes have been published to eliminate the need for high-end ATE [2]–[11]. Most of them are based on the standard functional test flow [6], [8]–[11]. The idea is to embed stimulus generation and response evaluation on chip. Apparently, the success of such a scheme relies on the cost and performance of the implemented stimulus generator and response analyzer. The BIST circuitry, especially the analog portion, should have low area overhead, while showing robust performance against process variations and environmental noises. The stimulus generation and response extraction based on - modulation have been proven to be quite effective [6]–[12]. For stimulus generation, the - modulated bit streams are stored and periodically applied to a one-bit digital-to-analog converter (DAC) to generate the desired waveforms. This approach is promising in that it consists mostly of digital circuits except for the simple DAC. For response extraction, the one-bit - modulation analog-to-digital converter (ADC) has been shown to be area efficient and highly tolerant of circuit imperfections [11], [13]. In this paper, we examine the practical considerations to apply the - modulation-based BIST scheme to a coherent linear time-invariant sampled-data system. In the BIST scheme, the stimulus generation, circuit under test (CUT) operation, and response extraction are in synchrony. No aliasing distortion would appear since no sampling (continuous to discrete) or resampling (from one time base to another) is performed [14]. In other words, no additional reconstruction or anti-aliasing filtering is needed, as long as the CUT is not overloaded by the out-of-band signals. The - modulation-based BIST scheme is most suitable for such systems. A demonstration chip containing a second-order switchedcapacitor (SC) low-pass filter as the CUT is fabricated using MOSIS 0.35- m CMOS process. First- and second-order modulators are embedded as the candidates for response extraction. We evaluate the tradeoffs between the achievable test resolution and area overhead. Also, first-, second-, and fourth-order - modulators are implemented by software, together with the on-chip one-bit DAC as the analog stimulus generator (ASG). The suitable ASGs for different test items are discussed. The remainder of this paper is organized as follows. Section II describes the overall BIST architecture and discusses the prac-
1057-7130/03$17.00 © 2003 IEEE
554
IEEE TRANSACTIONS ON CIRCUITS AND SYSTEMS—II: ANALOG AND DIGITAL SIGNAL PROCESSING, VOL. 50, NO. 9, SEPTEMBER 2003
(a)
6-1 modulation-based analog BIST architecture.
Fig. 1.
tical considerations of the test flow. Section III details the implementation of the test chip. Section IV shows the experimental results. Finally, Section V concludes the paper. -
II.
MODULATION-BASED BUILT-IN FUNCTIONAL TEST
A. BIST Architecture Fig. 1 depicts the - modulation-based analog BIST architecture proposed in [11]. It consists of a bit-stream generator, a one-bit DAC, the CUT, a multiplexer (MUX), a - analog response extractor (ARE), and a response analyzer. For stimulus generation, the desired stimulus waveforms are digitized by a one-bit - modulator that can be realized entirely by , corresponding to an software. The modulator’s output integer number of the signal periods, can be prestored in the on-chip memory in advance [7], [9], [11]. During the testing process, the stored digitized waveforms are repetitively applied to the one-bit DAC and converted to two-level waveforms to stimulate the CUT. The MUX may be used to enhance the observability of the CUT. With the aid of the multiplexer, internal nodes can be analyzed by using only one ARE. For analog response analysis, the one-bit - modulator is used to convert into a one-bit stream that is then the CUT’s output sent to the response analyzer. The dashed lines in Fig. 1 indicate that both the input and output bit streams can be processed internally or externally. In either case, only a low-end digital ATE is required to perform the desired tests. Consequently, the cost of the mixed-signal test is low. B.
-
Modulator
Oversampling - modulation trades the time resolution for the amplitude resolution; i.e., it converts an analog signal into a high-speed (compared with the passband) but low-resolution (usually one-bit) digital signal, composed of the input signal and the shaped quantization noise. The noise-shaping capability of the - modulation loop pushes the quantization noise out of the passband while retaining the input signal in the passband. Since most of the quantization noises are out of the passband, they can be easily removed later by digital filters. Fig. 2 depicts
(b) Fig. 2. Block diagrams and analytical models of (a) the first- and (b) the second-order - modulators.
61
the block diagrams of the first- and second-order - modulators that are used in our design. Take the first-order - modulator in Fig. 2(a) as an example. If the quantization noise is independent of the input , then the A/D–D/A process can be considered as signal . Therefore, to introduce an additive white-noise source the I/O relationship of the first-order - modulator is (1) and . The term represents where passes through, a unit delay. According to (1), the input without any disafter a unit delay, directly to the output is multortion. On the other hand, the quantization noise that has a high-pass tiplied by a noise-shaping term is attenuated by 20 dB per tenth response. As a result, and the passband be toward dc. Let the sampling rate be . The oversampling ratio (OSR) is defined as . If , very little of the quantization noise will be left in OSR the passband. Compared with the first-order - modulator, higher order ones have better noise-shaping capability. For instance, the second-order - modulator in Fig. 2(b) has the following I/O relationship: (2) (3) (4) Since both modulators in Fig. 2 employ the same A/D–D/A structure, their quantization noise sources can be assumed to be attenuates the same. Note that the noise-shaping term by 40 dB per tenth toward dc, which is twice as much as that in the first-order - modulator. Therefore, for the same
HONG et al.: APPLYING
-
MODULATION-BASED ANALOG BIST TO SAMPLED-DATA SYSTEMS
Fig. 3. Block diagram of the fourth-order
555
6-1 modulator used for bit-stream synthesis.
, less quantization noise is left in its passband. In general, an th-order - modulator can be expressed as (5) is the signal transfer function (STF), is where is the output corthe noise transfer function (NTF), and rection function (OCF). The STF is usually designed to possess an all-pass and linear-phase response in the passband. The NTF, on the other hand, usually has a high-pass response to push the quantization noise out of the passband. Consider the - modulation-based analog BIST scheme be the stimulus waveform and shown in Fig. 1. Let be the output of the bit-stream synthesizer. We have
(6) , and are the STF, OCF, and where modulation order of the ASG, respectively. Similarly, the I/O relationship of the ARE is
(7) and are the STF, OCF, and where modulation order of the ARE. For the CUT with a transfer func, we have tion (8) From (6), (7), and (8), we obtain the I/O relationship of the CUT
(9) For a valid test, the BIST system should be designed such that and can the effects of the noise sources be ignored. Different test items require different designs of the to reduce the effect of the ASG, ARE, and the stimulus noise. C. Analog Stimulus Generation Similar to the test sequence generation for digital circuits, different stimulus waveforms are required to test the functional specification of the analog circuits. There are two test methods commonly used for mixed-signal systems: single-tone test
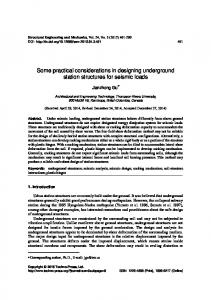
(STT) and multitone test (MTT). In what follows, we discuss the synthesis of the waveforms suitable for different test applications. 1) Synthesis of Single-Tone Test Stimulus: The STT is used to inspect the intrinsic linearity and noise performance of the CUT. A single-tone signal of high spectral purity is applied and the output spectrum is analyzed to derive the noise and distortion introduced by the CUT. The measurement results are usually expressed as the dynamic range (DR), signal-to-noise ratio (SNR), signal-to-distortion ratio (SDR), and signal-to-noise-and-distortion ratio (SNDR) [1]. Among the four indices, DR reveals the capability of the CUT to distinguish the smallest input signal from noise, SNR represents CUT’s noise performance with large input signals, SDR discloses the linearity distortion of the CUT, and SNDR is a compound of both linearity distortion and noise performance of the CUT. To measure the noise performance of the CUT, the noise power of the input stimulus must be less than the sum of the noise power of the CUT and ARE within the passband. There are two methods to increase the spectral purity of the input in the passband. Since OSR , where is the passband width, the first method is to increase the OSR of the ASG, which requires the reduction of the passband width. The other method is to use a higher order - modulation which requires a more complex computation. The latter approach is better in our application because the bit stream is computed in advance. We choose the fourth-order multiple-feedback - modulator [15] to synthesize the required periodic bit streams, because it is able to achieve the desired purity without a high OSR. Fig. 3 shows the block diagram of the bit-stream represents the digital input waveform synthesizer, where is the (a sequence of floating-point numbers) and generated bit stream. The fourth-order - modulator can be expressed as follows: (10) (11) (12) (13) Fig. 4 shows the output spectrum of the fourth-order software modulator providing a 2-kHz 20-dB input at 5-MHz samK here and pling rate. The number of samples is set to
556
IEEE TRANSACTIONS ON CIRCUITS AND SYSTEMS—II: ANALOG AND DIGITAL SIGNAL PROCESSING, VOL. 50, NO. 9, SEPTEMBER 2003
Fig. 4. Output spectrum of a 2-kHz order - modulator.
61
020-dBFS tone generated by the fourth-
the minimum-four-term window is used for spectrum analysis. This synthesizer is able to achieve better than 100-dB SNDR at . OSR 2) Synthesis of Multitone Test Stimulus for Intermodulation Distortion: Intermodulation distortion (IMD) reveals the CUT’s distortion under compound inputs. For example, by and , applying a two-tone waveform composed of tones the nonlinearity of the CUT introduces intermodulation at , where and are integers. The tones and should be selected without imposing any interference on themselves to ensure correct measurement results. This can be done by making the tones odd harmonics of the fundamental frequency. The major IMDs will then appear only at the even harmonics. The IMDs can be observed only if they are much larger than the respective noise powers on the same frequency. The observable frequency range can be widened by increasing the length of the bit stream, because the same noise power is distributed to more frequency bins. High-order - modulators are preferred for the synthesis of the stimulus. As an example, Fig. 5 shows the spectra of a six-tone signal modulated by the first-, second-, and fourthorder - stimulus bit-stream synthesizers, shown as the top, middle, and bottom curves, respectively. The first-order modulator has significant IMD because of the stronger dependency between its quantization noise and input signal [16], [17]. The fourth-order - modulator exhibits the best noise shaping capability and lowest noise floor in the passband, implying the widest observable range of signal tones. For IMD measurement, the range should be as large as possible. 3) Synthesis of the Multitone Test Stimulus for Frequency Response: Another important test item is the frequency response (FR). Although the FR test can be realized by applying multiple STTs, it requires longer test time, larger memory capacity, and greater effort to analyze the extracted outputs. Compared with STT, MTT is able to measure the FR of the CUT in a single run. Furthermore, it is feasible to allow simultaneous measurement of the IMD, which is impossible by STT. The synthesis of MTT stimulus for the FR tests is somewhat different from that for the IMD test. For the FR test, we are interested in the response of the stimulus tones only. The response can be observed as long as the
Fig. 5. Output spectra of a six-tone stimulus generated by the first-, second-, and fourth-order - modulators.
61
influence of the noise and distortion on the tones is negligible, regardless of whether or not they are located in the passband. Let the frequency response observation range (FROR) of the ASG be (14)
FROR and the FROR of the ARE be
(15)
FROR If FROR approximated by
and FROR
, then (9) can be
(16) dominates the reIn practice, the criterion FROR sponse of the input tone being synthesized. It should be much larger than the shaped noise to make the tone observable at the implies that input of the CUT. The criterion FROR the tone response at the output of the ARE should be larger than the shaped noise to make the tone response observable. In summary, measuring the out-of-band FR with the BIST scheme is and FROR possible, provided that both FROR are large enough. The value FROR strongly depends on how the MTT input waveform is synthesized. The following design considerations should be noted. 1) To avoid saturating the - modulation loop of the bitstream synthesizer, the amplitudes of the input tones are scaled down according to the number of input tones. 2) A longer bit stream alleviates the alias of the noise to the target bins in the output spectrum. In general, doubling by the length of the bit stream increases FROR 3 dB. modulation 3) The input tone locations and the configuration of the stimulus bit-stream synthesizer and should be chosen such that FROR . FROR
HONG et al.: APPLYING
-
MODULATION-BASED ANALOG BIST TO SAMPLED-DATA SYSTEMS
Fig. 6. Maximum values of FROR
parameters of different ASGs.
Fig. 6 plots the maximum FROR values of the first-, K. Note that second-, and fourth-order ASGs, given decreases with an increasing frequency. The FROR when the fourth-order ASG has the largest FROR frequency is lower than 100 kHz, while the first-order ASG has when the frequency is higher than the largest FROR 200 kHz. Thus, the first-order ASG becomes a better choice if the input tones spread over the Nyquist rate (2.5 MHz in this case). In general, the selection of the ASG configuration . depends on the tone locations and the desired FROR Theoretically, the input tones of the one-bit DAC are shaped by the term after being modulated. This effect should be compensated by filtering by to the extracted output obtain the correct FR results, as indicated by (16). Since usually has some peak responses, the selected tones should be examined such that they will not saturate the CUT. Fig. 7 depicts a closer look at the tone peaks of the spectra in Fig. 5 and the tone peaks predicted by . Note that the the corresponding second-order ASG has a peak gain of 6 dB around 400 kHz, and the fourth-order ASG has a peak gain up to 18 dB around 160 kHz. If such tones having peak gains are to be selected, the excess gain may overload the CUT. On the other hand, if the excess gain does not overload the CUT, then the required will benefit from these tones. This will be FROR discussed in Section IV-D. predicts well for the first Although five tones in Fig. 7, a small deviation still exists on the sixth is compensated by the corresponding one even after . The reason is that the shaped quantization noise is superimposed on the tone and its uncertainty leads to the deviation. To obtain more accurate results, the deviation is computed in advance and compensated later in the extracted output analysis stage. D. Analog Response Extraction To avoid using expensive analog ATE, a high-performance and low-cost ADC is required to extract the CUT’s outputs for
557
Fig. 7. Deviations of predicted signal amplitudes of the six tones.
subsequent analysis. Ideally, the ARE should have a high resolution, wide input bandwidth, and high yield (tolerance of process variations), while occupying only a small area. The single-bit - modulator meets most of the requirements, except for its limited input bandwidth [13], [15]. This may not be an issue in the analog BIST scheme, for the following reasons. 1) Both ASG and ARE adopt - modulation and the technique preserves the signals in the passband. Since the ASG is also band limited, the observation is generally made in the passband where the input stimulus is available. 2) Lots of information can still be obtained given the limited input bandwidth, e.g., most analog CUT’s have a uniformly distributed intrinsic noise floor. The measured intrinsic noise floor in the passband is the upper bound of the CUT’s real noise floor because it is the sum of the intrinsic noise floors of the ASG, CUT, and ARE. The one-bit - modulation ADC has been shown to be area efficient and highly tolerant to circuit imperfections [11], [13]. Therefore, we implement both the first- and the second-order one-bit - modulators as the ARE candidates on our test chip to analyze the tradeoff between the area overhead and test accuracy. Higher order configurations may be adopted, but the stability problem needs to be solved [15]. Again, we need for a valid test, so the CUT input can be FROR . The extracted approximated by , according to (9), becomes output
(17) By (17) and (15), we have FROR (18) We define the frequency response observation range of the BIST circuit as FROR
(19)
558
IEEE TRANSACTIONS ON CIRCUITS AND SYSTEMS—II: ANALOG AND DIGITAL SIGNAL PROCESSING, VOL. 50, NO. 9, SEPTEMBER 2003
Therefore, FROR
can be written as
FROR
(20)
according to (18) and (19). Note that the requirements of a valid test now relate to the configurations of the ASG and ARE, as well as the desired stimulus tones. Given a large enough , the largest FROR is from the tone having FROR . the smallest E. Analysis of Extracted Output The general-purpose - modulation ADC requires a decimation filter to remove the out-of-band noise to facilitate postprocessing of the ADC output. However, the extracted output of the BIST circuit is used to derive the specified values only. Most functional tests can be done once the extracted output is processed by discrete Fourier transform (DFT). As a result, it is not necessary to do further filtering. In some tests such as the FR test, filtering the out-of-band noise is even prohibited. In an STT, the power of the input tone is usually much larger than that of the shaped quantization noise within the passband. The analysis results can be obtained by calculating the signal tone power, summing up the noise power and/or the distortion power within the passband, and then deriving the desired ratios. Since the frequency of the input tone and its corresponding harmonics are well specified, the computation is quite straightforward—an -point DFT. By choosing , the fast Fourier transform (FFT) algorithm can be adopted [14]. Similarly, for IMD test, the possible locations of the major intermodulation tones are known once the input stimulus is determined. IMD is derived as the ratio of the sum of the signal power to the sum of the IMD power. The computation complexity is the same as that of the STT. Both FR and IMD tests are MTTs except that the FR test concerns only the output response of the input tones. The tones need not be all in the passband, as discussed in Section II-C3. Thus, it is important to make sure that only the CUT responds to the tones. Equation (16) indicates that the FR of the CUT can be obtained by filtering the extracted output using , if and FROR . Any additional FROR filtering that distorts the FR result is not recommended. The results are then used to obtain the spectrum, and the response of the input tones are extracted and compared with the specificaand have dc gain and some tion. In general, and are FIR filters whose delay. Also, and , respectively. numbers of taps are Hence, the analysis complexity is equal to the FIR filtering plus an -point FFT. In addition to the frequency-domain analysis, dc characteristics such as the offset and bias voltages can also be measured from the dc term of the extracted spectrum.
Fig. 8.
Block diagram of the test chip.
Fig. 9. Photograph of the test chip. TABLE I SILICON AREA OF THE COMPONENTS
is able to access the output nodes of the first integrator of the second-order ARE and the primary output of the CUT. The second-order ARE can access the primary output of the CUT. The output bit streams of both AREs are captured by a logic analyzer. The primary output is intentionally routed off chip and then fed back to the AREs, in order to simulate the possible long routing paths of the on-chip analog buses. Fig. 9 shows the test chip photo. The size of the test chip is 3225 1988 m . Table I summarizes the silicon areas of the components. A. Digitally Testable ARE
III. TEST CHIP IMPLEMENTATION Fig. 8 shows the block diagram of the test chip and the test environment setup. The one-bit DAC receives the periodic modulated bit stream from the external pattern generator, and feeds the CUT with the stimulus waveform. The first-order ARE
The single-bit first- and second-order - modulators are chosen as the candidates for analog response extraction because they occupy reasonable areas and are relatively stable. Fig. 5 indicates that the fourth-order - modulator outperforms the first- and second-order ones. Unfortunately, its area is almost
HONG et al.: APPLYING
-
MODULATION-BASED ANALOG BIST TO SAMPLED-DATA SYSTEMS
559
TABLE II FOLDED OPAMP CHARACTERISTICS
rate for 14-bit settling. The cost for accommodating such a high sampling rate is a 22.37-mW test power. Fig. 12 depicts the SC implementation of the second-order - modulator. The same opamp and comparator used in the to first-order - modulator are employed. The switches with dotted-line connections in Figs. 10 and 12 demonstrate how to test the AREs by the same BIST scheme. By turning off and , the six switches to and the switches and form a fully differential one-bit DAC that capacitors to test the AREs. By analyzing their accepts the bit stream digital outputs, the performance of the AREs can be obtained. The hardware cost for testing the ARE is clearly low. B. Single-Bit DAC
Fig. 10.
Schematic of the first-order
6-1 modulator.
twice as large as that of the second-order one, and it is only conditionally stable [15]. Extra design effort must be paid to solve the stability problem. Fig. 10 shows the fully differential implementation of the first-order - modulator. The circuit consists only of an operational amplifier (opamp), a comparator, six capacitors, and some switches. It has been shown that circuit imperfection of the comparator will be attenuated by the modulation loop itself [13]. Therefore, the key component that affects the yield of the first-order ARE is the opamp. We use the folded opamp, as shown in Fig. 11, to implement the AREs. The dominant poles of the folded opamp are generand . Consequently, it is ally located in its outputs, inherently stable under a proper load. The common-mode feedback is necessary to maintain the outputs at the desired operation to and to , depoints. The SC sensor, formed by tects the difference between the common-mode output and the , and then feeds it back via desired common-mode voltage to adjust the common-mode output. Table II lists the simulation results of the folded opamp. A unit-gain bandwidth up to 245 MHz is designed to accommodate a 25-MHz sampling
The fully differential digital-to-charge converter (see Fig. 13) and the succeeding opamp form the one-bit DAC in our test chip. The DAC consists of only ten switches and two capacitors. The virtual ground represents the differential inputs of the opamp in the CUT’s input stage. This simple structure ensures a high yield. A different type of DAC may be needed for other CUT’s. C. Circuit Under Test Filters are among the most popular applications of sampled-data systems. To demonstrate the effectiveness of the BIST scheme, a second-order Fleischer–Laker biquad filter [18] is implemented on the test chip as the CUT. It is designed as a Butterworth low-pass filter having a dc gain of 4. The MHz. Its poles are located at the CUT operates at , i.e., 40 kHz. The design is for audio same frequency: signal processing. Fig. 14 depicts its schematic. Its transfer functions are given in (21) and (22), shown at the bottom of the and primary page. The FR at its internal outputs are shown in Fig. 15. outputs IV. MEASUREMENT RESULTS In our test environment, the reference voltages of the ASG and ARE are same. The full-scale input of the ARE is used as a base and the measurement results, if applicable, are normalized
(21) (22)
560
IEEE TRANSACTIONS ON CIRCUITS AND SYSTEMS—II: ANALOG AND DIGITAL SIGNAL PROCESSING, VOL. 50, NO. 9, SEPTEMBER 2003
Fig. 11.
Simplified schematic of the folded opamp.
Fig. 12.
Schematic of the second-order
6-1 modulator.
HONG et al.: APPLYING
Fig. 13.
-
MODULATION-BASED ANALOG BIST TO SAMPLED-DATA SYSTEMS
561
Schematic of the fully differential one-bit DAC.
Fig. 16. SNDR performance of the first- and second-order AREs at different sampling rates with a 4.6 dBFS 1-kHz input.
0
Fig. 14.
Fleischer–Laker biquad filter as the circuit under test.
Fig. 17.
Fig. 15. Frequency response specifications of the CUT’s internal and primary outputs.
in the dBFS form. With the coherency requirement, all modules operate at the same sampling rate of 5 MHz. The OSR is kept at 128, corresponding to a passband from dc to about 20 kHz. A. Performance of the ARE An external waveform generator is used to characterize the AREs with traditional functional tests. Note that this characterization is not always necessary in practice. Instead, the design-for-testability technique described in Section III-A can be used. The purpose here is to understand the performance limitation of the on-chip analog BIST circuitry. Fig. 16 shows
Output spectra of the first- and second-order AREs at 5 MHz.
the SNDR measurements of the AREs at different sampling rates. Both AREs have the same 4.6-dBFS 1-kHz input signal. The second-order ARE achieves 82-dB SNDR at sampling rates lower than 10 MHz and 80-dB SNDR at 25 MHz. The first-order ARE achieves 60-dB SNDR at sampling rates lower than 20 MHz and 58-dB SNDR at 25 MHz. Fig. 17 plots the output spectra of the two AREs operating at 5 MHz. In the figure, the two curves labeled by and correspond to the output spectra of the first- and second-order AREs, and are respectively. The two curves the cumulative sums of noise and distortion for the outputs of the first- and second-order AREs, respectively. They reveal the DR performance with respect to the specified passband. For example, when the passband is from dc to 20 kHz, the DRs of the first- and second-order AREs are 64.7 and 86.6 dB, respectively. As we increase the passband to 40 kHz, the DRs reduce to 56.1 and 74.8 dB, respectively. Note that the second-order ARE outperforms the first-order one in both cases. As for dc characteristics, the second-order ARE has a dc offset less than 2.35 mV, and the first-order ARE has an offset about 664 V. Table III lists the measured performance parameters of the AREs, with those in [8]. All three AREs were fabricated using 0.35- m 3.3-V CMOS process.
562
IEEE TRANSACTIONS ON CIRCUITS AND SYSTEMS—II: ANALOG AND DIGITAL SIGNAL PROCESSING, VOL. 50, NO. 9, SEPTEMBER 2003
TABLE III ARE PERFORMANCE COMPARISON
Fig. 18. ARE.
Output spectrum of the CUT measured by STT using the second-order
Fig. 19. ARE.
Output spectrum of the CUT measured by STT using the first-order
B. Single-Tone Test The 20-dBFS 2-kHz stimulus shown in Fig. 4 is used for the STT. The 20-dBFS input of the CUT corresponds to a 8-dBFS input of the ARE, since the CUT has a gain of 12 dB. The measured spectra by the second- and first-order AREs are depicted in Figs. 18 and 19, respectively. In either figure, the solid curve is the output spectrum of the ARE, and the dash-dotted curve is the cumulative sum of noise and distortion in Fig. 18 indicates that the CUT power. The curve dB for a 20-kHz passband. has a DR of We need to clarify that the measured value is indeed limited by
TABLE IV COMPARISON OF MEASUREMENT AND SIMULATION RESULTS OF THE STT
the intrinsic circuit noise. Recall that the shaped quantization noise power decreases as the frequency decreases. We take the signal average below 2 kHz as the intrinsic noise floor—the dBFS Hz. Assuming that the measured value is noise is uniformly distributed up to the Nyquist rate (2.5 MHz), we can approximate the DR of the CUT with respect to a specified passband. The dashed line in Fig. 18 indicates the accumulative intrinsic noise power of the ARE with respect to ) and the defined passband. The dash-dotted line ( the dashed line intercept at 24 kHz; i.e., the intrinsic circuit noise dominates when the frequency is below 24 kHz, while the shaped quantization noise and harmonic distortion dominate when the frequency is above 24 kHz. The first-order ARE reports that the cumulative noise and distortion power up to 20 kHz is 57.43 dBFS, which means the CUT has a DR no worse than 69.4 dB. With the same procedure, the intrinsic noise floor can be calculated as dBFS Hz. Compared with the result from the second-order ARE, there is a minor difference that is less than 0.6 dBFS. The difference is because the first-order ARE has lower intrinsic noise, which will be discussed in Section IV-E. The critical frequency is 3.2 kHz as shown in Fig. 19. It is the significant harmonics that limit the critical frequency. These harmonics come from the first-order ARE itself, since no similar harmonics are observed in Fig. 18. The source of the harmonics is the stronger correlation between the input signal and the quantization noise of the first-order - modulator [16]. They can be found in the behavior simulation even when all circuits are assumed to be ideal. The behavior simulation and measurement results are listed in Table IV. It is interesting to note that the measurement results of the first-order ARE are better than predicted. The reason is that the presence of intrinsic circuit noise helps decorrelating the dependency between the quantization noise and the input of the modulator. As a result, the harmonic tones are alleviated [17]. The simulated and measured results for the listed test items differ by about 13.6 dB when using the second-order ARE. The second-order ARE successfully measures the CUT’s noise performance, since it can measure the CUT’s DR up to 98.6 dB as shown in Fig. 17. The differences between the measured and simulated SNDR, SNR, and DR of the second-order ARE come from the presence of the CUT’s circuit noise, which is what we intend to find. However, the difference of the measured and simulated SDR in Table IV is not due to the nonlinearity of the CUT. Instead, it is the result of our computation algorithm, since we add all the power on the harmonic bins as the distortion power without considering whether the power is dominated by the intrinsic noise or distortion noise. Consequently, the measured SDR is a lower bound estimate. A more accurate result can be of the output bit stream is increased. obtained if the length
HONG et al.: APPLYING
-
MODULATION-BASED ANALOG BIST TO SAMPLED-DATA SYSTEMS
Fig. 20. MTT spectrum using the first-order ARE and the fourth-order modulated input.
6-1
563
Fig. 22. Frequency responses of the MTTs using different ASGs and AREs. TABLE V
FROR
(z) PARAMETERS (IN dB) OF THE 027-dBFS INPUT TONES OF DIFFERENT ASGs
tortion is observed during the MTT. For the first-order ARE, the total output noise and distortion power is 53.16 dBFS, which is worse than the STT result. Obviously, the additional distortion power comes from the intermodulation effect of the first-order ARE as shown in Fig. 20. D. Multitone Test for Frequency Response
61
Fig. 21. MTT spectrum using the second-order ARE and the fourth-order modulated input.
Doubling the length lowers the noise floor by 3 dB while the harmonic tones are not affected. C. Multitone Test for Intermodulation Distortion In the MTT experiments, the test stimulus consists of six tones, which are selected such that we can measure the FR and IMD of the CUT at the same time. They have the same amplitude of 27.6 dBFS, equivalent to a 15.6 dBFS input for the ARE. Their frequencies are 839, 2517, 7553, 22 659, 67 977, and 203 934 Hz, respectively, each being exactly three times the previous one. The major intermodulation will appear only at even harmonics of 839 Hz. For the IMD test, the fourth-order - modulated input is applied to stimulate the CUT, because it has higher spectral purity within the passband. The solid curves in Figs. 20 and 21 are the spectra of the CUT output digitized by the first- and second-order AREs, respectively. The cumulaand are tive noise and distortion power also plotted on the figures as the dash-dotted lines, indicating the measured noise and distortion performance with respect to the passband width. The total output noise and distortion power of the second-order ARE is 73.33 dBFS, which is almost identical to the result of the STT. We conclude that no additional dis-
Fig. 22 shows the frequency responses of the MTTs with respect to different bit-stream synthesizers calculated by (16). In the figure, the solid line represents the CUT’s FR specification. The ‘o’, ‘x’, and ‘*’ labeled lines are the tone responses corresponding to the first-, second-, and fourth-order ASGs, respectively. The darker lines are extracted by the second-order ARE, and the gray lines are extracted by the first-order ARE. The FRs obtained by the two AREs are almost the same within the passband, despite that they have different SNDRs. This suggests that the first-order ARE is as good as the second-order one for FR test. For both AREs, the dc gain error is about 0.36 dB and there is a 3-dB pole shift. However, they report different results for the sixth tone. The reason is that the shaped noise floor has comparable power to the CUT’s response at the sixth tone, as can be seen in Fig. 21. Both the ASG and ARE may contribute to the shaped noise. To see which result is more reliable, we examine the FROR and FROR values of different configurations. Table V parameters derived from (14) for the lists the FROR input tones with respect to different ASGs. All ASGs are able values, so we have to to provide sufficiently large FROR check if (20) holds for all stimulus tones. For the implemented is located at the sixth CUT, the largest required FROR tone, which should not be less than 29 dB according to Fig. 15. values of the first- and Table VI lists the FROR second-order AREs with different ASGs in the FR test. The value on fourth-order ASG provides the largest FROR
564
IEEE TRANSACTIONS ON CIRCUITS AND SYSTEMS—II: ANALOG AND DIGITAL SIGNAL PROCESSING, VOL. 50, NO. 9, SEPTEMBER 2003
TABLE VI
FROR
Fig. 23.
FROR
(z ) PARAMETERS (IN dB) OF DIFFERENT ASGS AND AREs
parameters of different ASGs and AREs.
the most critical sixth tone, though it results in the smallest value. The reason is that the fourth-order ASG FROR amplifies the sixth tone by more than 4 dB, as shown in Fig. 7. This gain will pass through the CUT, so the extracted response of the sixth tone is 4 dB higher, while the shaped noise of the , ARE remains the same. Note that since FROR the response of the shaped noise generated by the ASG can be ignored. Generally, the choice of the best ASG and ARE depends on the locations of the tones and the FR of the CUT. parameters of different Fig. 23 depicts the FROR combinations. The fourth-order ASG and the first-order ARE value on the sixth tone, so achieves the highest FROR this combination gives the most accurate measurement result. In Table VI, the two AREs originally are capable of detecting the FR of the sixth tone. However, the 3-dB pole shift of the value at the sixth CUT increases the required FROR tone to 35 dB. In addition, the uncertainty of the noise floor can be higher than 8 dB, as illustrated in Fig. 4. Therefore, the measured FR at the sixth tone shows considerable errors. E. Diagnosing the CUT We normally only observe the primary output during testing. However, some internal nodes may be very important observation points. For example, in our CUT we can say the chip is good if the primary output has only 0.36-dB gain error, but the response of the first stage of the CUT has a significant impact on the full-scale SNDR, since overloading any of the two opamps will cause output excursion limiting harmonic distortion. With the BIST scheme, we are able to access any internal nodes of the CUT for diagnostics. In practice, the low-impedance nodes such as the opamp outputs are preferred
Fig. 24.
Frequency response of the CUT’s internal output measured by MTT.
because of their resilience against the disturbance from the BIST circuitry. High-impedance nodes, such as the opamp inputs, are not good candidates due to the longer settling time required and their vulnerability to disturbance from the BIST circuitry. In most applications, it is sufficient to verify only the low-impedance nodes. Consider again the transfer functions as described by (21) and (22). The dc gain of the primary output is determined by the ratio , while the dc gain of the internal output is determined . It implies that the dc gain of the internal by output is more vulnerable to the capacitor mismatch than the primary output. Figs. 22 and 24 show the MTT measurement results of both the internal and primary outputs, respectively. The test chip is configured such that the internal and primary outputs are digitized by the first- and second-order AREs, respectively. A 2.36-dB gain error has been found at the CUT’s first-stage output, as shown in Fig. 24. This gain error degrades the peak SNDR by 2.36 dB—the first opamp will saturate before the second opamp reaches its full-scale output. If we could only observe the primary output, it would have been harder to detect such kind of failure. We measured all ten samples and found that all of them have similar gain errors. Therefore, the gain error is most likely due to the parasitic capacitance of the layout or from the effect of process gradient on capacitor values. F. Comparison of the AREs We should pick the smallest ARE that meets the measurement requirements. DR is a good performance index for noise measurement by STTs because an ARE achieving a small DR will make the measurement results dominated by the ARE rather than the CUT. Fig. 25 depicts the DR performance of the first-
HONG et al.: APPLYING
-
MODULATION-BASED ANALOG BIST TO SAMPLED-DATA SYSTEMS
565
V. CONCLUSION
Fig. 25.
DRs of the first- and second-order AREs for different passbands.
We have applied the - modulation based analog BIST scheme to a sample-data system with no extra anti-aliasing or reconstruction filters. The test chip contains a Fleischer–Laker biquad filter as the CUT, a one-bit DAC, a first-order and a second-order - modulators as ARE candidates, and a multiplexer to select the observation nodes. The DAC feeds the CUT with stimulus waveforms which are converted from the prestored bit streams generated by first-, second-, and fourth-order software - modulators. Combinations of the ASGs and AREs of different orders provide a number of choices for the functional tests. In particular, we showed that a valid multitone test for frequency response satisfies the , where necessary condition FROR is the frequency response observation range FROR is the transfer function of of the BIST circuit and the CUT. The selection of the ASG and ARE configurations depends on the CUT as well as the desired stimulus tones. As the ARE, the second-order - modulator was shown to be superior as far as general noise and distortion measurement was concerned. However, we have shown that the first-order modulator is more cost effective for the frequency response test, since it is about 40% smaller in silicon area than the second-order one, while providing a comparable precision. Our work also demonstrated that the second-order - modulator can operate at a sampling frequency of 25 MHz and measure a . Such performance dynamic range of 85 dB, with shows the feasibility of applying the - modulation-based analog BIST scheme to general sampled-data systems.
REFERENCES
Fig. 26.
Maximal FROR
(z ) for different analog response extractors.
and the second-order AREs operating at 5 MHz with respect to the passband frequency. From 1 to 400 kHz, the second-order ARE outperforms the first-order one, but for a passband lower than 1 kHz, the first-order ARE is better. The reason is that when the OSR is high, the intrinsic noise is higher than the shaped quantization noise. The first-order ARE circuit is simpler and, hence, has lower intrinsic circuit noise. defined in (15) is an appropriate perforThe FROR mance index of the ARE for FR tests. It represents the ratio of the output tone to the noise of the ARE at the desired freand K, the corresponding quency. With of the first-, second-, and fourth-order maximal FROR AREs are as shown in Fig. 26. Note that all AREs have narrow in the high-frequency range because of noise FROR shaping, and the first-order ARE has the widest FROR for tone frequencies higher than 200 kHz. The first-order ARE when the frequency is low. also has reasonable FROR Recall that the FR of the CUT can be detected as long as and FROR . Further increase of FROR gives no significant benefit. We, thus, conclude FROR that the first-order ARE is more cost effective for FR tests.
[1] M. L. Bushnell and V. D. Agrawal, Essentials of Electronics Testing for Digital, Memory and Mixed-Signal VLSI Circuits. Norwell, MA: Kluwer, 2000. [2] M. F. Toner and G. W. Roberts, “A BIST scheme for an SNR, gain tracking, and frequency response test of a sigma-delta ADC,” IEEE Trans. Circuits Syst. I: Fund. Theory Applicat., vol. 42, pp. 1–15, Jan. 1995. [3] C.-Y. Pan and K.-T. Cheng, “Implicit functional testing for mixed-signal circuits,” in Proc. IEEE VLSI Test Symp. (VTS), 1996, pp. 489–494. [4] K. Arabi and B. Kaminska, “Oscillation built-in self test (OBIST) scheme for functional and structural testing of analog and mixed-signal integrated circuits,” in Proc. Int. Test Conf. (ITC), 1997, pp. 786–795. , “On chip testing data converters using static parameters,” IEEE [5] Trans. VLSI Syst., vol. 6, pp. 409–419, Sept. 1998. [6] A. Hajjar and G. W. Roberts, “A high speed and area efficient on-chip analog waveform extractor,” in Proc. Int. Test Conf. (ITC), 1998, pp. 688–697. [7] B. Dufor and G. W. Roberts, “On-chip analog signal generation for mixed-signal built-in self-test,” IEEE J. Solid-State Circuits, vol. 34, pp. 318–330, Mar. 1999. [8] M. Hafed and G. W. Roberts, “A stand-alone integrated excitation/extraction system for analog BIST applications,” in Proc. IEEE Custom Integrated Circuits Conf. (CICC), 2000, pp. 83–86. [9] M. Hafed, N. Abaskharoun, and G. W. Roberts, “A stand-alone integrated test core for time and frequency domain measurements,” in Proc. Int. Test Conf. (ITC), 2000, pp. 1031–1040. [10] J.-L. Huang and K.-T. Cheng, “Testing and characterization of the one-bit first-order delta-sigma modulator for on-chip analog signal analysis,” in Proc. Int. Test Conf. (ITC), 2000, pp. 1021–1030. , “A sigma-delta modulation based BIST scheme for mixed-signal [11] circuits,” in Proc. Asia and South Pacific Design Automation Conf. (ASPDAC), 2000, pp. 605–610. [12] K. Lofstrom, “Early capture for boundary scan timing measurements,” in Proc. Int. Test Conf. (ITC), 1996, pp. 417–422.
566
IEEE TRANSACTIONS ON CIRCUITS AND SYSTEMS—II: ANALOG AND DIGITAL SIGNAL PROCESSING, VOL. 50, NO. 9, SEPTEMBER 2003
[13] H.-C. Hong, B.-H. Lin, and C.-W. Wu, “Analysis and design of multiple-bit high-order - modulator,” in Proc. Asia and South Pacific Design Automation Conf. (ASPDAC), 1997, pp. 419–424. [14] A. V. Oppenheim and R. W. Schafer, Discrete-Time Signal Processing. Englewood Cliffs, NJ: Prentice-Hall, 1989. [15] T.-H. Kuo, K.-D. Chen, and J.-R. Chen, “Automatic coefficients design for high-order sigma-delta modulators,” IEEE Trans. Circuits Syst. II: Analog Digital Signal Process., vol. 46, pp. 6–15, Jan. 1999. [16] R. M. Gray, “Spectral analysis of quantization noise in a single-loop sigma-delta modulator with dc input,” IEEE Trans. Commun., vol. 37, pp. 588–599, June 1989. [17] S. R. Northworthy, “Optimal nonrecursive noise shaping filters for oversampling data converters—Part 1: Theory,” in Proc. IEEE Int. Symp. Circuits and Systems (ISCAS), 1993, pp. 1353–1356. [18] K. R. Laker and W. M. C. Sansen, Design of Analog Integrated Circuits and Systems. New York: McGraw-Hill, 1994.
61
Hao-Chiao Hong (S’92) received the B.S. and M.S. degrees in electrical engineering from National Tsing-Hua University, Hsinchu, Taiwan, R.O.C., in 1990 and 1992, respectively, where he is currently working toward the Ph.D. degree in electrical engineering. From 1997 to 2001, he was with Taiwan Semiconductor Manufacturing Company, Hsinchu, where he was responsible for analog IP development. His main research interests include design-for-test and built-in self-test for mixed-signal systems, and analog circuit designs including analog-to-digital converters, digital-to-analog converters, phase-locked loops, and analog filters.
Jiun-Lang Huang received the B.S. degree in electrical engineering from National Taiwan University, Taipei, Taiwan, R.O.C., in 1992, and the M.S. and Ph.D. degrees in electrical and computer engineering from the University of California at Santa Barbara (UCSB) in 1995 and 1999, respectively. From 2000 to 2001, he was an Assistant Research Engineer with the Department of Electrical and Computer Engineering, UCSB. In 2001, he joined National Taiwan University, where he is currently an Assistant Professor in the Graduate Institute of Electronics Engineering. His main research interests include design-for-test and built-in self-test for mixed-signal systems and VLSI system verification.
Kwang-Ting (Tim) Cheng (S’88–M’88–SM’98– F’00) received the B.S. degree in electrical engineering from National Taiwan University, Taipei, Taiwan, R.O.C., in 1983, and the Ph.D. degree in electrical engineering and computer science from the University of California at Berkeley in 1988. He was with Bell Laboratories, Murray Hill, NJ, from 1988 to 1993, and joined the faculty of the University of California at Santa Barbara in 1993, where he is currently a Professor of electrical and computer engineering. His current research interests include VLSI testing, design verification, and multimedia computing. He has been working closely with U.S. industry for projects in these areas. He has published over 200 technical papers, coauthored three books, and holds nine US patents. Dr. Cheng received the Best Paper Awards from the Design Automation Conference in 1994 and 1999 Design Automation Conference, the 2001 Annual Best Paper Award from the Journal of Information Science and Engineering, the Best Paper Award from the 2003 Conference of Design Automation and Test in Europe (DATE 2003), and the Best Paper Award at the 1987 AT&T Conference on Electronic Testing. He currently serves as Associate Editor-in-Chief for the IEEE Design and Test of Computers. He has also served on the Editorial Boards of IEEE TRANSACTIONS ON COMPUTER-AIDED DESIGN and the Journal of Electronic Testing: Theory and Applications. He has been General Chair and Program Chair of the IEEE International Test Synthesis Workshop and has served on the technical program committees for several international conferences on CAD and test, including DAC, ICCAD, ITC, and VTS.
Cheng-Wen Wu (S’86–M’87–SM’95) received the B.S.E.E. degree from National Taiwan University, Taipei, Taiwan, R.O.C., in 1981, and the M.S. and Ph.D. degrees, both in electrical and computer engineering, from the University of California at Santa Barbara (UCSB), in 1985 and 1987, respectively. From 1981 to 1983, he was an Ensign Instructor with the Chinese Naval Petty Officers’ School of Communications and Electronics, Tsoying, Taiwan. From 1983 to 1984, he was with the Information Processing Center of the Bureau of Environmental Protection, Executive Yuan, Taipei. From 1985 to 1987, he was a Post-Graduate Researcher with the Center for Computational Sciences and Engineering, UCSB. Since 1988, he has been with the Department of Electrical Engineering, National Tsing Hua University (NTHU), Hsinchu, Taiwan, where he is currently a Professor. He also served as the Director of the University’s Computer and Communications Center from 1996 to 1998, and the Director of the University’s Technology Service Center from 1998 to 1999. From August 1999 to February 2000, he was a Visiting Faculty with the Department of Electrical and Computer Engineering, UCSB. Since August 2000, he has been the Chair of the Department of Electrical Engineering, NTHU. He is also the Director of the IC Design Technology Center, NTHU. His research interests include design and testing of high-performance VLSI circuits and systems. Dr. Wu was the Technical Program Chair of the IEEE Fifth Asian Test Symposium (ATS’96) and the General Chair of ATS’00. He is an Associate Editor for the Journal of the Chinese Institute of Electrical Engineers (JCIEE). He was a Guest Editor of the JCIEE Special Issue on Design and Test of System-on-Chip, and was a Guest Editor of the Journal of Information Science and Engineering (JISE) Special Issue on VLSI Testing. He received the Distinguished Teaching Award from NTHU in 1996, the Outstanding Electrical Engineering Professor Award from the Chinese Institute of Electrical Engineers (CIEE) in 1997, and the Distinguished Research Award from National Science Council in 2001. He is a Life Member of CIEE.
Ding-Ming Kwai (M’91) received the Ph.D. degree in computer engineering from the University of California at Santa Barbara in 1997. From 1989 to 1991, he was with the Chung Cheng Institute of Technology (CCIT), Taoyuan, Taiwan, R.O.C., as a Reserve Officer. From 1991 to 1993, he was with the Hualon Microelectronics Corporation (HMC), Hsinchu, Taiwan, as a Design Engineer. From 1998 to 1999, he was with Worldwide Semiconductor Manufacturing Corporation (WSMC), Hsinchu, as a Manager in the Application Service Division. From 1999 to 2001, he was with Taiwan Semiconductor Manufacturing Company (TSMC), Hsinchu, as a Manager in the Design Service Division. In 2001, he cofounded the Intellectual Property Library Company (IPLib), Hsinchu. His research deals with parallel architectures and algorithms, interconnection networks, testable design, and design for testability. In these fields, he has published more than 30 journal and conference papers. Dr. Kwai is a member of the Phi Tau Phi Honorary Scholastic Society.