OxMetrics: GiveWin, PcGive, and PcNaive. Introduction to Time Series Data and
Stochastic Processes. (1) Characteristics of time series data. Time dependence ...
Econometrics 2 — Fall 2005
Practical Introduction and Outline of the Course Heino Bohn Nielsen
1 of 10
Plan for Today Introduction to Econometrics 2 (1) Practical remarks. (2) Prerequisites and relation to Econometrics 1. (3) Broad outline of the course. (4) Lectures, exercise classes, and exam. (5) Introduction to software: OxMetrics: GiveWin, PcGive, and PcNaive. Introduction to Time Series Data and Stochastic Processes (1) Characteristics of time series data. Time dependence, trends, co-movements, and changing volatility. (2) Stochastic Processes: Stationarity. (3) Transformations to stationarity.
2 of 10
Practical Information The course home page can be found via www.econ.ku.dk/metrics It contains: (1) Updated course schedule and other information. (2) Contact information. (3) Lecture notes to complement Verbeek (2004). (4) Copies of the slides. Note: Often the slides contain many details, but do not replace the curriculum. (5) Problem sets and material for the exercises classes.
3 of 10
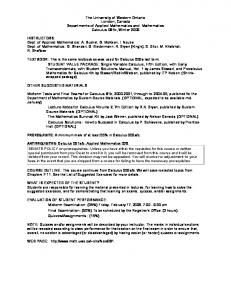
Starting Point Econometrics 2 is a part of compulsory BA-sequence: Econometrics 1 Linear Regression Cross-Sectional data
→
Econometrics 2 Estimation Principles Time Series data
No repetition, we build directly on the results from Econometrics 1. Prerequisites (from Econometrics 1 or similar):
• • • •
Knowledge of linear regression. Properties of OLS in random samples (cross-sectional data). Knowledge of instrumental variables (IV) estimation. Misspecification: Heteroskedasticity.
4 of 10
Broad Outline of Econometrics 2 Estimation Principles and Estimation Theory: (1) Linear regression (OLS) for time series data. (2) Maximum Likelihood (ML) estimation. (3) Generalized Method of Moments (GMM) estimation. Nonlinear instrumental variables (NLIV) estimation. Econometrics for Time Series Data: (1) Characteristic features of time series. (2) When do the cross-sectional results hold? Adapt the tools to relevant questions in time series models. (3) New tools for time series data. Unit root testing; cointegration; conditional heteroskedasticity. Important Mathematical Tool: (1) Monte Carlo simulation Replace statistical theory. Obtain intuition for statistical properties. 5 of 10
Theory and Practice! The ultimate goal of Econometrics 2 is applied: “We want to develop the tools necessary for analyzing relevant problems in real time series data”. Mostly macro issues: consumption vs. income; unemployment vs. inflation; etc. Cover some issues for financial data. Lectures and exercise classes are:
• Partly theoretical: Deal with the mathematical structure of the models and explore the properties. Necessary for understanding the tools (and for being critical towards them!). • Partly empirical: Feeling for real data. Hands-on experience. Promote an interest for doing empirical analyses. Different tools apply to different problems. Introduce practical tools to perform analyses for e.g. BA projects or MA theses. 6 of 10
Lectures and Exercises Lectures: (1) Present theory and examples. Motivate and build intuition. (2) Emphasize important elements. Explain (many) details and try to organize the material. Extremely difficult to learn econometrics from lectures alone... Exercise classes: (1) Work with theoretical problems. Only way to learn the details. (2) Estimate econometric models for real data. Important for understanding the theoretical details. This is what econometrics is for! Promote an interest for data analysis and give the proper tools. Both elements are equally important for learning econometrics. 7 of 10
The Exam The exam is straightforward. Test whether you understand: (1) The main results and the underlying intuition. (2) The tools and how they should be applied. (3) The details of specific econometric models. The exam has both theoretical and empirical elements. 4 hours closed book exam. 4 questions. Each divided in (a) Represents basic material (50%). (b) Requires a somewhat more detailed knowledge of the curriculum (30%). (c) Requires a deeper understanding (20%).
8 of 10
Software: OxMetrics Package In this course we introduce the software package OxMetrics. Advanced, up-to-date and easy-to-use (menu-driven) package. GiveWin Shell to handle data, results, graphics PcGive Econometric Modelling ..
PcNaive Monte Carlo Simulation .. Ox Matrix programming language
The programs: GiveWin, PcGive, PcNaive, and Ox are freely downloadable via www.econ.ku.dk/metrics for your personal use at home! Require password and license codes. 9 of 10
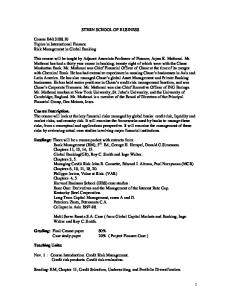
GiveWin Illustration: Wage Phillips Curve Consider the simple regression model
∆WAGEt = β 0 + β 1 · UNRt + t, for t = 1971 : 2, ..., 2003 : 2, where
∆WAGE Increase in Danish manufacturing wages (per cent q-o-q). UNR Registered unemployment rate (per cent of labour force).
10 of 10