Practical Papers, Articles and Application Notes Kye Yak See, Technical Editor
I
am just back from the EMC Europe 2011 conference in York, United Kingdom. It was a pleasant surprise for me as I did not expect an unusual sunny September in Europe where the temperature could shoot up to 29˚C during the day time. Some delegates joked that I brought the sunny weather from Singapore to Europe! It was a great conference with new technologies on display in the exhibit hall and excellent research papers presented during the technical program. Of course, I enjoyed the social networking with delegates in the closely knitted EMC community as well. Without fail, in this issue, we have three very interesting papers authored by three relatively young researchers, which is an encouraging sign as it shows that EMC continues to draw interest from the young engineers and researchers. The first paper, “Field Distribution in a Stripline and Its Influence on Immunity Testing,” is contributed by Huadong Li from Caterpillar Inc. I have known Huadong for more than 10 years. He did his Master course at my unviersity and later moved to the USA for further career development. With his rich EMC test experience in the industry, Huadong shares with us some findings of field distribution in a stripline using transmission line analysis. He shows that the standing waves due to the impedance mismatch between the stripline and the load end can lead to non-repeatable results in immunity testing. Other factors such as the harness length, the location and the equivalent impedance of the peripheral and their impacts on field distribution and test results are also addressed. The next paper “EMI Filter Design Part I: Conducted EMI Generation Mechanism,” is authored by Vuttipon Tarateeraseth from Srinakharinwirot University, Thailand. Two years ago, Vuttipon came to my university as an exchange Ph.D. student from the Politecnico di Torino, Italy. During his one year exchange in my university, I noticed his research
and design experiences in switched-mode power supplies (SMPS), especially in the EMI filter design aspect. I encouraged him to contribute a three-part series on EMI filter design and he has kindly agreed to do so. The three-part series will provide the readers a systematic EMI filter design approach for SMPS without the usual trial-and-error method. This paper is the first part of the series and it explains the generation mechanisms of common mode (CM) and differential mode (DM) conducted emissions and the measurement setup for conducted emission compliance. In the subsequent papers in this series, he will describe a method to extract noise source impedances of a SMPS and proper selection of filter topology for optimal performance. I believe the series of papers will benefit design engineers in the switching convertors industries. The last paper “Extended Ground Pin as ESD Protection on Automatic Document Feeder Door Sensor,” is a short article contributed by Keng Kok Khoo from Hewlett Packard, Singapore. Keng Kok is an active committee member of the IEEE EMC Society Singapore Chapter. During one of the chapter meetings, he told me that he discovered a relatively simple solution to imrpove the ESD immunity of a printer. With the agreement of his company, in this paper, he illustrates that an extended ground pin serving as an ESD arrestor, placed near the automatic document feeder door sensor of a printer, can act as a simple and cost effective ESD solution. The proposed solution eliminates the need of having additional ESD protection components on the sensor or the circuit. I hope you will find these three papers informative and useful. I encourage more engineers involved in EMC design and measurement to consider sharing your experience in this column. Please email me your thoughts at
[email protected].
Field Distribution in a Stripline and Its Influence on Immunity Testing Huadong Li, Caterpillar Inc., Peoria, IL;
[email protected]
Abstract—This paper analyzes the field distribution in a stripline. Under the assumption that only transverse electromagnetic (TEM) waves travels in it, the field in a stripline is found to be nonuniform along its longitude at high frequencies because of its unmatched impedance with the termination loads and typical standing waves exist in it. Immunity tests with the stripline method are theoretically analyzed. It is found that the
40
test results depend on the field distribution. Many factors such as the harness length, the location and the equivalent impedance of the peripheral may affect the test results. The nonuniform field distribution in a stripline causes the test results unrepeatable. Index Terms—Immunity testing, stripline, common-mode response.
©2011 IEEE
1. Introduction 1,000
≈ 150
2,000
1
2
≈ 3,500
3 4 X
≈ 900 ≈ 300
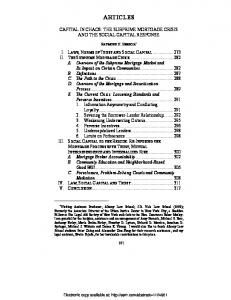
Several types of test facilities are used today to measure the immunity of electronic equipment and systems to radiated fields. They are (semi-) anechoic chambers, mode-stirred reverberating chambers (MSRC) and various TEM cells. A stripline is a test fixture which can be used for testing the immunity of automotive electronic devices to radiated radio frequency (RF) electromagnetic fields. The test procedures are described in SAE J-1113-23[1] and ISO 11452-5 [2]. A stripline for radiated field immunity tests, shown in Fig. 1, is a non-shielded version of a TEM cell consisting of an active conductor separated from the ground plane by air. It is usually built to have a characteristic impedance of either 50 V or 90 V and this is determined by the ratio between the width of the active conductor and the height of the active conductor above the ground plane. The advantages of a stripline for immunity tests are low cost, high field intensity and exposure of devices under test (DUT) plus wire harness to the interfering field, as well as good access to the test area. Since TEM waves are assumed inside striplines, striplines have limited working frequency ranges for immunity tests. [1] specifies the frequency range as 10 KHz to 200 MHz and [2] specifies it as 10 KHz to 400 MHz. Compared with the immunity test method in an absorber-lined shielded enclosure as prescribed in ISO 11452-2 [3] the stripline method doesn’t need antenna polarization change. This makes the stripline method more convenient. A 50 V stripline is thought to be easier to be matched with the driving system. However, it has a lower height and more stringent limits on the DUT size. 90 V striplines are often used for large size DUT. A stripline with characteristic impedance other than 50 V needs impedance matching, like lump circuit elements and tapered transmission lines, to reduce the voltage standing wave ratio (VSWR) inside and the power reflection at the ends. Due to the non ideal features of matching units like component frequency characteristics, designing and manufacturing tolerances, most real striplines do not perfectly match the driving systems and the load. Considerable standing waves can exist inside. In [4] the VSWR in a well designed stripline is measured to be above 1.5 at 130 MHz. Impedance mismatch also exists between a 50 V stripline test section and its feed/load points. [5] shows that the VSWR in a 50 V commercial stripline can be above 1.8 around 250 MHz. Strictly speaking, the electromagnetic wave traveling in a stripline is not a TEM wave since the stripline has two open sides and may have large distance between the active conductor and the ground plane. According to [6] we can assume that TEM waves dominate the fields inside a stripline under a few hundred mega Hz which is the typical use frequency range. However; the existing standing wave inside a stripline indicates the fields are not uniform. Its effect on the test results needs to be investigated. This paper will investigate the field distribution in a stripline. A theoretical model based on transmission line theory is used to analyze the generation mechanisms of standing waves. The root causes of the non uniform electric fields in a stripline are analyzed. To evaluate the stripline immunity test method, the coupling of a standing wave electromagnetic field to a transmission line is analyzed. Parameters affecting the test results are extracted.
1
Fig. 1. A design for 90 V stripline. (1. Dielectric rods; 2. Resistive load; 3. Ground plane; 4. Active conductor. Unit in mm).
2. Field Distribution in a Stripline Fig. 2 gives a circuit model for the stripline method test setup. The stripline is represented as a 3 m long lossless transmission line with a characteristic impedance Z0. Its value can be either 50 V, 90 V or others and is given as [2] Z0 5
120p b h h h 1 2.42 2 0.44 b 1 a1 2 b b
(2)
6
where b is the width of the active conductor and h is the height of the active conductor above the ground plane. This transmission line is terminated by a load ZL and driven by a source VS with an internal impedance ZS. Their values can be different to Z0. From the standpoint of the source, the stripline can be represented by its input impedance, Zin, and Vin appearing across the input terminal is given by Vin 5 Vs
Zin . Zs 1 Zin
(3)
The input impedance, Zin, seen by the source feeding the lossless transmission line can be calculated as Zin 5 Z0
ZL 1 jZ0 tan bl , Z0 1 jZL tan bl
(4)
where l is the length of the line and the propagation constant b 5 k0 5 v"m0e0 5 2pf "m0e0,
ZS
VS
Vin
x=0
Z0
ZL
x=l
Fig. 2. A circuit model of the TPL method test setup.
©2011 IEEE
41
where m0 and e0 are the permeability and permittivity of free space; f is the signal frequency. Once the input impedance is determined, the incident voltage at the input of the transmission line can be calculated as V01 5 Vs
Zin 1 , Zin 1 Zs 11CLe 2j2bl
(5)
where CL is the load reflection coefficient and is defined to be CL 5
ZL 2 Z0 . ZL 1 Z0
(6)
The total voltage at any point along a transmission line can be solved to be V 1 x, f 2 5 V01 e2jbx 11 1 CLe j2b1x2l2 2 .
(7)
Now that the voltage has been determined along the line, the magnitude of electric field strength can be determined to be E 1 x, f 2 5 V01 e2jbx 11 1 CLe j2b1x2l2 2 /h
Electric Field (V/m)
50 48 46 44 42 40 38 1
1.5 2 2.5 Distance from the Source (m)
3
Fig. 3. Calculated field distribution at 200 MHz in a stripline.
≥ 1,000
200
8 7
P
3
5
1
+20 200 0
≥ 200
4 2 6
Fig. 4. Example of stripline test configuration (1. Device under test; 2. Wiring harness; 3. Peripheral; 4, Termination resistance; 5. Insulating base; 6. Artificial network(s); 7. Active conductor; 8. Ground plane. Unit in mm).
42
3. Analysis of Stripline Immunity Test A typical immunity test setup with stripline method is shown in Fig. 4. During the test, the DUT and its peripheral are placed outside the stripline with the attached cable harness running at least 1 m inside the stripline along the length and exiting the stripline at 908 to the active conductor. A 50 mm high non conductive fixture is used for positioning the wiring harness in the center of the stripline, parallel to its major axis. According to [2], field calibration shall be conducted without DUT setup before stripline testing. The field strength inside the stripline can be calculated as
(8)
If CL Z 0, it is obvious that the electric field along the stripline changes with frequency and location. Fig. 3 gives the electric field distribution along the center of a stripline with an input signal VS 5 10 V at the frequency of 200 MHz. The other param-
36
eters used in the simulation are Z0 5 90 V; ZS 5 50 V; ZL 5 70 V and h 5 0.155 m. The mismatch considers the non ideal termination characteristics at high frequencies. The result shows a typical standing wave with VSWR 5 1.29. It is worth noting that this is only the field amplitude distribution. Besides that the electric fields also have different phases at different positions. This makes the analyses of immunity tests more complicated.
0E0 5
!P 3Z0 h
(9)
where P is the net power. Alternatively, the relation between the field strength and the net power may be determined by placing a calibrated field probe as close as possible to the center of the stripline. During the testing the field strength generated inside the stripline is determined by monitoring the net power. Once P is given, E is determined. The ideal situation is that this value shall have a direct relationship with the equivalent disturbance implemented on the DUT when it is tested. If the field distribution in the stripline is uniform, it is may be easy to understand that there exists a fixed relationship between the field strength and the equivalent disturbance on the DUT. However; if the field distribution is non uniform in the stripline, the relationship between the calibrated filed strength and the equivalent disturbance is not necessarily unique since with the same nominal field strength there can be many possible different field distributions. Besides the calibrated field strength value, the field distribution has direct influence on the equivalent disturbance on the DUT. It is useful to investigate how the field distribution affects the immunity test. If only the common-mode disturbance is considered, the harness under test can be treated as one conductor. It forms a transmission line with the ground plane of the stripline and is exposed to the electromagnetic field generated by the stripline. In the use frequency range of a stripline up to a few hundred MHz, the effective noise receivers are long cables and wires. In this paper we assume that the disturbance induced to the DUT is mainly contributed to by the noise picked up by the harness. The noises picked by the harness accumulate and work as an equivalent noise voltage VL1 to interfere with the DUT at its input/output interface connectors. It is reasonable to use the voltage, VL1, to indicate the severity level of the immunity test that the DUT is subject to. Fig. 5 gives a diagram for a stripline immunity test. ZL1 represents the equivalent impedance between the DUT and the ground plane; Zg1 represents the equivalent impedance between the peripheral and the ground plane. EZ(x), directed along z axis, is the external field generated by the stripline. The harness, located at a distance of h1 above the ground, forms a transmission
©2011 IEEE
line with the ground plate. Its characteristic impedance is ZC. The currents and voltages induced along a transmission line by the external fields are generally obtained by the solution of the telegrapher’s equations. If only the terminal response VL1 is required, the solution can be cast into the following form [7][8].
z
EZ (x ) Ex (x )
Zg1
1 111rL1 2 1 r 0 S2 1e j bl1S12 , VL1strip 5 j2bl1 e 2 r0rL1
y
h1
ZL1
(10)
where r0,L1 are the reflection coefficients of the peripheral and the DUT and are defined as Zg1,L12 ZC r0,L1 5 , (11) Zg1,L1 1 ZC where l1 is the length of the harness inside the stripline. The line propagation constant b is defined to be the same as in (4) and S 1 n0 1 n1x 2 nL1e jbl1 ¢ 1≤ 5 a (12) b, jbl1 S2 2 2n0e jbl1 2 n2 1 nL1 x e with h1
n0 5 3 Ez 1 x0 2 dz 5 Ez 1 x0 2 h1
(13)
l1 x = x0
x = x0 + l1
x
Fig. 5. A diagram for a stripline immunity test. waves result from the characteristic impedance mismatch between the stripline and the load end and the calibrated field distribution does not have unique relationship with the input power. The existence of the standing waves makes the stripline immunity test results depend on the position of the DUT setup, reflection coefficient of the stripline load end and the stripline line length. This causes the stripline immunity tests non repeatable.
0 h1
nL1 5 3 Ez 1 x0 1l1 2 dz 5 Ez 1 x0 1l12 h1 and
(14)
0 x 0 1l1
nx6 5 3Ex 1 x 2 e 6jbx dx 5 0 V.
(15)
x0
Here (15) comes from the assumption of Ex(x) 5 0 V/m. After some math work (10) is rewritten as VL1strip 5
V01 h1 1 1 11rL1 2 e j2bl1 2 r0rL1 2h 122jr0 sin 1 bl1 2 e2jbx0 1CLe jb1l1 22l2 1 12e2jbl1 22 . (16)
The measurement results depend on several parameters. The term V01 /h is related to the calibrated field strength and is defined by the test level. h1 is defined to be 50 cm in the standards. l1 is the length of the harness under test. Its value can change, but can be defined. r0 and rL1 depend on the peripheral and DUT setup. Their values depend on the projects. x0 reflects the location of the position of the DUT and its peripheral in the stripline and it is not specified by the standard. CL and l are related to the stripline. They will be of the same values for tests conducted in the same stripline, but may be of different values for tests with different striplines. At a nominal test level the equivalent disturbance applied to a DUT can vary with x0, CL and l. Let us consider a special case. If the stripline is perfectly matched at the load end then CL 5 0. The magnitude of (16) won’t be related with x0 and l. The test result will have a good repeatability.
Conclusion Measurements in the literature show that standing waves exist in striplines. Transmission line theory shows that the standing
References [1] Electromagnetic Compatibility Measurement Procedure for Vehicle Components – Immunity to Radiated Electromagnetic Fields, 10 kHz to 200 MHz, Strip Line Method, SAE J1113–23, 2002. [2] Road vehicles – Component test methods for electrical disturbances from narrowband radiated electromagnetic energy – Part 5: Stripline, ISO 11452-5, 2002. [3] Road vehicles-component test methods for electrical disturbances from narrowband radiated electromagnetic energy—Part 2: Absorber-lined shielded enclosure, ISO 11452-2:2004(E). [4] Y. Chung, T. Kang and D. Park, “Design and construction of stripline for measuring electromagnetic immunity of vehicular electrical cables”, IEEE International Symposium on EMC, May 1997, pp. 9–12. [5] M. Valek, T. Korinek, T. Bostik, “Design of stripline for EMC testing”, 14th conference, Microwave Techniques, April 2008, pp. 1–4. [6] J. Kuvedu-Libla, “Determination of frequency range limit when using stripline as emission or immunity test methods”, IEEE International Symposium on EMC, Aug. 2006, pp. 823–828. [7] F. M. Tesche, M. V. Ianoz, and T. Karlsson, EMC Analysis Methods and Computational Models, New York: Wiley, 1997. [8] M. Leone, Hermann L. Singer, “On the Coupling of External Electromagnetic Field to a Printed Circuit Board Trace”. IEEE Transactions on Electromagnetic Compatibility, Vol. 41, No. 4, November 1999, pp. 418–424.
Biography Huadong Li received the B.S. degree in Microwave Engineering from East China Normal University in 1989, the M. E. degree in Electrical Engineering from Nanyang Technological University in 1999, and the Ph.D. in Electrical Engineering from the University of Dayton in 2008. He worked as an Electronic Engineer with Shanghai Space Bureau, China from 1989 to 1996. Between 1999 and 2001, he was with Thomson Multimedia, Singapore working as an EMC Engineer. From 2001 to 2003, he was an EMC Engineer with Met Laboratories, Inc., Union City, CA. He then joined Pioneer Automotive Technologies, Inc., in Springboro, OH, as a Senior EMC Engineer. He is currently working as an EMC Specialist with Caterpillar Inc., Peoria, IL. His current research interests are signal integrity, EMC testing, simulation and design. EMC
©2011 IEEE
43
EMI Filter Design Part I: Conducted EMI Generation Mechanism Vuttipon Tarateeraseth, Member, IEEE, Department of Electrical Engineering, Srinakharinwirot University, Thailand. E-mail:
[email protected] Abstract—An electromagnetic interference (EMI) filter design procedure for switched-mode power supplies will be described in three parts: Part I) conducted EMI generation mechanism, Part II) measurement of noise source impedances, and Part III) a selection of passive filter topology for optimal performance. This article is the first part of the three-part series.
1. Introduction Switched-Mode Power Supplies (SMPS) -also known as Switching Power Supplies (SPS) or Isolated DC-DC converters- are of widespread use in modern days because there are significant benefits in reduction of the physical sizes and high efficiency comparing to the linear power supplies [1]. The main function of the SMPS is to convert the AC input power to different level of regulated DC output voltages. Although there are several types of SMPS, all of them can be derived from the three basic
+
–
νL
DC-DC converters namely buck converter, boost converter, and buck-boost converter [2]. The main difference between SMPS and DC-DC converters is that the SMPS uses the high frequency transformer to make an isolation. For the sake of simplicity, to understand why SMPS generate significant noise, the boost converter and its switching waveforms are shown in Fig. 1 for explanation. In order to obtain the required DC output voltage, the semiconductor switch e.g. Metal-Oxide-Semiconductor Field-Effect Transistor (MOSFET) of the boost converter must be switched “ON” and “OFF” by varying its duty-cycle at the switching frequency. Since the boost converter operates under extremely high switching frequency, the fast-transition voltage and current waveforms at the switching devices are resulted, as shown in Fig. 1. These fast-transition voltage and current waveforms are main noise sources and generate a wide spectrum of electromagnetic disturbance (EMD) [3]–[4]. Such electromagnetic noise propagates through the power cord connected to it and can also radiate in open space [5].
T
iD ton
+ Vin
–
+
iC
isw
ii
+
ton toff
– T
toff
ii +
νsw
νO
–
–
imax imin
iD
t
t Fast-Transition Voltage and Current Waveforms Generate the Conducted EMI
isw
t νsw νO Vin t
Fig. 1. Noise Source: switching operation of the converter.
44
©2011 IEEE
Moreover, the cause of EMD is not only the switching operation C ESR ESL of SMPS but also the parasitic eleCapacitors ments of the passive components Cpar such as capacitor, resistor, inductor, transformer and power cord as shown in Fig. 2. In addition, Resistors the parasitic elements also come Llead R from the device leads, printed cirCpar cuit board (PCB) traces, and device installations. For example, a Inductors L Rpar heat sink is usually connected to the body of the MOSFET, which c3 introduces a parasitic capacitance r2 r1 between the MOSFET and the Transformers ls heat sink as shown in Fig. 3. Those n c1 c2 parasitic elements can cause a 2Rp 2Rp 2Lp 2Lp ringing voltage and current superimposed on the original switching waveforms which tend to enhance certain region of the original r /2 Li /2 r /2 Le /2 Li /2 Le /2 Power Cord EMD [6]. The parasitic elements cause a ringing voltage across the switching device, during turn-off ZL cp periods, while the diode reverse Li /2 Li /2 r /2 r /2 recovery causes a ringing current passing through the switching device during turn-on periods, as Fig. 2. Noise Source: parasitic elements of passive components. shown in Fig. 4. Therefore, it can be concluded that it is not only The frequency spectrum contents from 150 kHz to 30 MHz high dv ⁄dt and di ⁄dt during turn-off and turn-on periods having great influence on EMD problems, but the ringing are defined as “conducted electromagnetic disturbance (conducted EMD)” or “conducted electromagnetic interference voltage and current too. The generated EMD might degrade the performance at (conducted EMI)”, as shown in Fig. 6. Typically, the conducted device, equipment, or system level, either because the apparatus is powered by the same commercial power system and/or its location is very close to the power supply. If the performance of a device, an equipment, or a system is degraded by EMD, we commonly talk of electromagnetic interference (EMI). To meet the EMC requirements, the EMD must be classified and analyzed because different EMC solutions are apMOSFET plicable to different frequency ranges. The EMD generated by any power electronic systems can be classified by frequency spectrum contents as shown in Fig. 5. The frequenCp cy spectrum contents from the power frequency (50 Hz Heat Sink or 60 Hz) to 2 kHz is defined as “harmonics” which can Llead G strongly distort the input current and voltage waveforms 2 / of the systems; in other words, it can decrease the power L 2 2 factor of the system and degrade the “quality” of power. r/ PC L/ BT 2 c The International Electrotechnical Committee (IEC) has 2 / / rac r L e issued the IEC-1000-3-2 standard to limit the harmonic 2 2 r/ L/ contents of the electrical and electronic appliances. Gener2 r/ ally, to comply with the given standard, there are two approaches: passive power factor correction (passive PFC) and active power factor correction (active PFC) [5]. Practically, PC BB the passive PFC is used for high power applications while oa rd the active PFC is applied for low power applications. Both approaches might be used to counteract the distortion and raise power factor. However, the PFC solutions will not be Fig. 3. Noise Source: parasitic elements of the circuit layout [8]. addressed in this article. ©2011 IEEE
45
Original Waveform + Ringing (Time Domain)
Ringing Voltage
ν, i
Diode Reverse Recovery
be minimized at the design stage if the product is designed based on EMC principles. This subject is out of scope of this article. In this article, the filter design to suppress the conducted EMI generated by a switched-mode power supply (SMPS) will be the main focus.
VSW EMI
iSW
(Frequency Domain)
2. Common-mode and Differential-mode Conducted EMI Generation Mechanisms
Generally, the conducted EMI can be categorized into two conduction modes: the differential mode (DM) emission and common mode (CM) emission as shown in Fig. 6 [9]. The Fig. 4. Noise Source: fast-transition of switching devices. DM current flows out of the live wire and returns via the neutral wire. The CM current takes the live and neutral wires as one outgoing conductor and returns via the ground wire. Hence, the DM curConducted EMD Radiated EMD Harmonics rents in the live and neutral wires are equal in magnitude but opposite in phase, while the CM currents are 50 Hz 2 kHz 150 kHz 1 GHz 30 MHz equal in both magnitude and phase as shown in Fig. 8 (a) and Fig. 9 (a), respectively [10]. Although many different SMPS Fig. 5. Classification of electromagnetic disturbance by frequency [9]. topologies exist as discussed earlier, the flyback converter is preEMI produced by electrical and electronic appliances can be sented as an example of the DM and CM noise coupling minimized if EMC principles are taken into account at the de- paths associated with the SMPS. In the flyback converter, sign stage. However, to ensure that the products can comply as shown in Fig. 8 (b) and Fig. 9 (b), a diode bridge rectiwith the conducted EMI limits, the filtering techniques (pas- fies the ac voltage which is filtered by a bulk capacitor CB sive filtering and/or active filtering) are normally used to sup- producing a dc voltage. The required DC output voltage is press the conducted EMI. The different solutions between the chopped by the MOSFET, which is controlled by the pulse width modulation (PWM) controller. The MOSFET switchPFC and the conducted EMI are illustrated in Fig. 7. The “radiated electromagnetic disturbance (radiated EMD)” es on and off at switching frequency but the duty-cycle is or “radiated electromagnetic interference (radiated EMI)” is varied to regulate the output voltage. Due to the switchfrom frequency above 30 MHz. In this frequency range, the ing operation, the DM and CM noise currents are resultproduct begins to radiate electromagnetic interference in space. ed. The normal operation of the circuit causes a DM noise, Similar to the conducted EMI problem, the radiated EMI can whereas the CM noise results from of the circuit’s parasitic capacitances [7]. Fig. 8 (b) and Fig. 9 (b) show the DM and CM emissions propagating in an off-line flyback converter, respectively. ICM IDM L The objective of the conducted EMI test is to measure the total noise currents generated by the electrical and elecIDM tronic appliances which are powered through a Line Impedance Stabilization Network (LISN). For measurement I I N CM DM Products PRODUCT repeatability, CISPR 16-1 requires a LISN to prevent exICM ternal conducted EMI on the ac mains from contaminating ICM the measurement and to stabilize the ac mains impedances ICM G (line-to-ground and neutral-to-ground) at 50 V over the frequency range 150 kHz–30 MHz [11]. The noise currents across the 50 V instrument, which are the combination of the DM and CM disturbances, are measured as the conducted EMI. The DM noise depends on the equivalent series resistance (ESR) and equivalent series inductance Fig. 6. Conducted EMI emission definition. t
0
Turn-on
46
Conduction
Turn-off
©2011 IEEE
(ESL) of the bulk capacitor (CB); the CM noise, instead, is coupled through the parasitic capacitance (Cp) of the switching devices due to their switching phenomena and transformer interwinding capacitance [7]. The measured total disturbances (combination of the DM and CM noises) at a line-toground and neutral-to-ground ports of a LISN are monitored by a spectrum analyzer as shown in Figs. 8 (b) and 9 (b). Although either DM or CM noise measurements are not required by the EMI regulations, the total noises should be decomposed into the DM noise and the CM noise not only for facilitating the systematic EMI filter design but also for a noise diagnosis purpose. Many noise discrimination techniques have been developed, either by frequency domain measurement [12]–[14] or by time domain measurement [15].
Power Factor Correction
EMI Filter
(IEC 1000-3-2)
(CISPR 22, FCC 15, etc.)
Active Type
Passive Type
Active Type
Passive Type
(Low Power)
(High Power)
(Low Power)
(High Power)
Fig. 7. The different solutions between PFC and conducted EMI.
Chassis IDM ZCIR
3. Why Do We Need EMI Filters? Since SMPS can produce the DM and CM noises in a wide frequency range, to suppress the conducted EMI effectively, the typical conducted EMI characteristic of SMPS must be analyzed. Typical emissions of SMPS, as shown in Fig. 10, are composed of the switching frequency of switching devices which is about 70 kHz–100 kHz [1]. Below 2 MHz, it is dominated by the DM noise. For frequency above 2 MHz, it is mainly contributed by the CM noise, and the self-resonant-frequency (SRF) of the components and PCB layout resonances occur at higher frequency [10]. In order to comply with the conducted EMI regulations, various conducted EMI reduction techniques for SMPS have been proposed [16]–[17]. However, there are virtually no electronic products today that can comply with the conducted EMI emission regulatory requirements without an EMI filter inserted [6]. The EMI filter needs to attenuate both DM and CM noises with good attenuation with reliability. As a result, an EMI filter remains a very important part of SMPS to
VDM
ZLOAD
ZRTN
Chassis Ground (a)
LISN L
CO
50 μH
RL
LP
IDM N
50 μH CB 0.1 μH
0.1 μH
50 Ω
50 Ω
G Spectrum Analyzer VLISN(L-G) VLISN(N-G)
CM/DM Discrimination Network
VDM
(b)
Fig. 8. Conducted EMI conduction modes. (a) DM path; (b) DM path in SMPS. ©2011 IEEE
47
Chassis ICM1 ZCIR
ZLOAD ICM2 ZRTN VCM Chassis Ground (a) CP3
CP2
LISN L
N
CO
50 μH
ICM1
ICM2
50 μH
CP1 CB
0.1 μF
0.1 μF 50 Ω
RL
LP
50 Ω
G Spectrum Analyzer VLISN(L-G) VLISN(N-G)
CM/DM Discrimination Network
VCM
(b)
Fig. 9. Conducted EMI conduction modes. (a) CM path; (b) CM path in SMPS.
2 MHz Switching Frequency 140 dBuV
Component Resonances PCB Layout Resonances
120 dBuV 80 dBuV
CISPR 22 B
60 dBuV 40 dBuV 20 dBuV 0 dBuV 10 kHz
100 kHz
1 MHz
Typically DM Noise Problem
10 MHz
100 MHz
Typically CM Noise Problem
Fig. 10. Typical conducted EMI problem areas of the SMPS [10].
48
©2011 IEEE
suppress the conducted EMI [6]. To prevent the disturbances of SMPS emitting through the ac power line, the EMI filter is always located right at the AC input of SMPS as shown in Figs. 11 (a) and (b). EMI filters can be categorized into three types: active, passive, and hybrid EMI filters [20]–[21]. Although an active EMI filter is an alternative choice to mitigate the conducted EMI with a compact size, it is not extensively used in SMPS because several unsolved limitations still exist. For example, since the operational amplifier bandwidth is limited, the active EMI filter alone is ineffective at high frequency [18]. In addition, for a good attenuation, the types of active EMI filter must be chosen appropriately, i.e. a voltage canceling for a low impedance DM noise source and a current canceling for a high impedance CM noise source [19]. Existing research has demonstrated the benefit of an active EMI filter by integrating it with the passive EMI filter, thus producing a “hybrid EMI filter” [20] –[21]. An active EMI filter is used not only to improve the passive EMI filter performance but also to reduce the size of the passive EMI filter components by replacing large passive components (i.e. common mode chokes) with smaller passive components and some active control circuitry [22]. Unlike an active EMI filter and a hybrid EMI filter, a passive EMI filter is bulky and heavy, but it presents the advantages of suppressing both DM and CM noises with very good attenuation [16]. A passive EMI filter is a superposition of the CM and DM equivalent filters. The CM noise propagating through the parasitic capacitances within the SMPS is eliminated by the CM equivalent filter while the DM equivalent filter suppresses the DM noise which propagates between the line and neutral wires [9], [2]. However, we should point out at the limitations on the maximum inductance of series inductor to prevent the excessive voltage drop and maximum capacitance
AC Input Voltage
EMI Filter
Bridge Rectifier
PFC Front End
Hold-Up-Time Capacitor
DC/DC Output Stage DC Output Voltage
+
–
T
T Error Amp.
Error Amp.
PWM
PWM
Feedback Control (a) DC/DC Output Stage
Optical Coupler Feedback Control
Mag. Amp.
Secondary Rectifier
Signal Board Secondary Filtering
Power MOSFET
DC Output
HF Transformer
Cross-Regulating Inductor
PFC
EMI Filter
AC Input
Hold-Up-Time Capacitors Bridge Rectifier (b)
Fig. 11. Typical SMPS. (a) Block diagram of general SMPS; (b) SMPS prototype [http://www.convectron.com/smps/LambdaSMPS.htm]. of parallel capacitor connected to ground for safety hazard consideration. To meet the conducted EMI limitations, the passive EMI filter is still popular in SMPS design. However, one challenging task is to design the EMI filter effectively, optimally and systematically with a minimum guess. A few papers exist on a systematic design procedure of SMPS EMI filters [23]–[24]. The main difference between the two approaches is that in [23] the noise source and load impedances are taken into account in the EMI filter design procedure, but they are not considered in [24]. Without the noise source and load impedances in the design process, the EMI filter might lead to an overdesign because the filter performance is strongly dependent on
the connecting impedances [25]–[26]. Although reference [23] proposes a systematic EMI filter design procedure, the method to extract the noise source and load impedances is not accurate enough and some a-priori assumptions must be made. Without precise information of the noise source and load impedances, it makes designing EMI filter optimally a difficult task.
Conclusion In this article, we present conducted EMI generation mechanisms and the need of EMI filters. In the second paper, we will present a method to extract the DM and CM impedances of noise source and termination load impedances under actual
©2011 IEEE
49
operating conditions by means of a direct clamping two-probe approach. Finally, in the third paper, a systematic design procedure for single-stage passive power line EMI filters to be used in SMPS applications by applying the insertion loss concept with the accurate amplitude and phase information of the SMPS and LISN impedances will be presented. The effectiveness of the proposed procedure will be validated and demonstrated by various practical design examples.
Acknowledgements The author would like to acknowledge useful suggestions and comments from Assoc. Prof. See Kye Yak and Prof. Flavio G. Canavero on the content of these series of articles.
References [1] Sanjaya Maniktala, Switching Power Supplies A to Z, Newnes, chapter 10, 2006. [2] M. J. Nave, Power Line Filter Design for Switched Mode Power Supplies, New York: Van Nostrand Reinhold, 1991. [3] V. Tarateeraseth, I.A. Maio and F.G. Canavero, “Assessment of equivalent noise source approach for EMI simulations of boost converter,” in Proc. of 20th International Zurich Symposium on Electromagnetic Compatibility, EMC Zurich 2009, pp. 353–356. [4] V. Tarateeraseth, “Simplified Conducted Electromagnetic Interference Prediction for DC-DC Converters,” in 30th International Association of Science and Technology for Development (IASTED) Conference on Modelling, Identification, and Control, Phuket (Thailand), November 24 26, 2010. [5] R. Redl, “Electromagnetic environmental impact of power electronics equipment,” Proc. IEEE, vol. 89, no. 6, pp. 926–938, June 2001. [6] Clayton R. Paul, Introduction to Electromagnetic Compatibility, John Wiley & Sons, second edition, 2006. [7] Henry W. Ott, Electromagnetic Compatibility Engineering, John Wiley & Sons, second edition, 2009. [8] D. Cochrane, ”Passive cancellation of common-mode electromagnetic interference in switching power converters,” M.S. thesis, Dept. of Electr. Eng., Virginia Polytech. Inst. & State Univ., Blacksburg, VA, 2001. [9] L. Tihanyi, Electromagnetic Compatibility in Power Electronics, IEEE Press, 1997. [10] J. C. Fluke, Controlling conducted emission by design, New York: Van Nostrand Reinhold, 1991. [11] Specification for Radio Disturbance and Immunity Measuring Apparatus and Methods Part 1: Radio Disturbance and Immunity Measuring Apparatus, CISPR 16-1, 1999. [12] K. Y. See, “Network for conducted EMI diagnosis,” IEE Electronics Letters, vol. 35, no. 17, pp. 1446–1447, Aug 1999. [13] Y. Zhao and K. Y. See, ”Performance study of CM/DM discrimination network for conducted EMI diagnosis”, Chinese J. Electronics (SCI listed), Oct. 2003, Vol. 12, No. 4, pp. 536–538. [14] S. Wang, F. C. Lee and W. G. Odendaal, “Characterization, evaluation, and design of noise separator for conducted EMI noise diagnosis,” IEEE Trans. Power Electron., vol. 20, no. 4, pp. 974–982, Jul 2005. [15] Yuang-Shung Lee, Yu-Lin Liang, and Ming-Wang Cheng, “Time Domain Measurement System for Conducted EMI and CM/DM Noise Signal Separation,” 2005 International Conference on Power Electronics and Drives System, pp. 1640–1645. [16] K. Mainali and R. Oruganti, “Conducted EMI mitigation techniques for switched-mode power converters: A survey,” IEEE Trans. Power Electron., vol. 25, no. 9, pp. 2344–2356, Sep 2010. [17] V. Tarateeraseth, “Recent Patents on Conducted Electromagnetic Interference Reduction Techniques in Power Electronics,” Journal of
50
Recent Patents on Electrical Engineering (EENG)., Bentham Science Publishers, vol. 4, no. 2, 2011. Available: http://www.bentham.org/eeng/ index.htm [18] W. Chen, X. Yang and Z. Wang, “An active EMI filtering technique for improving passive filter low-frequency performance,” IEEE Trans. Electromagn. Compat., vol. 48, no. 1, pp. 172–177, Feb 2006. [19] W. Chen, W. Zhang, X. Yang, Z. Sheng and Z. Wang, “An experimental study of common- and differential-mode active EMI filter compensation characteristics,” IEEE Trans. Electromagn. Compat., vol. 51, no. 3, pp. 683–691, Aug 2009. [20] J. D. van Wyk and et. al., “Integrating active, passive and EMI-filter functions in power electronics systems : a case study of some technologies,” IEEE Trans. Power Electron., vol. 20, no. 3, pp. 523–536, May 2005. [21] J. Biela and et. al., “Passive and Active Hybrid Integrated EMI Filters,” IEEE Trans. Power Electron., vol. 24, no. 5, pp. 1340–1349, May 2009. [22] P. Cantillon-Murphy, T. C. Neugebauer, C. Brasca and D. J. Perreault, “An active ripple filtering technique for improving common-mode inductor performance,” IEEE Power Electron. Lett., vol. 2, no. 2, pp. 45–50, Jun 2004. [23] S. Ye, W. Eberle and Y.F. Liu, “A novel EMI filter design method for switching power supplies,” IEEE Trans. Power Electron., vol. 19, no. 6, Nov 2004, pp. 1668–1678. [24] F.-Y. Shih and et al., “A procedure for designing EMI filters for AC line applications,” IEEE Trans. Power Electron., vol. 11, no. 1, pp. 170–181, Jan 1996. [25] B. Audone and L. Bolla, “Insertion Loss of Mismatched EMI Suppressors,” IEEE Trans. Electromagn. Compat., vol. 20, no. 3, pp. 384–389, Sep 1978. [26] S. M. Vakil, “A technique for determination of filter insertion loss as a function of arbitrary generator and load impedances,” IEEE Trans. Electromagn. Compat., vol. 20, no. 2, pp. 273–278, Sep 1978.
Biography Vuttipon Tarateeraseth received the B. Eng. (second-class honors) and M. Eng. degree both in electrical engineering from King’s Mongkut Institute of Technology Ladkrabang (KMITL), Thailand, and Ph.D. in electronics and communications engineering from Politecnico di Torino, Italy. Since 2011, he is a lecturer at Department of Electrical Engineering, Srinakharinwirot University, Thailand. From 2010–2011, he was a lecturer at College of Data Storage Innovation, KMITL. Prior to 2007, he worked as a head of environment testing laboratory at Delta Electronics (Thailand) for three years. He also worked as an EMC engineer for 2 years under the Joint Development of Teaching Materials to Improve EMC Skills of Academic Staff and Postgraduate Electronic Designers Project funded by European Commission. He was a lecturer for 2 years at Department of Electrical Engineering, Srinakharinwirot University, Thailand. His research interests are mainly in the fields of EMI reduction techniques, EMC/EMI modeling, EMC instruments and measurements and EMI filter design. He is author or coauthor of more than 40 technical papers published in international journals and conference proceedings and one book chapter. EMC
©2011 IEEE
Extended Ground Pin as ESD Protection on Automatic Document Feeder Door Sensor Keng Kok Khoo, Hewlett Packard (Singapore),
[email protected]
Abstract—To improve ESD immunity, an extended ground pin functioning as an electrostatic discharge (ESD) arrestor is placed near the Automatic Document Feeder (ADF) door sensor of a printer. It diverts ESD away from the ADF sensor and its associated electronic circuitry [1]. Backed by ESD immunity measurement results, it has been demonstrated to be a simple and yet effective ESD solution. With the proposed solution, it eliminates the need of having additional ESD protection components on the sensor’s circuitry.
1. Introduction To meet electromagnetic compatibility (EMC) regulatory requirement, practically all consumer electronics have to meet specific emission and immunity standards. For example, products classified under the Information Technology Equipment (ITE) need to comply with EN55024 immunity requirement [2], that also covers ESD testing in accordance with IEC/EN 61000-4-2 ESD standard [3]. The test points of the product to be subjected to ESD testing are those locations or areas accessible to users under its normal use. Detailed guidelines and definition of test points and surfaces of which to apply the contact or air discharge can be found in the ESD immunity testing standard [3]. With the increasing popularity of multi-function printer with scan, copy, print and fax capabilities, the risk of damage due to ESD increases as user accessible areas under normal use have increased. For examples, user interventions are needed for paper jam removal, supplies replacement and regular maintenance. The areas that are accessible to user can expose the electronics circuit and functional sensor to ESD events. A common part of a printer is the automatic document feeder (ADF) sensor to detect opening and closing of the access door. Therefore, it is always chosen as one of the common test points for ESD compliance testing. It is in the interest of the printer manufacturer to evaluate these user accessible areas for ESD testing so that the final product can
Fig. 1. Example of optical sensor. be designed with higher ESD robustness, which will lead to lower warranty cost. The optical door sensor is one of the most simple and cost effective designs for access door operation detection. Figure 1 shows some typical optical sensors available commercially. For design simplicity, it is usually placed on the outer side of the product, with small opening in the plastic parts allowing a moveable interceptor usually on the case cover to intercept the sensor. This provides the function of detecting if the access door is opened or closed. With such design, the sensor is one of the most vulnerable components subjected to ESD. Component damage due to ESD or not able to comply with regulatory ESD test level could be a potential problem during product testing and development phase. Table 1 show the comparison of ESD risk to the optical sensor for various placement and design methodology. As an example in the ADF door sensing design, a simple and cost effective design will place the sensor on the outer edge of the product; the optical sensor is exposed with a small opening to allow the short extension from the cover to intercept the optical sensor providing signaling for access door opened or door closed. When ESD get close to the sensor, discharge is random without a predetermine path, hardware
TABLE 1. ESD RISK PROFILE FOR VARIOUS DESIGN METHODOLOGY. Sensor design and placement
ESD risk
1. Placed embedded far away from opening, not accessible by user
Low
2. Placed near opening, accessible to user
High
Implementation complexity
ESD Protection
•
High
•
Usually not required
•
Require extra mechanical parts, arms, space etc…
•
Limited or no discharged
•
Little or no mechanical design required
•
Discharge may occur •
Component level protection (diodes, extra grounding etc.)
•
Extra electrical design for signal protection
©2011 IEEE
51
damage can occur if high level of ESD get discharged to the sensor or its circuitry. ESD protection around the optical door sensor and its circuitry can be applied a few ways 1) ESD protection on printed circuit board level. When ESD discharge to the sensor circuit occur, we can use ESD protection components (ESD diode) to protect the sensor circuitry. It is a straight forward method protecting each line with components but it will require extra PCB space and incur additional cost 2) Optical sensor is placed away from opening to create insulation acting as air barrier to prevent discharge. Use the general guide of 1kV/mm air breakdown. Or use non conductive mechanical extension for this application. Some of the disadvantages are a.)Need to create extra space between sensor and door opening. b.) Additional product cost for extra mechanical parts 3) Select an optical sensor with high ESD rating. Available in the market but may not be able to meet design costing for large volume products
ESD Extended Ground Pin
Optical Sensor
Door Sensor Board
Fig. 2. Illustration of the placement and construction of the extended ground pin.
Extended Ground Pin Place Close to Sensor. Grounded to Sensor PCA.
Optical Sensor
Fig. 3. Prototype of extended ground pin placed near to an optical sensor.
52
2. Proposed Solution By placing an extended ground pin as an ESD arrestor near the vicinity of the optical sensor, it creates a dedicated discharge path for the on coming ESD. The ESD arrestor is made of extended jumper pin connected to the digital ground of the Printed Circuit Assembly (PCA). Which in turn it is connected to the chassis ground of the product for best ESD drainage. The pin will be 2–3mm higher than the optical sensor and be placed next to the sensor for optimal protection. A simple PCA routing with wide ground trace or plain can easily accommodate the additional jumper pin on the sensor PCA without interfering with the optical sensor operation with the access door. The extended ground pin will be the highest point of contact on the sensor PCA for the approaching ESD. This created a dedicated discharge path to ground ensuring ESD current is diverted away from the electronics components. The advantage of this solution is its ability to create a dedicated discharge path to ground, withstand high level of ESD without damage and therefore providing ESD protection to the sensor and the PCA. Figure 2 provides a simple illustration of the placement and construction of the extended ground pin on a typical optical sensor PCA. The ITE EN55024 ESD regulatory requirement is 4 kV Contact Discharge and 8 kV Air Discharge, it mandates ITE products to meet Performance Criteria B up to and including those test level/. Detail pass fail criteria for various classes of products can be found in the Annex of the standard [3]. For a typical multifunction printer with scan, copy, print and fax functions, Performance Criteria B within the regulatory test voltage can be interpreted generally as a temporary lost of function and self recoverable after the disturbance is removed. Hardware damage due to ESD will be considered as a test failure. In some cases, some manufacture may conduct ESD testing and evaluation beyond the regulatory voltage. This allows them to make assessment on the product’s ESD margin performance. Testing beyond the regulatory level may also help to improve product ESD reliability and therefore reduce the product warranty cost related to damage cause by ESD. An experiment had been conducted on a typical multifunction printer Automatic Document Feeder (ADF) door sensor with this solution. In this ADF design, with the access door opened, the optical sensor can be seen exposed from a small plastic opening. The opening is required for the top cover to intercept the center of the sensor for electrical signaling of ADF door opened or closed. In this example, the opening is visible and accessible to user and therefore may be subjected to ESD event while under normal use or maintenance. The sensor PCA had been modified to add an extended ground pin. The pin was positioned near to the sensor, not obstructing the interceptor operation and it is the tallest object on the sensor PCA. It was connected to the ground of the PCA which was in turn connected to the product chassis ground. Figure 3 show a photo of the prototype for ESD testing. In a typical multifunction printer construction as shown in Figure 4, the ADF is generally placed at the top of the printer allowing easy access to the ADF. For larger system, metallic chassis provide structural and functional support, stability for faster scanning and printing speed. The system selected for this experiment has a large metallic structure as the chassis base supporting the ADF. The system has a 3-pin power supply with a
©2011 IEEE
ESD
optical sensor or any other electronics components on the PCA. In coming ESD charges are being grounded via the extended ground pin providing ESD protection to the optical sensor. With reference to ESD standard requirement, there was no anomaly found during the test, therefore the product meets the performance criteria requirement for this test point. Discharge and arching to the ground pin is understandably more noticeable as test level increased beyond 8kV (non regulatory requirement for ITE products) and hence able to provide ESD protection beyond just passing the regulatory requirement.
Extended Ground Pin
Door Sensor Board
4. Conclusion Test results had shown that the extended ground pin is extremely successful in attracting and grounding in coming ESD charges to the optical sensor providing very effective ESD protection. As for implementation, hardware requirement is minimal, it does not need a lot of PCB space and it is easier to implement than most other ESD protection methods. Most importantly, it is a low cost and effective solution.
Metallic Chassis
Acknowledgements The author would like to thank the IEEE EMC Society Singapore Chapter committee members for their encouragement. Technical support from the colleagues and coworkers of Hewlett-Packard Networking and Hewlett-Packard Imaging and Printing Group, both in United States and Singapore, is acknowledged. Three Pin Product with Protective Earth Connection
References
Fig.4. A typical multifunction printer with ADF placed on top of a metallic structure. Product’s exterior is usually plastic with industrial design look and feel.
[1] Published in Hewlett-Packard Research Disclosure, Article No 5201027. [2] IEC/EN 55024: 1998. Information technology equipment. Immunity characteristics-Limits and methods of measurement [3] IEC/EN 61000-4-2: 1995. Testing and measurement techniques, Electrostatic discharge immunity test.
Biography Protective Earth (Yellow/Green wire) connection. The extended ground pin was connected to the sensor PCA digital ground which was also grounded to the metallic chassis. This has the advantage of providing good ground return path to the ESD current discharge to the grounded pin.
3. Experimental Results The test (Air Discharge) had been conducted up to 8 kV and the results showed that the extended ground pin was able to repeatedly attract ESD charges without any discharge to the
Keng Kok Khoo received his B. Eng in Electronics and Electrical Engineering from Leeds University, United Kingdom, in 1999 and his M.Sc in Electrical Engineering from the National University of Singapore in 2004. From 1999 to 2008, he was an EMC Engineer for HP Imaging and Printing group responsible for EMC compliance of Inkjet and Laserjet products. He is currently with Hewlett Packard Networking Division focusing on networking switches EMC design. His design expertise and research interests are EMC and signal integrity design. EMC
©2011 IEEE
53