Environmental Microbiology (2008)
doi:10.1111/j.1462-2920.2008.01572.x
How to get more out of molecular fingerprints: practical tools for microbial ecology Massimo Marzorati,1† Lieven Wittebolle,1† Nico Boon,1 Daniele Daffonchio2 and Willy Verstraete1* 1 Laboratory for Microbial Ecology and Technology (LabMET), Gent University, B9000 Gent, Belgium. 2 Dipartimento di Scienze e Tecnologie Alimentari e Microbiologiche, Università degli Studi di Milano, Milan, Italy. Summary Community-level molecular techniques are widely used in comparative microbial ecology to assess the diversity of microbial communities and their response to changing environments. These include among others denaturing and temperature gradient gel electrophoresis (DGGE/TGGE), singlestrand conformation polymorphism (SSCP), length heterogeneity-PCR (LH-PCR), terminal-restriction fragment length polymorphism (tRFLP) and 16S rRNA gene clone libraries. The amount of data derived from these techniques available in literature is continuously increasing and the lack of a universal way to interpret the raw fingerprint itself makes it difficult to compare between different results. Taking the DGGE technique as an example, we propose a settingindependent theoretical interpretation of the DGGE pattern, based on a straightforward processing on three levels of analysis: (i) the range-weighted richness (Rr) reflecting the carrying capacity of the system, (ii) the dynamics (Dy) reflecting the specific rate of species coming to significance, and (iii) functional organization (Fo), defined through a relation between the structure of a microbial community and its functionality. These Rr, Dy and Fo values, each representing a score to describe a microbial community, can be plotted in a 3D graph. The latter represents a visual ecological interpretation of the initial raw fingerprinting pattern.
Received 26 October, 2007; accepted 24 January, 2008. *For correspondence. E-mail
[email protected]; Tel. (+32) 9264 5976; Fax (+32 )9264 6248. †Both authors equally contributed to the work.
Introduction In the past years, the use of molecular tools in microbial molecular ecology to study the diversity and dynamics of microbial communities increased steadily. The fast accumulation of molecular data necessitates new tools to provide interpretation of these data and to give them a predictive power that is of practical value (Prosser et al., 2007). Culture-independent techniques can overcome problems associated with selective cultivation and isolation of bacteria from natural samples, by-passing the so-called ‘great plate count anomaly’ (Staley and Konopka, 1985; Amann et al., 1995). Several techniques have been used including denaturing and temperature gradient gel electrophoresis (DGGE and TGGE), single-strand conformation polymorphism (SSCP), length heterogeneity-PCR (LH-PCR), terminal-restriction fragment length polymorphism (tRFLP) and 16S rRNA gene clone libraries. Among these techniques, DGGE is one of the most wellestablished molecular tools in microbial ecology (Head et al., 1998; Muyzer and Smalla, 1998; Muyzer et al., 1998; Boon et al., 2002 and references in Table 1). This fingerprinting technique is commonly used to provide, on a polyacrylamide gel, a profile representing the genetic structure and diversity of a microbial community from a specific environment, with a high versatility, reliability and reproducibility (Muyzer and Smalla, 1998). Moreover, DGGE fingerprinting can be coupled to statistical analysis and calculation of biodiversity indices [e.g. principal component analysis (PCA), Simpson’s and Shannon–Weaver indices, cluster analysis, etc.] to compare bacterial communities occurring in different environmental samples (van Hannen et al., 1999; Desnues et al., 2007; Li et al., 2007; Webster et al., 2007). Each gel represents a detailed description of a given microbial community in relation to the studied environment. However, it is not easy to compare between the results of different authors in terms of the data available, the different experimental settings and the lack of a common way of interpretation of the fingerprinting patterns. Here, a conceptual interpretation of the 16S rRNA gene molecular fingerprinting pattern (focusing on DGGE) is proposed, based on a straightforward processing through three levels of analysis: range-weighted richness, dynamics and functional organization. This new way of
© 2008 The Authors Journal compilation © 2008 Society for Applied Microbiology and Blackwell Publishing Ltd
2
M. Marzorati et al.
Table 1. Values of range-weighted richness index (Rr) derived from DGGE patterns corresponding to microbial communities of different environments.
Environment
Denaturing gradient
Range No. bands
Insect (Scaphoideus titanus) Vagina NR-SOB in CSTRb
40–60% 30–50% 45–60%
3–5 2–10 4–9
0.3 ⫾ 0.4 2.2 ⫾ 2.9 2.6 ⫾ 1.4
357F-907R 338F-518R 338F-518R
Subgengival plaque Deep-sea hydrothermal site 1,2-DCA-contaminated groundwater Insect gut (Vespula germanica) Oil-contaminated soilc Sulfidogenic anaerobic bioreactord Pharmaceutical activated sludge Artic sea ice Puffer fish ovary Coastal seawater Human colon descendens Compost-packed benzene biofiltere Soil crust of sand dunes Gut of Chinese mitten crab Municipal activated sludge Legumes rizosphere Intertidal sediments Stable nitrifying reactor Garden soil
20–80% 35–38% 30–60% 40–75% 35–80% 20–80% 45–60% 20–70% 30–60% 40–80% 45–60% 40–60% 40–60% 25–55% 50–65% 54–64% 40–50% 45–60% 40–70%
2–6 11–14 3–10 4–7 6–8 7–10 12–17 10–11 11–15 8–20 13–17 9–18 10–13 13–16 18–19 22–34 27–31 24–41 23–32
4.2 ⫾ 3.2 4.6 ⫾ 1.2 4.9 ⫾ 4.4 5.6 ⫾ 2.4 8.1 ⫾ 3.2 23 ⫾ 11 25 ⫾ 11 26 ⫾ 3 29 ⫾ 14 31 ⫾ 23 39 ⫾ 9 40 ⫾ 16 42 ⫾ 17 50 ⫾ 17 57 ⫾ 11 78 ⫾ 30 129 ⫾ 18 145 ⫾ 59 220 ⫾ 63
357F-907R 341F-907R 357F-907R 27F-519R 1070F-1392R 357F-907R 338F-518R 357F-907R 338F-518R 358F-907R 338F-518R 357F-907R 357F-907R 338F-518R 338F-518R 984F-1378R 338F-518R 338F-518R 338F-518R
Rr
a
Primers
Reference Marzorati et al. (2006a) Vitali et al. (2007) (B. De Gusseme, P. De Schryver, M. De Cooman, K. Verbeken, P. Boeckx, W. Verstraete and N. Boon, submitted) Fujimoto et al. (2003) Postec et al. (2005) Marzorati et al. (2006b) Reeson et al. (2003) Hamamura et al. (2006) Dar et al. (2007) Wittebolle et al. (2005) Brakstad et al. (2007) Yang et al. (2007) Alonso-Saez et al. (2007) Van de Wiele et al. (2004) Borin et al. (2006) Smith et al. (2004) Li et al. (2007) Boon et al. (2003) Sharma et al. (2005) Plante and Wilde (2004) Wittebolle et al. (2008) Edenborn and Sexstone (2007)
a. The Rr value is reported as an average ⫾ standard deviation of the samples analysed in the reference paper. b. Consortium of nitrate-reducing, sulfide-oxidizing bacteria in a continuously stirred tank reactor. c. Clay soil with 5.7% of organic C. d. Expanded bed reactor with mineral medium with Na2SO4 and UASB from fibre-producing chemical industry with Na2SO4. Ethanol as electron donor. e. With volumetric benzene loads ranging from 2.4 to 24.8 g m-3 PM h-1 (PM = packed material). For each example is reported the denaturing gradient, the number of bands, the primers used, the Rr value, and the relative reference.
interpretation is independent both of the technique used and of the settings of the technique itself (e.g. denaturing gradient, voltage, etc.) and provides an ecological and predictive value to the analysis of the structure and diversity of a microbial community in a given environment. Range-weighted richness (Rr) Denaturing gradient gel electrophoresis patterns are commonly obtained in a polyacrylamide gel with denaturing conditions provided by urea and formamide. Polymerase chain reaction (PCR)-obtained double-strand DNA fragments are subjected to an increasing denaturing environment and partially melt in discrete regions called ‘melting domains’ creating molecules with a reduced mobility (Muyzer et al., 1998). This behaviour is correlated to the base pair composition of the sequence (guanine + cytosine content) and also to the positioning of the GC stretches within the molecule. Several authors showed that the per cent GC content can be used to study the diversity and the shifting of a microbial community, even if there is no direct taxonomical correlation (Torsvik et al., 1990; Ovreås et al., 1998; Nüsslein and Tiedje, 1999;
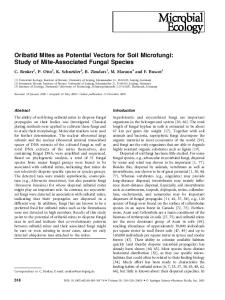
Apajalahti et al., 2001). Besides, the GC content of complex microbial communities seems to be influenced by the environment itself (Foerstner et al., 2005). Figure 1A reports some possible DGGE patterns, on a standard 40–60% denaturing gradient that can be obtained by the analysis of microbial communities in different environments. The type of pattern can be summarized by the percentage of the gel (denaturing percentage length within a lane) that is covered by the fingerprinting itself (Fig. 1A). So, it is possible to have a low coverage as in the first three lanes, a medium coverage (lanes 4, 5 and 6) or a complete coverage as in lane 7 (Fig. 1A). This distribution of bands can be correlated with the percentage of denaturing gradient of the gel that is needed to represent the total diversity of the sample (within the limit of the technique – refer to Drawbacks of the analysis of molecular fingerprints), and then, it can be correlated with the characteristics of the environment analysed. In fact, if an environment is very habitable, it can host a lot of different microorganisms and genetic variability and hence, a wider gradient would be needed to describe the total microbial diversity. On the other side, if the environment is adverse or exclusive, fewer microorganisms will be part of the microbial community and hence a narrower
© 2008 The Authors Journal compilation © 2008 Society for Applied Microbiology and Blackwell Publishing Ltd, Environmental Microbiology
Practical tools for microbial ecology 3 Fig. 1. A. Theoretical DGGE patterns on a polyacrylamide 40–60% urea and formamide denaturant gradient. Lanes 1–3 represent a low Rr; lanes 4–6, a medium Rr; lane 7, a high one. B. Theoretical DGGE patterns on a polyacrylamide 35–40% and 20–80% urea and formamide denaturant gradient. Lanes 1* and 2* represent a low Rr, while lane 3* is characterized by a medium Rr. Thin lines share the gel in discrete portions of 5% of denaturant gradient.
denaturing gradient will be used to describe the total diversity. The possible per cent GC content in bacterial 16S rRNA genes ranges approximately from 45% to 65%. Thus, the broader the carrying capacity of an environment is (the number of individuals that the resources of an environment can support), the higher is the probability it can host a high number of bands with a wide GC variability (both in terms of percentage and in terms of positioning of the GC stretches within the 16S rRNA gene). This concept can be mathematically expressed by defining an index for the range-weighted richness (Rr). Rr is the total number of bands multiplied by the percentage of denaturing gradient needed to describe the total diversity of the sample analysed, according to the following formula (1):
Rr = (N 2 × Dg )
(1)
where N represents the total number of bands in the pattern, and Dg the denaturing gradient comprised between the first and the last band of the pattern. So, the Rr for lanes 1, 2 and 3 (Fig. 1A) has an identical value of 1.8 (6 bands ¥ 0.05, corresponding to a single 5% portion of denaturing gradient comprised between the first and the last band of the pattern). The Rr value for lanes 4, 5, 6 and 7 will be 12.5, 18.1, 13.8 and 54.9 respectively. The results of the range-weighted richness index calculations, which are independent of the used denaturing gradient in different gels, can be compared, as shown in Fig. 1B. Here, the Rr for lane 1 is 2.4 (the entire gel already represents a single portion of 5% denaturing gradient), while for lanes 2 and 3 (Fig. 1B) the values are 3.0 and 18.72 respectively. Table 1 reports some values of range-weighted richness indices derived from literature. From this short overview, it is empirically possible to establish a range of values – technique specific – to define the range-weighted richness of a given environment and hence of its autochthonous microbial community. Based on DGGE, Rr < 10 can be attributed to environments particularly adverse or restricted to colonization such as a contaminated soil or a
deep-sea hydrothermal vent ecosystem; they are characterized by a low range-weighted richness. Values intermediate between 10 and 30 can be correlated with a medium range-weighted richness, while a Rr > 30 is typical of very habitable environments (with broad carrying capacity), characterized by a high microbial diversity (activated sludge, garden soil, rhizosphere . . .) with a high rangeweighted richness. Dynamics (Dy) A second parameter that can be estimated based on further processing of DGGE patterns is the ‘dynamics’ of a microbial community. This concept can be interpreted as the number of species that on average come to significant dominance (above the detection limit of the technique) at a given habitat, during a defined time interval. The more species that happen to arrive – per unit of time and in proportion to the number already detected – the more the original microbial community may change, and thus the more dynamic the community can be. In literature, dynamics of bacterial communities have been reported even for periods of stable performance of microbial processes (Fernandez et al., 1999; Miura et al., 2007). To demonstrate this, a variety of comparison tools has been applied: visual inspection (Lozada et al., 2006), cluster analysis (Seghers et al., 2003), the Dice index (La Para et al., 2002), non-metric multidimensional scaling (van Hannen et al., 1999) and moving window analysis (Wittebolle et al., 2005). Comparison between results of different studies is at present not possible because of the lack of a universal comparison tool. However, based on moving window analysis, the rate of change (Dt) parameter can be calculated as explained below. This parameter can be a tool to fill this lacuna, by providing an unambiguous numerical measure. The rate of change parameter averages the degree of change between consecutive DGGE profiles of the same community over a fixed time interval. With DGGE gel
© 2008 The Authors Journal compilation © 2008 Society for Applied Microbiology and Blackwell Publishing Ltd, Environmental Microbiology
4
M. Marzorati et al.
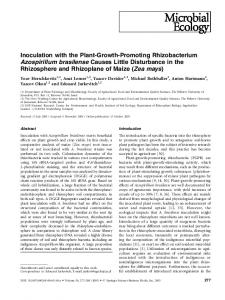
Fig. 2. Denaturing gradient gel electrophoresis (DGGE) profiles, moving window analyses (MWA) and rate of change (Dt) values to evaluate the level of dynamics of betaproteobacterial ammionium oxidizers. A. A low Dy as observed in a full-scale wastewater treatment plant (Wittebolle et al., 2005). B. A medium Dy as observed in a nitrifying sequential batch reactor (Wittebolle et al., 2008) C. A high Dy as observed in nitrifying membrane bioreactor (Wittebolle et al., 2008).
processing software a matrix of similarities for the densiometric curves of the DGGE patterns is calculated based on the Pearson product-moment correlation coefficients. Based on formula (2), these similarity percentage values can be recalculated to percentage of change values.
%change = 100 − %similarity
(2)
The %change value matrix is used to perform moving window analysis by plotting the values between consecutive sampling points (e.g. day X and day X - 7). Consecutively, the rate of change (Dt) value can be calculated as the average of the respective moving window curve data points. The higher the changes between the DGGE profiles of two consecutive sampling points, the higher the corresponding moving window curve data point will be, and hence, the higher the Dt values. Figure 2 provides some examples of DGGE profiles, respective corresponding moving window analysis curves and their calculated rate of change (Dt) values. In a recent study on ammonia-oxidizing bacterial (AOB) communities of full-scale wastewater treatment reactors, rate of change values as low as 3% could be observed during periods of stable operation (Fig. 2A; Wittebolle et al., 2005). Regarding their dynamics, these communities are speculated to be very closed, restricting the dominance of other species (low Dy). In another study performed on two different types of nitrifying reactors, the
rate of change parameter was applied to monitor weekly changes of bacterial communities (Wittebolle et al., 2008). The first reactor maintained complete nitrification during the whole sampling period. Its AOB community had a weekly rate of change (Dt(week)) of 12.6 ⫾ 5.2% on 16S rRNA gene level (Fig. 2B). This means that the AOB DGGE profile of the nitrifying reactor changed on average about 13% during consecutive weeks. This situation is assumed to represent a medium level of dynamics: new species are able to enter the bacterial community, but without interfering with the functionality of the system, i.e. ammonia oxidation. The second reactor monitored in the aforementioned study, suffered from incomplete nitrification as evidenced by a nitrite build-up. It was observed that the weekly AOB rate of change for this reactor was around 25% (Fig. 2C). Here, the Dy level is high: a lot of species come to dominance and leave the bacterial community resulting in broad dynamics, probably causing loss of overall coherence. It should be noted that weekly time intervals may not be suitable for monitoring a slow-growing microbial community, e.g. deep-sea anaerobic methane-oxidizing Archaea that have doubling times around 6 months (Nauhaus et al., 2007). In these environments not much alteration can be expected on weekly basis. Therefore, it is suggested to define the proper rate of change values – if they
© 2008 The Authors Journal compilation © 2008 Society for Applied Microbiology and Blackwell Publishing Ltd, Environmental Microbiology
Practical tools for microbial ecology 5 sensibly diverge from the default week time frame – according to the environment studied. Functional organization (Fo) A third parameter, which is recommended in complementation with the two previous ones to score bacterial communities based on DGGE analysis, is the functional organization. This organization is the result of the action of the microorganisms that are most fitting to the ongoing environmental–microbiological interactions. For this reason, they tend to become dominant within the structure of the microbial community. In order to graphically represent the structure of a bacterial community (species distribution), Pareto–Lorenz (PL) evenness curves (Lorenz, 1905) can be constructed based on the DGGE profiles as previously described (Mertens et al., 2005; Wittebolle et al., 2008). As represented in Fig. S1, for each DGGE lane, the respective bands are ranked from high to low, based on their intensities. Subsequently, the cumulative normalized number of bands is used as x-axis, and their respective cumulative normalized intensities represent the y-axis. The more the PL curve deviates from the 45° diagonal (the theoretical perfect evenness line), the less evenness can be observed in the structure of the studied community. The latter means that a smaller fraction of the different species is present in dominant numbers. These curves have already been related to the functionality of specific microbial communities (Dejonghe et al., 2001; Mertens et al., 2005; Wittebolle et al., 2008). To address the issue of the relation between functionality and community structure, Fernandez and colleagues (2000) observed the behaviour of different microbial communities under perturbed conditions. They concluded that stability of the functionality does not necessarily imply stability of community structures. It has been suggested that the conservation of a given functionality is ensured by the flexibility of a microbial community with minority community members that may become dominant in a short period following a significant perturbation. This condition assures a fast recovery from a stress condition due to the presence of functional redundancy and alternative ways to use the flow of energy (Fernandez et al., 2000). Hence, it is possible to define the Fo as the ability of the community to organize in an adequate distribution of dominant microorganisms and resilient ones, condition that should assure the potentiality of counteracting the effect of a sudden stress exposure. Figure 3 gives a representation of three possible PL curves. To numerically interpret the PL curves, it was suggested to score the y-axis projection of their respective intercepts with the vertical 20% x-axis line (Wittebolle et al., 2008). In this example, they are further referred to
Fig. 3. Pareto–Lorenz curves derived from three hypothetical DGGE patterns. The 25%, the 45% and the 80% curves refer to a low, medium and high functional organization respectively. The 45° diagonal represents the perfect evenness of a community.
as the 25%, the 45% and the 80% curve, based on the y-axis projection of their respective intercepts with the 20% x-axis line. The interpretation of these curves is based on the assumption that the distribution of species within a microbial community relates to the capacity to optimize and conserve functionality even under perturbed conditions. In ecological terms, the 25% PL curve represents a community with high evenness. Such a community may result from a lack of selective pressure and it does not present a well-defined internal structure in terms of species dominance. Because there are no species present at high concentrations, a relatively long lag phase could be needed to counteract a sudden stress exposure. Therefore, this community is assumed to have an ‘on average’ low functional organization. The 45% PL curve and the area around it represent communities with lower evenness compared with the previous ones. Here, the most fitting species are dominant and present in high numbers while the majority (the remaining 80% on the x-axis) is present in decreasing lower amounts. Due to the elevated concentration of some species and the availability of many others, the community can potentially deal with changing environmental conditions and preserve its functionality. Therefore it can be seen as a balanced community with medium Fo. Finally, the 80% PL curve represents a specialized community in which a small amount of the species is dominant and all the others are present in low numbers, with a large difference between the two groups. This community can be highly functionally organized (high Fo) but is fragile to external changes because disruption may require longer recovery times. Some examples of PL curves from natural environments are reported in Fig. S2.
© 2008 The Authors Journal compilation © 2008 Society for Applied Microbiology and Blackwell Publishing Ltd, Environmental Microbiology
6
M. Marzorati et al.
Table 2. Suggested outlines to calculate Rr, Dy and Fo using molecular techniques other than DGGE. Technique
Rr
LH-PCRa
Number of peaks ¥ a valueb representing the fraction of gel in the capillary needed to describe the total diversity tRFLPa Number of peaks ¥ a value representing the fraction of gel in the capillary needed to describe the total diversity TGGE (Number of bands)2 ¥ Tg, the temperature gradient comprised between the first and the last band of the patternc d SSCP (Number of bands or peaks)2 ¥ a value representing the fraction of gel needed to describe the total diversity Clone Libraries Number of independent OTUs ¥ the number of clones needed to reach the plateau of the rarefaction curve
Dy
Fo
Cumulative proportion of species (independent peaks) used as x-axis, and their respective cumulative proportions of abundances on the y-axis Cumulative proportion of independent Moving window analysis and the rate of peaks used as x-axis, and their change parameter applied to the respective cumulative proportions of electropherograms peaks abundances on the y-axis Cumulative proportion of species Moving window analysis and the rate of (independent bands) used as x-axis, change parameter applied to the and their respective cumulative pattern of bands proportions of abundances on the y-axis Cumulative proportion of species Moving window analysis and the rate of (independent bands) used as x-axis, change parameter applied to the and their respective cumulative pattern of bands/ electropherograms proportions of abundances on the y-axis peaks Cumulative proportion of species (OTUs Moving window analysis and the rate of associated to the screened clones) used change parameter applied to the clone as x-axis, and their respective variation in terms of species and cumulative proportions of abundances number on the y-axis Moving window analysis and the rate of change parameter applied to the electropherograms peaks
a. The technique provides as a final result an electropherogram after a run on capillary electrophoresis. b. This value could be: (Lp – Sp)/100, where Lp is the longest peak in terms of bp, while Sp is the shortest one. A not exhaustive table on variability of the first two variable regions (V1V2) of 16S rRNA gene is reported (Table S1): the richer is the environment, the higher is the probability it can host a high number of species with a wide V1V2 length variability. c. Same principle of the DGGE. d. Polymerase chain reaction product can be run both on non-denaturing polyacrylamide gel and on capillary electrophoresis.
Applicability of the approach to other molecular techniques The proposed approach can also be extended to the analysis of the results of other commonly used molecular techniques based on 16S rRNA gene analysis, such as LH-PCR (Brusetti et al., 2006), tRFLP (Collins et al., 2006), TGGE (Muyzer and Smalla, 1998), SSCP (Schwieger and Tebbe, 1998) or clone libraries (Collins et al., 2006), providing in this way a new tool to ecologically compare microbial communities analysed by different means. Recently, Smalla and colleagues (2007) showed that, although the amplified PCR fragments comprised different variable regions and lengths, DGGE, tRFLP and SSCP analyses led to similar findings in terms of clustering of the fingerprints and replicates variability. Table 2 summarizes some suggested outlines to calculate the range-weighted richness, dynamics and functional organization using LH-PCR, TGGE, tRFLP, SSCP and clone library techniques. As an example, the three parameters have been calculated to analyse the results of a LH-PCR survey to monitor lactic acid bacteria succession during maize ensiling, in optimal and spoilage-simulating conditions (high per cent of oxygen and humidity) (Brusetti et al., 2006). A comparison can be conducted between the microbial communities of the two silages after 13 days of fermentation. The ‘good’ silage was characterized by a spectrum of lactic acid bacteria giving rise to a range-weighted richness index of 15.2 (high Rr), while the value decreased to 3.4 in
the spoiled silage, where Enterobacter sp. dominated (low Rr). The dynamics resulted to be high for both systems with a weekly rate of change of 53.0 ⫾ 3.0% and 35.6 ⫾ 1.1% for the microbial community of the ‘good’ silage and in the spoiled one respectively. Finally, the functional organization was different: medium for the good silage and high for the spoiled one (Fig. S3). If widely used, this interpretation of molecular fingerprinting patterns could result in a useful tool for comparing different studies in the microbial ecology field. Drawbacks of the analysis of molecular fingerprints The development of molecular fingerprinting techniques allowed to address a central problem in microbial ecology: to estimate the real diversity of a given environment considering that only a small proportion (0.1–10%) of the bacteria can be visualized by direct count procedures. Nevertheless, there are some drawbacks associated to these techniques that must be taken into account to provide a valuable interpretation of the results (Head et al., 1998). A major limitation is related to sampling and recovery of nucleic acids from environmental samples: the choice of the DNA extraction method (balancing between cell lysis, nucleic acid yield and removal of inhibitory compounds) significantly influences the generated bacterial community profiles, in terms of detected ribotypes (Carrigg et al., 2007). Selectivity in PCR amplification of 16S rRNA genes
© 2008 The Authors Journal compilation © 2008 Society for Applied Microbiology and Blackwell Publishing Ltd, Environmental Microbiology
Practical tools for microbial ecology 7 is another source of bias that can affect the results of molecular measures of diversity (Head et al., 1998). Small differences in the sequence of conserved regions may result in selective amplification of some sequences, also considering that the claimed universality of the commonly used primers is not absolute (Ben-Dov et al., 2006). The resolution of the nowadays-used techniques is normally not satisfactory to describe the full microbial diversity of complex environments (Smalla et al., 2007). For DGGE, the number and intensity of bands in a gel do not necessarily give an accurate picture of the microbial community due to the fact that one organism may produce more than one band because of multiple, heterogeneous rRNA operons (the copy number of rRNA genes within the genomes of different organisms can range from 1 to 14; Head et al., 1998). Moreover, partial 16S rRNA gene sequences do not always allow discrimination between species and one band may represent two or more species with identical partial sequence. Also, in a mixture of target 16S rRNA genes present at very different concentrations, the less abundant sequences are not amplified sufficiently to be visualized as bands on a DGGE gel (the detection limit of the technique is 1% of the total DNA). It is also reported that heteroduplexes, originating from the recombination of single complementary strands derived from different sources, and normally generated during the last cycles of PCR, do not migrate as far as the wild-type fragments because they ‘melt’ at different temperatures, altering the reliability of the pattern. Finally, the application of group-specific primers for the analysis of natural microbial communities could be biased by the fact that the prediction of their specificity relies on the available cultured isolates and on known sequences in the database, which may not adequately reflect the entire pool of 16S rRNA gene sequences in nature (Muyzer and Smalla, 1998; Boon et al., 2002). Kisand and Wikner (2003) suggested that the limited resolution of DGGE caused by melting properties and closely related DNA sequences can be overcome with a careful selection of primers and a clear focus on a certain phylum to achieve the desired resolution for investigations on the species level. Janse and colleagues (2004) showed that the observations of artefactual ‘double bands’, which leads to an overestimation of the actual diversity, can be minimized with the application of a final PCR elongation step up to 30 min. Similar drawbacks can also be associated with other commonly used molecular fingerprinting techniques. Finally, an evaluation of the results significance based on environmental and methodological replicates is always advisable. Because of these shortcomings, inherent to all molecular techniques, the parameters calculated from the fingerprints must be interpreted as an indication and not an absolute measure of the degree of diversity in a bacterial community.
Fig. 4. A. Examples of four final scores (E1–E4) derived from the analysis based on the levels of interpretation of the DGGE pattern. B. Final 3D plot of processing of a DGGE pattern to compare different samples. The positioning of each sphere in the plot refers to a different ecological meaning and adaptation of the microbial community to the environment. The grey rectangular parallelepiped represents the zone where – conceptually – the parameters ranges are conceived to offer chances for sustainability of the microbial communities. Green spheres are inside the parallelepiped while the red ones are outside. C. Visualization of the 3D graph in a 2D plot with the projection of the Rr values within the Fo–Dy matrix. The green rectangle corresponds to the base of the parallelepiped in (B). Table and axes rank: low (L), medium (M), high (H) for the range-weighted richness (Rr), dynamics (Dy) and functional organization (Fo).
Ecological interpretation The three levels of analysis of theoretical pragmatic processing of a DGGE pattern can be expressed by means of an easily interpretable rank: low, medium and high. It is thus possible to summarize these qualitative–quantitative values in a final score, as reported in Fig. 4A, and to provide an ecological interpretation. As an example, E1 refers to the case of a microbial community in an environment with a medium carrying capacity, a low turnover in terms of species composition
© 2008 The Authors Journal compilation © 2008 Society for Applied Microbiology and Blackwell Publishing Ltd, Environmental Microbiology
8
M. Marzorati et al.
and low functional organization. It could be the representation of an almost frozen soil with low water activity and low level of interaction between microbes (Rivkina et al., 2000). Example E2 could refer to the microbial community of a sewerage canal system which has a high richness in species due to a variety of nutritional and physical potentialities. Being subjected to several external influxes, it is very dynamic and it has a poor functional organization. Example E3 represents the total microbial community of an environment with a strong carrying capacity; this community is stable in terms of species composition and has developed some dominant species and many resilient ones, thus normally achieving good functionality. An example can be activated sludge of large waste water treatment plants, as discussed in Dynamics (Dy) (Wittebolle et al., 2005). Finally, example E4 refers to an intriguing ecological situation: microbial communities that are rich in species, evolve quite well in terms of species composition and perform in an excellent way. Yet, these communities can nevertheless be fragile to disruption. Boon and colleagues (2003) provided an example for this situation analysing the dynamics of a nitrifying community against a 3-chloroaniline shock load: the dominant species were not able to withstand the applied stress and this resulted in the collapse of nitrification. To easily compare the results of the analyses on a high number of samples, the single scores can be plotted in a 3D graph (Fig. 4B). Here, the spatial positioning of each sphere refers to a different ecological meaning and adaptation of the relative microbial community to the environment. Samples grouping together are indicative of microbial communities with similar structures, dynamics and ability to organize their functionality (also in terms of stress resistance). Conceptually, the more the community scores in low to medium ranges for dynamics, and medium level for functional organization, the more it is supposed to be equipped for being sustainable. In fact, such levels ensure a slow to moderate succession from one functional community to a new functional one. The range-weighted richness, as discussed in Rangeweighted richness (Rr), is conceived to be related to the carrying capacity of the environment. To provide more examples of interpretation, it is possible to refer to some environments reported in Table 1. Within the sector of medium functional organization, deep-sea hydrothermal ecosystems (Postec et al., 2005) could be fitting examples for a microbial community positioned such as the sphere A (Fig. 4B). They represent a rather exclusive environment, where a few species can survive in a situation of isolation and in a highly specialized way. Sphere B represents the situation during a bioaugmentation treatment of a contaminated soil: the bioaugmented strain gradually takes advantage of the
improved environmental conditions to bring about a functional performance and becomes dominant (in terms of evenness) on the rest of the microbial community (Maes et al., 2006). Finally, sphere C refers to the positioning of the total microbial community of the stable nitrifying reactor reported in Dynamics (Dy) (Fig. 2B; Wittebolle et al., 2008). Spheres LH1 and LH2 represent the microbial communities of silage in optimal and spoiled conditions, respectively, as discussed in Applicability of the approach to other molecular techniques. An alternative way to represent the final comparison of several samples is shown in Fig. 4C, where the same scores of Fig. 4B are plotted. The positioning of the microbial communities is plotted within a Fo–Dy matrix with the projection of the Rr values in a 2D graph. This results in an easier visualization. The interpretation of Fig. 4B and C is identical. It is up to reader to decide the preferred visualization. Conclusive considerations Molecular tools in microbial ecology are used to study the diversity and the dynamics of microbial communities in a specific environment. The resulting fingerprints can be coupled to statistical analysis and various kinds of calculations. Normally, to reflect the ecological differences among microbial communities, without considering any environmental variables, unconstrained ordination methods are applied (Kindt and Coe, 2005). The most common ones are: PCA and broken-stick distribution, principal coordinates analysis (PcoA), non-metric multidimensional scaling (NMS) and correspondence analysis (CA). The ordination methods organize the samples within a 2D or 3D graph so that the distances between them represent their ecological distance. The outcome of these ordination techniques is based on Euclidean or chi-square distances between sites (Kindt and Coe, 2005). Hence, these commonly used means to evaluate the ecological distances between samples are based on measuring of distance matrices that describe the difference in species composition between all pairs of samples within a given data set. Different ecological distance measures have different properties and the best ones must be considered case-by-case. Besides, as it is not possible to observe all the variance in a single graph, the positions of the sample will not completely reflect the exact ranking (Kindt and Coe, 2005). We propose an alternative way to interpret and communicate the results from studies on structural diversity. It allows comparing the work of different authors. Samples that are close together in the final graph are interpreted as being ecologically similar, whereas microbial communities that are far apart are interpreted as containing significant differences. The final geometrical arrangement (3D
© 2008 The Authors Journal compilation © 2008 Society for Applied Microbiology and Blackwell Publishing Ltd, Environmental Microbiology
Practical tools for microbial ecology 9 graph) appears to be the same of an ordination method, but it is based on conceptually different parameters. The values on the three axes are represented by a qualitative quantification of the three degrees of analysis (not a numerical distance between species, as in the ordination methods) and Rr, Dy and Fo have already themselves an intrinsic ecological interpretation related to the environment habitability and the possible functionality of a given microbial community under variable conditions. We looked for alternatives not because of the deficiencies of the actual methods (the description of this point is out of the scope of the article), but to propose a new approach that could fit most of the different molecular analyses. It is a ‘user-friendly’ and evident way of interpretation. A widespread use of this analytical tool and the use of environmental replicates will allow the collection of ‘background’ information that could be used to assess the significance of the positioning of a studied microbial community in the 3D graph and hence, to assign it a predictive value. It has been stated that, for the next decades, the microbial ecologists and environmental microbiologists have to focus on microbial resource management (MRM) to properly manage complex microbial systems. They should address a new mindset based on well-documented concepts, reliable tools and a set of default values (Verstraete, 2007). The proposed analysis on the three levels could represent an initial step to deal with MRM. Acknowledgements This work was supported by the G.O.A. project grant (2003– 2008) of the ‘Ministerie van de Vlaamse Gemeenschap, Bestuur Wetenschappelijk Onderzoek’ (Belgium) and the research was also funded by a PhD grant (No. 43428) of the Institute for the Promotion of Innovation through Science and Technology in Flanders (IWT-Vlaanderen). The work was also supported by Aquafin with the project ‘Development of a quantitative PCR-array for the quantification and monitoring of indicator organisms in activated sludge’. The authors thank J. Sabirova, T. Defoirdt and S. Possemiers for critically reading the manuscript. The support of L. Brusetti and S. Borin for data collection is kindly acknowledged.
References Alonso-Saez, L., Balague, V., Sa, E.L., Sanchez, O., Gonzalez, J.M., Pinhassi, J., et al. (2007) Seasonality in bacterial diversity in north-west Mediterranean coastal waters: assessment through clone libraries, fingerprinting and FISH. FEMS Microbiol Ecol 60: 98–112. Amann, R.I., Ludwig, W., and Schleifer, K.H. (1995) Phylogenetic identification and in situ detection of individual microbial cells without cultivation. Microbiol Rev 59: 143– 169. Apajalahti, J.H.A., Kettunen, A., Bedford, M.R., and Holben, W.E. (2001) Percent G+C profiling accurately reveals
diet-related differences in the gastrointestinal microbial community of broiler chickens. Appl Environ Microbiol 67: 5656–5667. Ben-Dov, E., Shapiro, O.H., Siboni, N., and Kushmaro, A. (2006) Advantage of using inosine at the 3′ termini of 16S rRNA gene universal primers for the study of microbial diversity. Appl Environ Microbiol 72: 6902–6906. Boon, N., De Windt, W., Verstraete, W., and Top, E.M. (2002) Evaluation of nested PCR-DGGE (denaturing gradient gel electrophoresis) with group-specific 16S rRNA primers for the analysis of bacterial communities from different wastewater treatment plants. FEMS Microbiol Ecol 39: 101–112. Boon, N., Top, E.M., Verstraete, W., and Siciliano, S.D. (2003) Bioaugmentation as a tool to protect the structure and function of an activated-sludge microbial community against a 3-chloroaniline shock load. Appl Environ Microbiol 69: 1511–1520. Borin, S., Marzorati, M., Cavalca, L., Sorlini, C., Daffonchio, D., Zilli, M., et al. (2006) Diversity of the microflora of a compost-packed biofilter treating benzene-contaminated air. Biodegradation 17: 79–89. Brakstad, O.G., Nonstad, I., Faksness, L., and Brandvik, P.J. (2007) Responses of microbial communities in arctic sea ice after contamination by crude petroleum oil. Microb Ecol. doi:10.1007/s00248-007-9299-x. Brusetti, L., Borin, S., Mora, D., Rizzi, A., Raddadi, N., Sorlini, C., and Daffonchio, D. (2006) Usefulness of length heterogeneity-PCR for monitoring lactic acid bacteria succession during maize ensiling. FEMS Microbiol Ecol 56: 154–164. Carrigg, C., Rice, O., Kavanagh, S., Collins, G., and O’Flaherty, V. (2007) DNA extraction method affects microbial community profiles from soils and sediment. Appl Microbiol Biotechnol 77: 955–964. Collins, G., Kavanagh, S., McHugh, S., Connaughton, S., Kearney, A., Rice, O., Carrigg, C., et al. (2006) Accessing the black box of microbial diversity and ecophysiology: recent advances through polyphasic experiments. J Environ Sci Health Tox Hazard Subst Environ Eng 41: 897–922. Dar, S.A., Yao, L., van Dongen, U., Kuenen, J.G., and Muyzer, G. (2007) Analysis of diversity and activity of sulfate-reducing bacterial communities in sulfidogenic bioreactors using 16S rRNA and dsrB genes as molecular markers. Appl Environ Microbiol 73: 594–604. Dejonghe, W., Boon, N., Seghers, D., Top, E.M., and Verstraete, W. (2001) Bioaugmentation of soils by increasing microbial richness: missing links. Environ Microbiol 3: 649– 657. Desnues, C., Michotey, V.D., Wieland, A., Zhizang, C., Fourcans, A., Duran, R., and Bonin, P.C. (2007) Seasonal and diel distributions of denitrifying and bacterial communities in a hypersaline microbial mat (Camargue, France). Water Res 41: 3407–3419. Edenborn, S.L., and Sexstone, A.J. (2007) DGGE fingerprinting of culturable soil bacterial communities complements culture-independent analyses. Soil Biol Biochem 39: 1570–1579. Fernandez, A.S., Hashsham, S.A., Dollhopf, S.L., Raskin, L., Glagoleva, O., Dazzo, F.B., et al. (2000) Flexible community structure correlates with stable community function
© 2008 The Authors Journal compilation © 2008 Society for Applied Microbiology and Blackwell Publishing Ltd, Environmental Microbiology
10 M. Marzorati et al. in methanogenic bioreactor communities perturbed by glucose. Appl Environ Microbiol 66: 4058–4067. Fernandez, A., Huang, S.Y., Seston, S., Xing, J., Hickey, R., Criddle, C., and Tiedje, J. (1999) How stable is stable? Function versus community composition. Appl Environ Microbiol 65: 3697–3704. Foerstner, K.U., von Mering, C., Hooper, S.D., and Bork, P. (2005) Environments shape the nucleotide composition of genomes. EMBO Rep 6: 1208–1213. Fujimoto, C., Maeda, H., Kokeguchi, S., Takashiba, S., Nishimura, F., Arai, H., et al. (2003) Application of denaturing gradient gel electrophoresis (DGGE) to the analysis of microbial communities of subgingival plaque. J Periodont Res 38: 440–445. Hamamura, N., Olson, S.H., Ward, D.M., and Inskeep, W.P. (2006) Microbial population dynamics associated with crude-oil biodegradation in diverse soils. Appl Environ Microbiol 72: 6316–6324. van Hannen, E.J., Zwart, G., van Agterveld, M.P., Gons, H.J., Ebert, J., and Laanbroek, H.J. (1999) Changes in bacterial and eukaryotic community structure after mass lysis of filamentous cyanobacteria associated with viruses. Appl Environ Microbiol 65: 795–801. Head, I.M., Saunders, J.R., and Pickup, R.W. (1998) Microbial evolution, diversity, and ecology: a decade of ribosomal RNA analysis of uncultivated microorganisms. Microb Ecol 35: 1–21. Janse, I., Bok, J., and Zwart, G. (2004) A simple remedy against artifactual double bands in denaturing gradient gel electrophoresis. J Microbiol Methods 57: 279–281. Kindt, R., and Coe, R. (2005) Tree diversity analysis. A manual and software for common statistical methods for ecological and biodiversity studies. Nairobi, Kenya: World Agroforestry Centre (ICRAF). Kisand, V., and Wikner, J. (2003) Limited resolution of 16S rDNA DGGE caused by melting properties and closely related DNA sequences. J Microbiol Methods 54: 183–191. La Para, T.M., Nakatsu, C.H., Pantea, L.M., and Alleman, J.E. (2002) Stability of the bacterial communities supported by a seven-stage biological process treating pharmaceutical wastewater as revealed by PCR-DGGE. Water Res 36: 638–646. Li, K., Guan, W., Wei, G., Liu, B., Xu, J., Zhao, L., and Zhang, Y. (2007) Phylogenetic analysis of intestinal bacteria in the Chinese mitten crab (Eriocheir sinensis). J Appl Microbiol 103: 675–682. Lorenz, M.O. (1905) Methods of measuring concentration of wealth. J Am Stat Assoc 9: 209–219. Lozada, M., Figuerola, E.L.M., Itria, R.F., and Erijman, L. (2006) Replicability of dominant bacterial populations after long-term surfactant-enrichment in lab-scale activated sludge. Environ Microbiol 8: 625–638. Maes, A., Van Raemdonck, H., Smith, K., Ossieur, W., Lebbe, L., and Verstraete, W. (2006) Transport and activity of Desulfitobacterium dichloroeliminans strain DCA1 during bioaugmentation of 1,2-DCA-contaminated groundwater. Environ Sci Technol 40: 5544–5552. Marzorati, M., Alma, A., Sacchi, L., Pajoro, M., Palermo, S., Brusetti, L., et al. (2006a) A close relative of the novel symbiont ‘Candidatus Cardinium hertigii’ is localized in different organs and tissues of Scaphoideus titanus, the
insect vector of Flavescence dorée in Vitis vinifera. Appl Environ Microbiol 72: 1467–1475. Marzorati, M., Borin, S., Brusetti, L., Daffonchio, D., Marsilli, C., Carpani, G., and de Ferra, F. (2006b) Response of 1,2-dichloroethane-adapted microbial communities to ex-situ biostimulation of polluted groundwater. Biodegradation 17: 41–56. Mertens, B., Boon, N., and Verstraete, W. (2005) Stereospecific effect of hexachlorocyclohexane on activity and structure of soil methanotrophic communities. Environ Microbiol 7: 660–669. Miura, Y., Hiraiwa, M.N., Ito, T., Itonaga, T., Watanabe, Y., and Okabe, S. (2007) Bacterial community structures in MBRs treating municipal wastewater: relationship between community stability and reactor performance. Water Res 41: 627–637. Muyzer, G., Brinkhoff, T., Nubel, U., Santagoeds, C., Schafer, H., and Wawer, C. (1998) Denaturing gradient gel electrophoresis (DGGE) in microbial ecology. Mol Microbiol Ecol Man 3.4.4: 1–27. Muyzer, G., and Smalla, K. (1998) Application of denaturing gradient gel electrophoresis (DGGE) and temperature gradient gel electrophoresis (TGGE) in microbial ecology. Antonie Van Leeuwenhoek 73: 127–141. Nauhaus, K., Albrecht, M., Elvert, M., Boetius, A., and Widdel, F. (2007) In vitro cell growth of marine archaealbacterial consortia during anaerobic oxidation of methane with sulfate. Environ Microbiol 9: 187–196. Nüsslein, K., and Tiedje, J.M. (1999) Soil bacterial community shift correlated with change from forest to pasture vegetation in a tropical soil. Appl Environ Microbiol 65: 3622– 3626. Ovreås, L., Jensen, S., Daae, F.L., and Torsvik, V. (1998) Microbial community changes in a perturbed agricultural soil investigated by molecular and physiological approaches. Appl Environ Microbiol 64: 2739–2742. Plante, C.J., and Wilde, S.B. (2004) Biotic disturbance, recolonization, and early succession of bacterial assemblages in intertidal sediments. Microb Ecol 48: 154–166. Postec, A., Urios, L., Lesongeur, F., Ollivier, B., Querellou, J., and Godfroy, A. (2005) Continuous enrichment culture and molecular monitoring to investigate the microbial diversity of thermophiles inhabiting deep-sea hydrothermal ecosystems. Curr Microbiol 50: 138–144. Prosser, J.I., Bohannan, B.J., Curtis, T.P., Ellis, R.J., Firestone, M.K., Freckleton, R.P., et al. (2007) The role of ecological theory in microbial ecology. Nat Rev Microbiol 5: 384–392. Reeson, A.F., Jankovic, T., Kasper, M.L., Rogers, S., and Austin, A.D. (2003) Application of 16S rDNA-DGGE to examine the microbial ecology associated with a social wasp Vespula germanica. Insect Mol Biology 12: 85–91. Rivkina, E.M., Friedmann, E.I., McKay, C.P., and Gilichinsky, D.A. (2000) Metabolic activity of permafrost bacteria below the freezing point. Appl Environ Microbiol 66: 3230– 3233. Schwieger, F., and Tebbe, C.C. (1998) A new approach to utilize PCR-single strand conformation polymorphism for 16S rRNA gene-based microbial community analysis. Appl Environ Microbiol 64: 4870–4876.
© 2008 The Authors Journal compilation © 2008 Society for Applied Microbiology and Blackwell Publishing Ltd, Environmental Microbiology
Practical tools for microbial ecology 11 Seghers, D., Top, E.M., Reheul, D., Bulcke, R., Boeckx, P., Verstraete, W., and Siciliano, S.D. (2003) Long-term effects of mineral versus organic fertilizers on activity and structure of the methanotrophic community in agricultural soils. Environ Microbiol 5: 867–877. Sharma, S., Aneja, M.K., Mayer, J., Munch, J.C., and Schloter, M. (2005) Characterization of bacterial community structure in rhizosphere soil of grain legumes. Microb Ecol 49: 407–415. Smalla, K., Oros-Sichler, M., Milling, A., Heuer, H., Baumgarte, S., Becker, R., et al. (2007) Bacterial diversity of soils assessed by DGGE, T-RFLP and SSCP fingerprints of PCR-amplified 16S rRNA gene fragments: do the different methods provide similar results? J Microbiol Methods 69: 470–479. Smith, S.M., Abed, R.M.M., and Garcia-Pichel, F. (2004) Biological soil crusts of sand dunes in cape cod national seashore, Massachusetts, USA. Microb Ecol 48: 200– 208. Staley, J.T., and Konopka, A. (1985) Measurement of in situ activities of non-photosynthetic microorganisms in aquatic and terrestrial habitats. Annu Rev Microbiol 39: 321–346. Torsvik, V., Goksøyr, J., and Daae, F.L. (1990) High diversity in DNA of soil bacteria. Appl Environ Microbiol 56: 782– 787. Van de Wiele, T., Boon, N., Possemiers, S., Jacobs, H., and Verstraete, W. (2004) Prebiotic effects of chicory inulin in the simulator of the human intestinal microbial ecosystem. FEMS Microbiol Ecol 51: 143–153. Verstraete, W. (2007) Microbial ecology and environmental biotechnology. ISME J 1: 4–8. Vitali, B., Pugliese, C., Biagi, E., Candela, M., Turroni, S., Bellen, G., et al. (2007) Dynamics of vaginal bacterial communities in women developing bacterial vaginosis, candidiasis, or no infection, analyzed by PCR-Denaturing Gradient Gel Electrophoresis and real-time PCR. Appl Envir Microbiol 73: 5731–5741. Webster, G., Yarram, L., Freese, E., Koster, J., Sass, H., Parkes, R.J., and Weightman, A.J. (2007) Distribution of candidate division JS1 and other Bacteria in tidal sediments of the German Wadden Sea using targeted 16S rRNA gene PCR-DGGE. FEMS Microbiol Ecol 62: 78–79. Wittebolle, L., Boon, N., Vanparys, B., Heylen, K., De Vos, P., and Verstraete, W. (2005) Failure of the ammonia oxidation process in two pharmaceutical wastewater treatment plants is linked to shifts in the bacterial communities. J Appl Microbiol 99: 997–1006. Wittebolle, L., Vervaeren, H., Verstraete, W., and Boon, N. (2008) Quantifying community dynamics of nitrifiers in functionally stable reactors. Appl Environ Microbiol 74: 286–293. Yang, G., Bao, B., Peatman, E., Li, H., Huang, L., and Ren, D. (2007) Analysis of the composition of the bacterial community in puffer fish Takifugu obscurus. Aquaculture 262: 183–191.
Supplementary material The following supplementary material is available for this article online: Table S1. In silico estimated length (bp) of the LH-PCR products of some microbial species. The position is homologous to Escherichia coli SSU rDNA positions 8 through 355. The species are reported in alphabetical order. In this example, the LH-PCR fragment ranges between 314 bp and 392 bp. Fig. S1. Visualization of the five-step process to construct a Pareto–Lorenz (PL) curve starting from a DGGE profile. (i) DGGE gel is analysed with a gel processing software (e.g. Bionumerics software, Applied Maths, Sint-Martens-Latem, Belgium) and an intensity value is assigned to each band. (ii) The respective bands are ranked from high to low, based on their intensities. (iii) The cumulative normalized number of bands is used as x-axis. (iv) Their respective cumulative normalized intensities represent the y-axis. And (v) PL curve is drawn: the curve’s x-axis is equally divided by the number of bands, and the y-axis contains the corresponding cumulative normalized band intensities. To numerically interpret the PL curves, it was suggested to score the y-axis projection of their respective intercepts with the vertical 20% x-axis line. Fig. S2 Pareto–Lorenz curves derived from the analysis of the evenness in some natural environments. The cumulative proportion of OTUs (operational taxonomic units) is used as x-axis, and their respective cumulative proportions of abundances represent the y-axis. The 45° grey diagonal represents the perfect evenness of a community. The dash-dotted line represents the microbial community of a bare ground soil above the Arctic Circle (D. Daffonchio, unpubl. data); dashed line refers to endophytic bacteria associated with the roots of a maize plant (Seghers et al., 2004, Appl Environ Microbiol 70: 1475–1482); the dotted line represents the microbial community of a full-scale pharmaceutical WWTP during good operation (Wittebolle et al., 2005; J Appl Microbiol 99: 997– 1006); and the full black line refers to the microbial community of a groundwater contaminated with chlorinated compounds (M. Marzorati, unpubl. data). Fig. S3 Pareto–Lorenz curves derived from a LH-PCR survey to monitor lactic acid bacteria succession during maize ensiling, in optimal (dash line) and spoilage-simulating conditions (dotted line). The cumulative proportion of OTUs (operational taxonomic units) is used as x-axis, and their respective cumulative proportions of abundances represent the y-axis. The 45° diagonal represents the perfect evenness of a community. This material is available as part of the online article from http://www.blackwell-synergy.com Please note: Blackwell Publishing is not responsible for the content or functionality of any supplementary materials supplied by the authors. Any queries (other than missing material) should be directed to the corresponding author for the article.
© 2008 The Authors Journal compilation © 2008 Society for Applied Microbiology and Blackwell Publishing Ltd, Environmental Microbiology