2016, 5(2): 1628 DOI: 10.1515/ijicte-2016-0006
SOLVING A LINEAR OPTIMIZATION WORD PROBLEMS BY USING GEOGEBRA Pavel Molnár Department of Didactics of Mathematics, Faculty of Science, Pavol Jozef Šafárik University, Jesenná 5, Košice, Slovakia
[email protected]
Abstract Today's modern age is characterized by the rapid development of information and communication technologies, which is also reflected in the educational process. It is therefore necessary to prepare the young generation of even at primary and secondary schools to solve problems from real life. Using the appropriate motivation, innovative methods and application of modern information and communication technologies into the teaching process, we can succeed. Constructions created using by dynamic geometry systems bring new opportunities to learning. The aim of this article is to introduce the possibility of using GeoGebra in graphics solution of system of linear inequalities and also in the geometric interpretation of solutions to word problems leading to the linear optimization. The article describes the observations of experimental teaching, where was used GeoGebra. The experimental teaching was conducted at a grammar school in Košice. GeoGebra offers suitable tools to create graphical models in solving the optimization problems. Keywords GeoGebra, mathematics teaching, modelling, linear optimization, system of inequalities
Introduction Technology comes in many variants such as data handling and graphing software, computer algebra systems, programming languages, programmable calculators, and dynamic geometry systems (DGS). Among these, the use of DGS has gained popularity in recent years in parallel to the development of various products such as Cabri, Geometer’s Sketchpad, and most recently GeoGebra. Kokol-Voljsc (2007) stated that in teaching and learning geometry, particularly Euclidean geometry, and solving problems related to geometry concepts, DGS are the most appropriate tools. Laborde (2002) pointed out that the use of DGS evolved over time from being a visual amplifier to a fundamental component that enhances conceptual understanding. Duval (1998) argued that DGS are superior to paper-and-pencil based (PPB) methods as they dissociate the “figure” from the “process of drawing”. This allows students to understand the properties of the figure before it is being sketched on the screen. In 2001, Markus Hohenwarter began to develop the system GeoGebra. Gradually, the group expanded by an additional programmers. The creators of GeoGebra continue its development and constantly replenished to new functions and modules. In an effort to create a complex 16
, 2016, 5(2): 1628
mathematical program has been implemented into the GeoGebra a module for computer algebra systems (CAS). (Hohenwarter & Hohenwarter, 2013) The current version (version 5.0) now offers to users the window on the 3D geometry which allows you to work with the solids in three-dimensional coordinate system. GeoGebra is now functional on a mobile platform that allows its use for tablets, resp. for mobile phones. Teaching fourteen and fifteen year old mathematics presents many challenges. Engaging these students can be difficult, especially as the mathematics they study becomes more abstract. Dynamic geometry offers opportunities to bring the real world into the mathematics classroom, to add visualization, colour and animation not possible in a traditional classroom and to deepen the mathematical thinking we expect of the students in various topics of the curriculum. (Pierce & Stacey, 2011) There are too many surveys about the using DGS in mathematics education. Many of them show that DGS are not making sufficient and if they are used, so almost exclusively in teaching geometry. From surveys, it is clear that the GeoGebra is the most popular software, and therefore we continue to devote only about the GeoGebra (Molnár & Lukáč, 2015), (Kriek & Stols, 2011), (Ainley et al., 2010). So we decided to show the possibility of such the GeoGebra can also be used in other areas such as in geometry.
Graphical solution of system of linear inequalities At the outset, we would like to show the possibilities of the program GeoGebra for graphical solution of system of linear inequalities (Task 1). Task 1 Solve the system of linear inequalities graphically in R2:
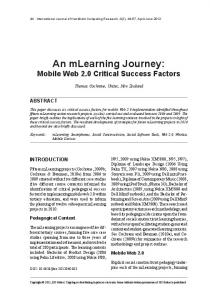
The solution of this system is by using GeoGebra very visual. Just write the three inequalities to the input line of the form: . GeoGebra then draws a set of possible solutions to inequalities of the system (Fig. 1). Then we can by using the tool "Point on object" to insert point that we can move within the drawn set. From an algebraic window we can read its coordinates and therefore also the solution of system of linear inequalities (Fig. 1).
17
, 2016, 5(2): 1628
Fig. 1: Solution of system of linear inequalities
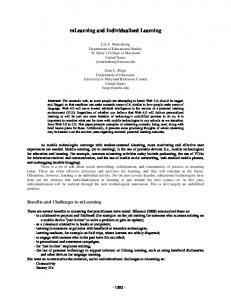
The experimental Teaching Experimental teaching we realized at the grammar school in Košice. It consisted of two lessons. During the lesson, which preceded our experimental teaching students tackled a graphical solution of linear inequalities. They drew in their workbooks half-planes that meet the specified inequalities. During the experiment we tried to actively engage students into exploring the context. We also wanted to raise students' interest about the linear optimization. In the experiment was involved mathematical class in the first year. In the classroom was located during the experiment 25 students. Of which was 16 boys and 9 girls. Students during these two lessons were given two worksheets. During the first lesson students were familiar with the graphical solution of linear inequalities, the issue of linear optimization, as well as with the program GeoGebra. Students have mastered control of the GeoGebra very quickly, because it was for them intuitively. During the second lesson, students were working with second worksheet, which was devoted to word problems leading to the linear optimization. In the next part of this article we will focus on both worksheets. The worksheet 1 Worksheet 1 consisted of six tasks. Tasks 2 – 4 formed a worksheet 1. Besides these, there were three more tasks, but out of curiosity we pick out just those three. Task 2 Solve the system graphically:
18
, 2016, 5(2): 1628
Fig. 2: Task 2 request
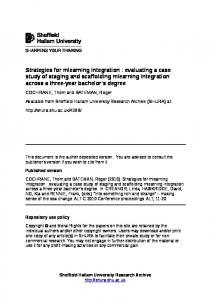
Note: Students have mastered that task quite well. Students had to solve a system of two inequalities and one equation. Twenty students had that task resolved correctly and five students had incorrectly solutions. For students who have not solved that task correctly was the biggest problem an unclear cross hatch (shown in the next task), or bad determine the half-plane under the sign of inequality (Fig. 3). It was clear to see that some students had problems with determining the correct half-plane that satisfies the inequality. Some students identify the right half-plane with the help of chance.
Fig. 3: Demonstration of the student solution of Task 2
Task 3 Solve the system graphically:
19
, 2016, 5(2): 1628
Fig. 4: Task 3 request
Note: In this task was reflected the confusing cross hatch even more than in the previous task (Fig. 5), as it is a system of four inequalities. That task correctly solved fifteen students. Other students solve this task wrong, respectively, the task did not manage to resolve. Some of the students who did not manage to resolve that task had no problems with previous tasks. Therefore, we conclude that did not solve task of the time pressure. At this task has been our intention to show to students the benefits of GeoGebra. Of course only after the submission of the worksheet.
Fig. 5: The confusing cross hatch
Task 4 Locate such solution of the system of inequalities
for which is the number x + 2y 20
, 2016, 5(2): 1628
a) the least b) the greatest.
Fig. 6: Task 4 request
Note: This last task served as a transition from the solving systems of linear inequalities to the linear optimization. Since the some students have not manage even a previous task, so that it was even worse. Of course some students have managed to finalize the solution of the task (Fig. 7).
Fig. 7: Demonstration of the student solution of Task 4
After the handover of the worksheet we showed to students the possibility of the system GeoGebra. Students who did not manage to solve all tasks have been happy that they with the GeoGebra can do it. Later we returned worksheets to students so that they can solve the tasks at home by using GeoGebra. In the next lesson we continue the last task from the first worksheet and we went through on word problems on linear optimization. 21
, 2016, 5(2): 1628
The worksheet 2 Worksheet 2 consisted of three tasks. Tasks 5 – 7 formed a worksheet 2. Students solved the worksheet individually during a one lesson. Task 5 (Cechlárová) FarLak company produces two kinds of paints: Z and V, which sells for 5000 (Z) and 2000 (V) EUR per tonne. The company uses two kinds of raw materials, A and B, whose stocks are 6 t (A) and 5 t (B). Per one tonne of paint Z are necessary 3 parts of raw materials A and 1 part of raw materials B. To produce one ton of paint V are necessary 2 parts of raw materials A and 2 parts of raw materials B. How many of the paint type, the company FarLak do, if they want to make the most money? Note: Any data for which there is a star (*) have not been on the worksheet and students had to supplement their own. Students have available in this task a summary table, under which they had to complete the condition (inequality) for raw material B. Paint Z
Paint V
Raw material A
3/4
2/4
Resources (t) 6
Raw material B
1/4
2/4
5
5000
2000
---------
Price (EUR)
Quantity (t) x y --------On the basis of the table, students have work towards the following system of linear inequalities: The condition for the raw material A:
Students had to complete the condition for the raw material B: (*) Amount of paint Z: Students had to complete the condition for paint V: (*) Students had written in this task also the prescription of the target function which is the revenue which we want to maximize: and also a shape the enrolment of inequalities in which they should be entered in the input line in GeoGebra: Students had into the figure (Fig. 8) draw a line that will provide a maximum revenue.
22
, 2016, 5(2): 1628
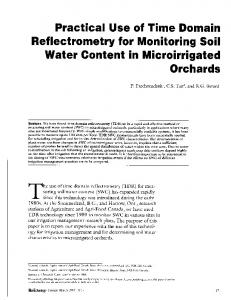
Fig. 8: Producing paints
Finally, students should formulate an answer and thus, if the company FarLak wants to make the most, then it must produce 8 tons of Paint Z and 0 ton of Paint V. The revenue in this case would be 40 000 EUR. Note: All of 25 students knew the correct plot a straight line representing a maximum direct revenue, which proves that they understand the issue of optimization. Up to 11 of them been not written an answer. 7 wrote a full answer and 7 wrote a result in the form x = ... y = ... . For all students it was clear that they understand the issues of linear optimization. Task 6 (Oravcová, 2013) Research about the development of animal production showed that the fattening of farm animals is very advantageous if in the daily doses of each animal will receive at least 6 units of nutrient A, at least 12 units of nutrient B and at least 4 units of nutrient C. For fattening using two types of feed, K1 and K2. One kilogram of the feed K1 contains 2 units of the nutrient A, 2 units of the nutrient B and no nutrient C unit. One kilogram of the feed K 2 contains 1 unit of the nutrient A, 4 units of the nutrient B and 4 units of the nutrient C. Furthermore, we know that for 1 kg of the feed K1 to be paid 0.50 EUR and of the feed K2 to be paid 0.60 EUR per 1 kg. How much kilograms of the feed K1 and K2 should be given to one animal, the cost of fattening were minimal? Note: Any data for which there is a star (*) have not been on the worksheet and students had to supplement their own. Also in this task students have at their disposal a table, but some details should add themselves on the basis of definition of the task
Nutrient A
Feed K1
Feed K2
Minimum quantity
2 (*)
1
6
23
, 2016, 5(2): 1628
Nutrient B
2 (*)
4 (*)
12 (*)
Nutrient C
0
4 (*)
4 (*)
Price (EUR)
0,50 (*)
0,60 (*)
-----------
Quantity (kg)
x
y
-----------
On the basis of the table, students should ultimately to bring about the following system of inequalities: Nutrient A: Nutrient B: Nutrient C:
(*) (*)
(*) (*) Students should then write a prescription of the target function that we want to minimize: (*) Students had also in this task available the figure (Fig. 9) to which they plotted the position of the straight line representing the investment.
Fig. 9: Mixing of feed
Finally, have students write an answer again: One animal should be given 2 kg of feed K 1 and 2 kg of feed K2. Note: Students had no problem to replenish a table based on definition of the task. The problem was the change from the maximization to minimization. 3 students could not properly a trace the line and hence could not resolve an exercise. These three students does not seem to quite grasp the concept of minimizing costs for fattening. For remaining 22 students was
24
, 2016, 5(2): 1628
repeated a position from the previous task. Thus, 10 students wrote an answer and of the remaining 12, only 6 enrolled an answer with whole sentence. Task 7 (Berežný & Kravecová, 2012) Businessman produces two types of products: product A and product B. He employs a two staff members whose productivity is about the same. Production of the one product A takes four hours and the final machining takes two hours. For the product B is nine hours for production and one hour for the final machining. Each piece of the product takes in stock 1 m3, and storage capacity is 12 m3. For production of products has a businessman maximum of 90 hours, on the final machining has a maximum of 20 hours. Profit from the sale of one product A is 65 EUR, B product is 48 EUR. How many pieces and whose products has a businessman to do that be the maximum profit? Note: Students had at the last task to available only the empty table that had to replenish themselves and guidelines for the further work.
First, students should replenish a table: Product A
Product B
Capacity
Manufacture (h)
4
9
90
Machining (h)
2
1
20
Storage (m3)
1
1
12
Profit (EUR)
65
48
----------------
Quantity
x
y
----------------
Subsequently have the students with the help of the table write conditions (inequalities):
They also have to write a target function which represents a profit: Students had to solve the task graphically using the GeoGebra and formulate an answer. Note: The problem in this task was the preparation of the table. Some students (3) could it not and they failed to resolve (Fig. 10). Other students were able to replenish a table, and then write also a system of inequalities. Students who have achieved this first (5) solve the task using the GeoGebra on our laptop. Others were given the task to install GeoGebra at home 25
, 2016, 5(2): 1628
and send us an exercise solution. All students, except those who failed to prepare a table also sent us a solution. Again, something happened that on previous tasks, students did not write the answers.
Fig. 10: Demonstration of the student solution of Task 7 - Table
Fig. 11: Demonstration of the student graphic solution of Task 7
Results & discussion In our experiment, the students met with the GeoGebra for the first time in their lives. Its control they mastered easily. On students was perceptible an increased activity when we allow them to work on our laptop in the last exercise. Students took the possibilities of GeoGebra because the experimental teaching took place on Friday and they sent us their solutions once on Saturday and Sunday. In doing so, we told them that there were a one week. For the greatest benefit of GeoGebra students considered it clearness. Of course, the deeper meaning see only students who have mastered the curriculum of solutions of linear inequalities. These students especially appreciated the speed of construction, because they do not have to reside with drawing. Some students even said: "Finally, I do not exactly draw!". 26
, 2016, 5(2): 1628
Interested in working with the GeoGebra expressed mainly boys. After the lesson, the two boys asked us for other uses the GeoGebra. The biggest positive for us was the motivating factor of the GeoGebra. Students met with the GeoGebra for the first time in their lives and it was for them something new. Of course, if they worked with the GeoGebra very often, the motivational effects would not be so high. Therefore, we think that the occasional inclusion of the GeoGebra in teaching of mathematics can be very beneficial. The biggest problem for students were writing the verbal answers in connection with the award of task. Apparently they are not used to from a classroom teaching. Because it was a math class, then just a solving exercises was not problematic. Aside from the mentioned cases where students were unable to do a summary table. In this case, students could not select the right information from the assignment of the task. Ultimately, we evaluate the experiment as a successful. We were surprised mainly of students' interest in working with the GeoGebra.
Conclusion The aim of this article was to introduce the reader to the possibilities, how can a dynamic geometry system (GeoGebra) use in the teaching of mathematics. The emphasis in this article is put mainly on the use of GeoGebra in other than the geometrical area. The tasks were aimed at resolving the problems of linear optimization with the help of modelling that is currently by using GeoGebra very visual and easily understandable for students. In the current information age, students face a demanding knowledge-based economy and workplace, in which they need to deal effectively with complex, dynamic and powerful system of information and be adept with technological tools. The need to develop students’ abilities to successfully use technological tools in dealing with complex solving for success beyond school has been emphasized by a number of professional organizations. An appropriate medium for achieving this goal for students is mathematical modelling, a process that describes real-world situation in mathematical terms in order to gain additional understanding or predict the behaviour of these situations. Using the models and modelling perspective, students have opportunities to create, apply, and adopt mathematical and scientific models in interpreting, explaining and predicting the behaviour of real-world based problems.
Acknowledgement This article was created with the support of the Slovak research and development agency in the framework of the contract no. APVV-0715-12.
References AINLEY, J., EYELEIGH, F., FREEMAN, Ch., O´MALLEY, K. ICT in the Teaching of Science and Mathematics in Year 8 in Australia: report from the IEA Second International Technology in Education Study (SITES) survey, ACER Research Monograph, No 64, 2010. BEREŽNÝ, Štefan & KRAVECOVÁ, Daniela. Lineárne programovanie. Vysokoškolská učebnica. Košice: Technická univerzita v Košiciach, 2012, ISBN 978-80-553-0910-1. CECHLÁROVÁ, Katarína. Lineárna a celočíselná optimalizácia. Úvod do problematiky. LCO – Prednáška 1. Košice: PF UPJŠ.
27
, 2016, 5(2): 1628
DUVAL, Raymond. Geometry from a cognitive point of view. In C Mammana & V Vilani (Eds.), Perspectives on the teaching of geometry for the 21st century. 1998, 37-52, ISBN 97894-011-5226-6. HOHENWARTER, Judith. & HOHENWARTER, Markus. Introduction to GeoGebra. Version 4.4, 2013. [cit. 20160821] Available from: http://static.geogebra.org/book/introen.pdf KOKOL-VOLJC, Vlasta. Use of mathematical software in pre-service teacher training: The case of GeoGebra. Proceedings of the British Society for Research into Learning Mathematics. 2007, vol 27, iss 3, 55-60, ISSN 1463-6840. KRIEK, Jeanne & STOLS, Gerrit. Why don´t all math’s teachers use dynamic geometry software in their classrooms? In Australasian Journal of Educational Technology, 2011, vol. 27 iss. 1, 137-151. LABORDE, Colette. Integration of technology in the design of geometry tasks with CabriGeometry. International Journal of Computers for Mathematical Learning, 2002, vol. 6, iss. 3, 283-317. ISSN 1382-3892. LUKÁČ, Stanislav. Solving linear optimization problems in mathematics teaching using ICT. MATHEMATICA III, Scientific Issues, 2009, Ružomberok. MOLNÁR, Pavel & LUKÁČ, Stanislav. Dynamic Geometry Systems in Mathematics Education: Atittudes of Teachers. ICTE Journal, 2015, vol. 4, iss. 4, 19-33. [cit. 20160828] Available from: https://periodicals.osu.eu/ictejournal/dokumenty/2015-04/ictejournal-2015-4article-2.pdf MOUSOULIDES, Nicholas. GeoGebra as a conceptual tool for modelling real world problems. Model-Centered Learning. Rotterdam: Sence Publishers, 2011, ISBN 978-94-6091616-8. ORAVCOVÁ, Eva. Lineárne nerovnice, lineárna optimalizácia. Premena tradičnej školy na modernú. Banská Bystrica: Gymnázium Jozefa Gregora Tajovského, 2013.
28