DAMER, DIMITROV: PRACTICAL FACE PRESENTATION ATTACK DETECTION
1
Practical View on Face Presentation Attack Detection Naser Damer
[email protected]
Kristiyan Dimitrov
[email protected]
Smart Living & Biometric Technologies Fraunhofer Institute for Computer Graphics Research (IGD) Darmstadt, Germany
Abstract Face recognition is one of the most socially accepted forms of biometric recognition. The recent availability of very accurate and efficient face recognition algorithms leaves the vulnerability to presentation attacks as the major challenge to face recognition solutions. Previous works have shown high preforming presentation attack detection PAD solutions under controlled evaluation scenarios. This work tried to analyze the practical use of PAD by investigating the more realistic scenario of cross-database evaluation and presenting a state-of-the-art performance comparison. The work also investigated the relation between the video duration and the PAD performance. This is done along with presenting an optical flow based approach that proves to outperform state-of-the-art solutions in most experiment settings.
1 Introduction Personal identification takes place in many domains, primarily as a means of providing access control for security sensitive environments [19]. Conventional authentication methods depend on passwords or identity documents. However, those approaches proved to be easily spoofed and therefore do not meet the security demands of modern applications. Automatic biometric recognition algorithms utilize physical or behavioral characteristics to verify or identify individuals more securely [9]. As promising and effective biometric solutions proved to be, they have become nonetheless subject to fraudulent attacks. Therefore, the vulnerability of such systems against fake biometric characteristics is a growing concern. The so called presentation attacks can be expressed in terms of, but not limited to, someone posing as another individual or hiding their identity [20]. Subsequently, that led to the development of “presentation attack detection” PAD (or “anti-spoofing”) countermeasures. Prerequisite to a good and reliable PAD application is most notably the ability to perform well with different kinds of attacks and scenarios under diverse conditions. One of the most commonly accepted biometric characteristics is the face image. The main reason, among others, is the non-intrusive capture using non-contact sensors to capture it from a distance. Although face recognition is a task that the human brain can perform routinely and in an effortless manner, automated face recognition has been a challenging milestone in biometrics. In order to accurately identify a face, a myriad of factors have to c 2016. The copyright of this document resides with its authors.
It may be distributed unchanged freely in print or electronic forms.
Pages 112.1-112.11 DOI: https://dx.doi.org/10.5244/C.30.112
2
DAMER, DIMITROV: PRACTICAL FACE PRESENTATION ATTACK DETECTION
be considered. Besides being invariant to age, pose and facial expression, face recognition systems should take factors, such as varying illumination or changes due to accessories, into account [14]. Unfortunately, as convenient as face biometrics have been established to be, recent research has shown that it is quite vulnerable to presentation attacks [16]. In its most basic form, a face recognition system is designed to only recognize identities without concerning whether the subject is real or fake. Therfore, it can be easily spoofed by exposing the system’s sensors to a printed photograph of the impersonated character [5]. A typical PAD component of a face recognition application that counteracts this issue is the so called “face liveness detection” subsystem. As a result to the growth of interest in face recognition systems, a number of different methods have since been developed. Previous works focused mainly on approaches based on texture and motion analysis of a 2D digital image respectively. Texture based methods, such as the ones proposed in [5] and [15], take into consideration the different surface properties of human skin compared to a printed photo or electronic display. These differences reflect the information loss in those images, which in turns manifests itself in shape and detail loss. The employed techniques extract biometric features from single images, taken with a dedicated camera. There are two essential feature extraction mechanisms to be distinguished: First is Fourier transforming the 2D image into frequency domain and the second is applying the Local Binary Pattern (LBP) operator respectively. Frequency analysis, however, has been proven more error prone to images displayed on electronic screens in comparison to LBP. LBP based solutions shows an overall half-total error rate (HTER) of 13.97% using the REPLAY-ATTACK database in combination with a Support Vector Machine (SVM) classifier, according to [5]. Motion based approaches focus on the transition between consecutive images and thus rely on a whole frame sequence (video) in contrast to a single image. These techniques usually depend either on optical flow (as in [2]) or feature comparison between frames (as in [1]) in order to detect specific movement patterns of a particular face part. Those motions can be within the region of the eyes (as in [11]) or the lips (as in [12]) or even the whole head. Some of those approaches require user collaboration, while others are completely non-intrusive. Focusing on optical flow based methods, Bao et al. ( [2]) have exploited the fact that a planar object (a photograph) has a substantially different motion pattern compared to a 3D object (a real human face). That being said, it was demonstrated, that such system would be very hard to spoof by a 2D image. Most recently, the approach proposed in [3] utilizes a so called Histogram of Oriented Optical Flow (HOOF) feature extraction technique, which in turns was initially introduced in [4]. The authors Bharadwaj et al. report reaching the state-of-the-art HTER of 1.25% using the REPLAY-ATTACK database in combination with Principal Component Analysis (PCA) dimensionality reduction and Linear Discriminant Analysis (LDA) as a means for classification. However, as the authors of [22] recognized, the above mentioned application needs 230 frames in order to construct the descriptor (feature vector), which is consequently to be passed to the classifier. This circumstance renders the system not as user friendly and suitable for real-life scenarios. This work aims at investigating the practical use of face PAD. This is achieved through three main contributions. The first is presenting an optical flow based PAD solution that proved to outperform the state-of-the-art works in most experiments. The second is to perform cross-database evaluation to simulate a more realistic scenario. This evaluation included listing a comparison with the latest published works. The third contribution is to
DAMER, DIMITROV: PRACTICAL FACE PRESENTATION ATTACK DETECTION
3
analyze the duration (video length) required to achieve a confident decision, which is aimed at providing valuable information about the usability of such a system. The Presented PAD solution was based on optical flow in a similar manner to HOOFbased feature extractor along with an AdaBoost [18] classifier. Additionally, inspired by the work done in [17], we suggest a way to deal with a possible illumination change, since this can significantly affect the calculation of the optical flow field as observed in [2]. The cross database evaluation was carried on the REPLAY-ATTACK [5], MSU-MFSD [22] and CASIAFASD databases [23]. The Evaluation results are presented as equal error rates (EER), half total error rates (HTER), true positive rate (TPR) at a fixed false positive rate (FPR), and as receiver operating characteristic curves (ROC). In the next Section 2 the used databases will be presented. Section 3 will detail the proposed approach. Section 4 will discuss the performed experiments. Evaluation results will be presented in Section 5. Finally, in Section 6, a conclusion of the work is drawn.
2
Databases
As mentioned earlier the presented solution is tested on multiple databases: the REPLAYATTACK [5], the MSU-MFSD [22] and the CASIA-FASD [23]. Each of these data-sets includes subsets for training and testing to evaluate the algorithm performance. Those databases are used to evaluate intra and inter database performance. The REPLAY-ATTACK database includes 1200 videos divided into three groups: 360 for training, 480 for testing and another 360 used to fine-tune classifier parameters. There were 50 identities involved in the recording process under two different lightning conditions: controlled (artificial lightning) and adverse (natural daylight). All of the video clips were taken using the built-in camera of a 1300 Apple MacBook laptop with a resolution of 320 by 240 pixels at 25 frames per second and of 15 seconds (375 frames) each. The spoofing attack videos can be in turn divided into two parts: in the first, the subjects display hard copies of high-resolution digital photographs printed on plain A4 paper (photos taken using a 12.1 megapixel Canon PowerShot SX150 IS camera and printed using a Triumph-Adler DCC 2520 color laser printer). The second type of attack have the subjects displaying photos and videos taken with the aforementioned camera using an iPad screen with a resolution of 1024 by 768 as well as photos and videos taken with the 3.1 megapixel camera of an iPhone 3GS using its own screen. Each attack video is captured for about 10 seconds in two different attack modes: hand-based and fixed-support. The MSU-MFSD database takes a similar approach as the REPLAY-ATTACK dataset but claims to generate better quality data using more advanced technology. It provides 280 recordings (only 280 are made publicly available out of 440) of 55 subject with 70 genuine and 210 spoofing attacks. The videos are taken with the built-in camera of a 1300 Apple MacBook Air laptop with a resolution of 640 by 480 pixels at 20 frames per second and of 10 seconds each as well as with the front-facing camera of a Google Nexus 5 device with a resolution of 720 by 480 pixels at 30 frames per second and of 15 seconds each. Thus, data is gathered with the aid of a mobile phone as well, simulating the application of mobile phone unlock. The spoofing attempt videos can be divided again in two subsets. The first subset have subjects displaying hard copies of high-resolution digital photographs printed on plain A3 paper (photos taken using a Canon 550D SLR camera with a resolution of 5184 by 3456 pixels and printed using an HP Color Laserjet CP6015xh printer with a dots per inch of 1200
4
DAMER, DIMITROV: PRACTICAL FACE PRESENTATION ATTACK DETECTION
by 600). In the second subset, the subjects display high-definition videos taken with the aforementioned camera with a resolution of 1920 by 1088 pixels using an iPad Air screen as well as high-definition videos taken with the back-facing camera of an iPhone 5S with a resolution of 1920 by 1080 pixels using its own screen. The CASIA-FASD database contains a set of 600 videos of 50 subjects, 150 videos of genuine faces and 450 of fake ones. The videos were captured with three different cameras. Two USB cameras with a resolution of 480 by 640 pixels. One of the USB cameras is brand new and the other is used for a long time to consider that long time usage degrades the image quality. The third camera is a higher definition Sony NEX-5. What distinguishes the latter database from the former ones, is that the subjects are required to exhibit blinking behavior rather than keeping still during recording. As for the spoofing attempt videos, they could be divided into three categories. First, the subjects display the high-resolution genuine videos taken with the aforementioned Sony NEX-5 camera with a resolution of 1280 by 720 pixels using an iPad screen. The Second have the subjects display hard copies of high-resolution digital photographs printed on copper sheets. While doing so, the attackers deliberately warp the photos, simulating a facial motion. In a similar scenario, the third attack have the subjects holding the photographs are now not warping them, but are rather required to exhibit blinking behavior through a cut off region on the photo. A variation of this spoofing technique is also utilized where the blinking process is simulated by moving an intact photo placed tightly behind a photo with a cut off eye region.
3
Methodology
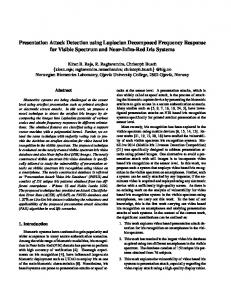
Frame Sequence
Flowmap
Figure 1: Feature vector computation The process of detecting presentation attack is a typical binary classification problem. The utilized datasets are divided by their creators into a training set and a testing set. The motion-based approach used in this work can be summarized in the following steps. First, face detection is performed as most of the relevant information can be extracted from the area of the face and its close borders. Face detection followed the approach presented by Viola and Jones [21]. Next, the optical flow map of the detected region of interest is calculated as described in [8]. Based on the optical flow map, a feature vector is calculated as explained in the next paragraphs. Since the optical flow is based on the absolute pixel movement across consecutive frames, at least two frames are needed in order to begin further computation. However, the two frames needed to generate an optical flow map are not successive, since working at 20-30 frames per second doesn’t guarantee a measurable pixel movement. For this reason every second frame is rather skipped.
DAMER, DIMITROV: PRACTICAL FACE PRESENTATION ATTACK DETECTION
5
At each frame face detection is conducted. The detected region of interest is rescaled to include a background area bordering the face. This area is important based on the assumption that the relative movement between the face and the background can be different between real and attack videos. To reduce the impact of different lightning conditions and standardize the feature vector calculation, histogram equalization and gray scale conversion is performed on the whole frame as well as rescaling the region of interest to 160x160 pixels. Detected faces in consecutive frames are neglected if their regions have an overlap value under 50%. This is done to avoid false face detections and in a more realistic scenario, a detection of a false face. The optical flow is calculated between a pair of frames (skipping one frame in between) resulting in a flow map. The map is then divided into 24x24 pixel sized overlapping blocks grid (5 pixels overlap). To quantify the flows in each block a histogram of all the enclosed optical flow vectors was created based on their direction. A histogram of 8 bins is used where each bin including an optical flow direction range of 45◦ (0◦ − 45◦ , 45◦ − 90◦ and so forth). The values of the histogram are normalized (sum of histogram bins equal one). The histograms of all blocks are concatenated to form the feature vector (descriptor) representing the two frames. Figure 1 presents an overview of the feature vector calculation process. In the following section, those feature vectors are used in three forms. First is a single feature vector and is noted by "F-single". Second is a concatenated set of three consecutive (over time) vectors referred to here as "F-triple". And finally as a fused feature vector using feature values mean-rule fusion for the set of three consecutive (over time) vectors, which is noted here by "F-mean"’. An AdaBoost Classifier [18] is trained (for each experiment setting and each type of feature vector) to classify the vector into real or attack. AdaBoost classification was chosen to focus on more informative features in a pool of features that might contain many indistinctive elements. The classification returns a decision confidence measure based on the AdaBoost weak classifiers results, this confidence value is referred to here as the "score". Score-level fusion was used to create a unified decision for longer portions of videos (videos that can create more than one feature vector). Simple combination fusion rules are used including the mean-rule and the max-rule [10], noted here by "S-max" and "S-mean" respectively.
4
Experiment
The features vectors are created in three different approaches as described in Section 3. Those Feature vectors are calculated for the training data of each of the three used databases REPLAY-ATTACK, CASIA-FASD, and MSU-MFSD. For each database and feature vector type an AdaBoost classifier is trained. Cross-database evaluation was performed to simulate a more realistic PAD scenario. This is done as the PAD system in real use scenario is supposed to deal with varying video quality and different attack scenarios (unknown conditions). In the following, the experiments will be noted by the database used for training and the database used for testing, e.g. REPLAYCASIA refers to an experiment setting where the REPLAY-ATTACK database was used for training and the CASIA-FASD database was used for testing. Evaluation within each single database was also conducted. Previous works reported results of PAD assuming a single real/attack decision per video. In real applications, the time required to acquire such a decision is critical for the usability of a face biometric solution. Therefore, evaluation was also conducted on single descriptor
6
DAMER, DIMITROV: PRACTICAL FACE PRESENTATION ATTACK DETECTION
performance. This results on evaluation of video segments of 3 frames (F-single) or 7 frames (F-triple and F-mean). An analysis of the performance improvement over the length of the video is also conducted and discussed in the next Section 5. Different evaluation metrics were used to be able to perform a comparison with the biggest possible number of previous works. Evaluation results are provided here as EER and HTER values. Achieved TPR values at fixed FPR is also presented. Evaluation results are also shown as ROC curves to view the tradeoff between the TPR and FPR and different thresholds. The EER value is the common FNR and FPR value at the threshold that makes both values equal. The half total error rate HTER is the average value of the false positive rate FPR and the false negative rate FNR at a certain decision threshold. The decision threshold utilized here is the threshold the produces the EER. The threshold value is obtained from the development database (not testing or training). In the experiment settings where the testing database did not contain a development set, the testing set was divided into subsets and the calculation of the threshold and HTER followed a cross validation approach. In those scenarios the reported HTER value is the average value over those subsets.
5
Results
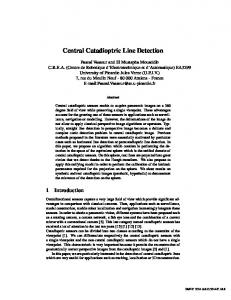
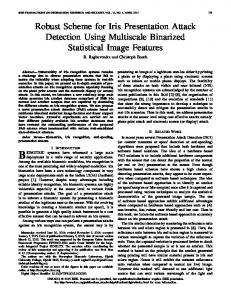
Figure 2a presents the ROC curves achieved by different experiment settings on the intradatabase evaluation of the REPLAY-ATTACK database. It is clear that the decisions made over whole videos are more accurate than decisions made based on small part of the video (per descriptor, 3 or 7 frames). From those decisions based on single descriptor, concatenating three descriptors achieved better results than fusing them into a single vector using the mean-rule. The performance based on whole videos seems to improve when using the score fusion mean-rule, and as expected, when using fused information per descriptor (F-triple or F-mean). The ROC curves achieved by the "F-triple" (selected as one of the best performing approachs) approach on different experiment settings are shown in Figure 2b, those results considered decisions made per descriptors (small portions of videos). The performance degradation is clear when performing cross-database evaluation. However, the cross-database performance improves when considering whole videos with score-level fusion as shown by the "F-triple: S-mean" approach in Figure 2c. The required time to make a confident PAD decision is important for the usability of face recognition systems. Figure 2d presents the development of the PAD performance over the duration of the video. The results are shown for intra-database experiments on the "Ftriple: S-mean" approach. It is clear that the performance improves rapidly during the first two seconds as a result of the score-fusion. One can notice that the performance reaches a saturation point after the first 3 seconds of video sequence. The saturation duration is very similar on the three different databases. Table 1 presents a wide comparison between the proposed approaches and the state-ofthe-art works under different experiment scenarios. Different performance metrics were used to enable a wide range of comparison with published works. One can notice that the proposed approaches outperformed the state-of-the-art in most experiment settings, they were only outperformed significantly by the work of Wen et al. [22] when testing over the MSU-MFSD database (small improvement when testing on the CASIA-FASD database). The authors of [3] showed that combining the Histogram of Oriented Optical Flow
7
1
1
0.9
0.9
0.8
0.8
0.7
0.7
0.6
0.6 TPR
TPR
DAMER, DIMITROV: PRACTICAL FACE PRESENTATION ATTACK DETECTION
0.5
0.4
0.4 F-single: S-mean F-single: S-max F-triple: S-mean F-triple: S-max F-mean: S-mean F-mean: S-max F-single: (per descriptor) F-triple: (per descriptor) F-mean: (per descriptor)
0.3 0.2 0.1 0 0
0.5
0.2
0.4
0.6
0.8
REPLAY-REPLAY REPLAY-MSU REPLAY-CASIA MSU-MSU MSU-REPLAY MSU-CASIA CASIA-CASIA CASIA-REPLAY CASIA-MSU
0.3 0.2 0.1 0 0
1
0.2
0.4
FPR
0.6
0.8
1
FPR
(a)
(b)
1
0.25 REPLAY-REPLAY MSU-MSU CASIA-CASIA
0.9 0.8
0.2
0.7
0.15 EER
TPR
0.6 0.5 0.4 0.3 0.2 0.1 0 0
0.1
REPLAY-REPLAY REPLAY-MSU REPLAY-CASIA MSU-MSU MSU-REPLAY MSU-CASIA CASIA-CASIA CASIA-REPLAY CASIA-MSU 0.2
0.4
0.6 FPR
(c)
0.8
0.05
1
0 0
2
4
6
8
10
Time [s]
(d)
Figure 2: (2a) ROC curves achieved by different experiment settings trained and tested on REPLAY-ATTACK; (2b) ROC curves achieved by the "F-triple" approach on intra- and cross-database evaluation. One classification decision per descriptor (3 or 7 frames).; (2c) ROC curves achieved by the "F-triple: S-mean" approach on intra- and cross-database evaluation. One classification decision per video.; (2d) The performance (represented by the EER) development at different video lengths (time). Evaluation on intra-database settings using the "F-triple: S-mean" approach. (HOOF) feature with motion magnification achieved the best performance on the REPLAYATTACK database (HTER = 1.25%). However, motion magnification, cannot reach the reported performance without accumulating a large number of video frames (>200 frames), making these methods unsuitable for near real-time response [22]. From Table 1 one can notice the expected performance boost when considering whole videos. However, the performance does not always improve when using feature-level fusion (F-triple or F-mean). The score-level fusion mean-rule usually outperforms the max-rule.
-
-
-
[5]: LBP[15]+SVM
[3]: LBP+SVM
[3]: HOOF+LDA+NN
-
1.25
16.1 94.5
-
-
[22]: LBP[15]+SVM
[22]: DoG-LBP[13]+SVM
Test: CASIA
Test: REPLAY
Test: MSU
-
-
-
-
-
-
-
-
-
-
-
-
-
-
-
-
-
-
-
-
-
-
-
-
-
-
19.5
-
-
-
75.5 14.1
-
-
-
-
-
-
-
-
-
-
-
-
-
-
-
-
-
-
-
-
-
-
-
48.28
57.9
61.33
-
-
-
-
-
-
-
-
-
-
-
-
-
-
-
-
-
-
-
-
-
-
-
-
-
-
-
-
-
-
-
-
-
-
-
-
-
-
-
-
-
-
-
-
-
-
-
-
-
-
-
-
-
-
-
-
23.6 23.1
20.9 14.7
73.7 8.58
-
-
-
-
-
-
-
-
-
-
98.75 51.67 51.13 35.9 36.47 44.98 17.1 40.6 43.56 15.19
F-triple: S-mean (per video) 2.51
Test: REPLAY
Test: MSU
Test: CASIA
-
-
-
-
-
-
-
-
-
-
-
-
-
-
-
-
-
-
-
-
-
-
-
-
-
-
-
-
-
-
-
18.21
18.17
21.01
-
-
-
-
6.7 14.2 12.7
7.8
-
26.65 30.33
24.63 23.19
21.59 23.75
-
-
-
-
-
-
17
67.2 12.9
-
-
-
-
-
-
-
-
-
-
84.4
93.3
86.7
-
-
82
-
-
-
-
-
-
-
27.89 26.84
-
40.89 40.73
-
44.84
10 11.28 12.52 88.76 36.1 35.97
-
23.77 23.27
14.76 45.24 45.23 19.8 26.41 27.88 52.68
-
10 43.33 43.04 22.5 13.53 12.17 86.52
45
Table 1: Performance achieved on different experiment settings by the proposed approaches and state-of-the-art results (when available). TPR values are calculated at FPR value of 10%. All values are in percent(%).
41
48.14 40.73
8.57 92.5 43.98 43.77 14.61 32.83 35.9
95 42.86 41.9 24.72 37.84 38.99 2.5
95 35.34 34.79 23.86 35.34 35.57 10.13 54.17 54.11 12.82 10.15 10.12 91.01
3.8 49.17 48.46 12.82 10.15 9.92 89.89
35.62 20.51 20.07 25.72 65.17
10.31 10.28 89.55 50.69 50.86 14.1 40.97 41.42 19.2 47.28 47.01 10.34 20.16 20.26 65.7 43.3 43.41 16.91 43.3 43.59 8.16 46.88 46.6 13.68 18.64 19.04 70.88
-
-
-
-
-
-
-
-
-
-
-
-
-
-
F-mean (per descriptor)
-
-
-
-
50.25
47.05
50.64
-
-
-
-
-
-
-
7.88 7.91 94.13 47.45 47.55 21.2 42.29 43.44 18 39.51 40.66 16.11 14.25 14.42 80.4 43.5 43.42 20.91 43.15 43.09 7.52 52.2 52.3 10.1 14.68 15.26 80.66
-
-
-
-
-
-
-
-
-
-
-
-
-
-
F-triple (per descriptor)
-
4.6
0.8
26.9
-
-
-
-
-
-
-
-
-
-
13.48 13.47 82.17 44.81 44.76 21.5 45.64 46.99 12.7 38.24 38.56 22.33 19.66 19.85 64.9 44.91 44.82 16.18 40.81
45.67 44.67
7.5
-
-
-
-
-
-
-
-
-
-
-
-
-
F-single (per descriptor)
17.43 16.98
-
10
100 47.5 50.01 22.5 39.47 40.89 25.8 48.87 48.41
3
F-mean: S-max (per video) 3.51
8.43
10
50.87 25 34.96 38.08 23.6 47.62 46.89
5
-
-
-
-
-
-
-
-
-
-
-
-
-
5.52 97.5 42.11 41.03 23.86 37.84 38.9
100
50
62.8
69.9
92.8
-
-
-
-
-
-
-
-
-
-
10.59 92.5 45.72 44.58 15.91 28.32 28.43 31.65 35
F-mean: S-mean (per video) 2.51 4.26
5
10
45.07 25.6 36.47 41.44 10.2 45.36 39.14 77.22 8.33 7.24
bob: LBP[5]+SVM
Test: CASIA
Train: CASIA
11.14 95 42.38 43.62 20.45 30.33 28.64 5.06 41.67 42.93 30.77 17.84 21.28 74.16
-
-
-
-
-
-
-
-
-
-
-
-
-
F-triple: S-max (per video) 3.51 3.63 98.75 45
3
100 30.83 30.51 38.5 45.35 50.28 6.82 25.31 24.44 51.9
F-single: S-max (per video) 5.01 5.01
F-single: S-mean (per video) 2.51 2.75 98.75 47.5 47.72 41 40.89 50.62 13.6 30.83 30.43 31.65 10
11.1 92.1
7.41 92.2
-
-
-
11.66 11.79
[6]: Corr[7]+MLP
[22]: IDA+SVM
14.41 15.45
8.17 8.51 94.5
-
-
-
-
-
-
6.62
13.87
[6]: LBP[5]+SVM
[6]: LBP-TOP+SVM
-
15.16
17.17
-
[5]: LBP+LDA
[5]: LBP+SVM
-
34.01
-
-
[5]: LBP+χ
2
[23] DoG+SVM
Test: MSU
Train: MSU
EER HTER TPR EER HTER TPR EER HTER TPR EER HTER TPR EER HTER TPR EER HTER TPR EER HTER TPR EER HTER TPR EER HTER TPR
Test: REPLAY
Train: REPLAY
8 DAMER, DIMITROV: PRACTICAL FACE PRESENTATION ATTACK DETECTION
DAMER, DIMITROV: PRACTICAL FACE PRESENTATION ATTACK DETECTION
6
9
Conclusion
Vulnerability to presentation attacks is the main challenge preventing face recognition solution form being the main tool of identity authentication in a large number of applications. A number of previous works discussed presentation attack detection solutions without considering the capture period required to achieve confident decisions. Other works showed good performances in intra-database evaluations but failed to do so in the more realistic crossdatabase tests. This work presented a comparison of the recent works considering crossdatabase presentation attack detection. An optical flow based approach was suggested and proved to outperform the state-of-the-art results in most experiment settings. The work also discusses the relation between achieving a confident presentation attack detection decision and the required capture time.
References [1] A. Anjos and S. Marcel. Counter-measures to photo attacks in face recognition: A public database and a baseline. In Biometrics (IJCB), 2011 International Joint Conference on, pages 1–7, Oct 2011. doi: 10.1109/IJCB.2011.6117503. [2] Wei Bao, Hong Li, Nan Li, and Wei Jiang. A liveness detection method for face recognition based on optical flow field. In 2009 International Conference on Image Analysis and Signal Processing, pages 233–236, April 2009. doi: 10.1109/IASP.2009.5054589. [3] S. Bharadwaj, T. I. Dhamecha, M. Vatsa, and R. Singh. Computationally efficient face spoofing detection with motion magnification. In 2013 IEEE Conference on Computer Vision and Pattern Recognition Workshops, pages 105–110, June 2013. doi: 10.1109/ CVPRW.2013.23. [4] R. Chaudhry, A. Ravichandran, G. Hager, and R. Vidal. Histograms of oriented optical flow and binet-cauchy kernels on nonlinear dynamical systems for the recognition of human actions. In Computer Vision and Pattern Recognition, 2009. CVPR 2009. IEEE Conference on, pages 1932–1939, June 2009. doi: 10.1109/CVPR.2009.5206821. [5] Ivana Chingovska, André Anjos, and Sébastien Marcel. On the effectiveness of local binary patterns in face anti-spoofing. Idiap-RR Idiap-RR-19-2012, Idiap, 7 2012. [6] T. de Freitas Pereira, A. Anjos, J. M. De Martino, and S. Marcel. Can face anti-spoofing countermeasures work in a real world scenario? In 2013 International Conference on Biometrics (ICB), pages 1–8, June 2013. doi: 10.1109/ICB.2013.6612981. [7] Tiago de Freitas Pereira, André Anjos, José Mario De Martino, and Sébastien Marcel. Lbp-top based countermeasure against face spoofing attacks. In International Workshop on Computer Vision With Local Binary Pattern Variants - ACCV, page 12, November 2012. [8] Gunnar Farnebäck. Image Analysis: 13th Scandinavian Conference, SCIA 2003 Halmstad, Sweden, June 29 – July 2, 2003 Proceedings, chapter Two-Frame Motion Estimation Based on Polynomial Expansion, pages 363–370. Springer Berlin Heidelberg, Berlin, Heidelberg, 2003. ISBN 978-3-540-45103-7. doi: 10.1007/3-540-45103-X_ 50. URL http://dx.doi.org/10.1007/3-540-45103-X_50.
10
DAMER, DIMITROV: PRACTICAL FACE PRESENTATION ATTACK DETECTION
[9] A. Jain, A.A. Ross, and K. Nandakumar. Introduction to Biometrics. Springer US, 2011. ISBN 9780387773261. [10] Anil Jain, Karthik Nandakumar, and Arun Ross. Score normalization in multimodal biometric systems. Pattern Recogn., 38(12):2270–2285, December 2005. ISSN 00313203. doi: 10.1016/j.patcog.2005.01.012. URL http://dx.doi.org/10.1016/ j.patcog.2005.01.012. [11] Hyung keun Jee, Sung uk Jung, and Jang hee Yoo. Liveness detection for embedded face recognition system. International Journal of Biomedical Sciences, pages 235–238, 2006. [12] K. Kollreider, H. Fronthaler, M. I. Faraj, and J. Bigun. Real-time face detection and motion analysis with application in "liveness" assessment. IEEE Transactions on Information Forensics and Security, 2(3):548–558, Sept 2007. ISSN 1556-6013. doi: 10.1109/TIFS.2007.902037. [13] N. Kose and J. L. Dugelay. Classification of captured and recaptured images to detect photograph spoofing. In Informatics, Electronics Vision (ICIEV), 2012 International Conference on, pages 1027–1032, May 2012. doi: 10.1109/ICIEV.2012.6317336. [14] Stan Z. Li and Anil K. Jain. Handbook of Face Recognition. Springer Publishing Company, Incorporated, 2nd edition, 2011. ISBN 085729931X, 9780857299314. [15] J. Määttä, A. Hadid, and M. Pietikäinen. Face spoofing detection from single images using micro-texture analysis. In Biometrics (IJCB), 2011 International Joint Conference on, pages 1–7, Oct 2011. doi: 10.1109/IJCB.2011.6117510. [16] Sbastien Marcel, Mark S. Nixon, and Stan Z. Li. Handbook of Biometric Anti-Spoofing: Trusted Biometrics Under Spoofing Attacks. Springer Publishing Company, Incorporated, 2014. ISBN 1447165233, 9781447165231. [17] B. Peixoto, C. Michelassi, and A. Rocha. Face liveness detection under bad illumination conditions. In 2011 18th IEEE International Conference on Image Processing, pages 3557–3560, Sept 2011. doi: 10.1109/ICIP.2011.6116484. [18] Robert E. Schapire and Yoram Singer. Improved boosting algorithms using confidencerated predictions. Machine Learning, 37(3):297–336, 1999. ISSN 1573-0565. doi: 10.1023/A:1007614523901. URL http://dx.doi.org/10.1023/A: 1007614523901. [19] C. Sousedik and C. Busch. Presentation attack detection methods for fingerprint recognition systems: a survey. IET Biometrics, 3(4):219–233, 2014. ISSN 2047-4938. doi: 10.1049/iet-bmt.2013.0020. [20] Xiaoyang Tan, Yi Li, Jun Liu, and Lin Jiang. Computer Vision – ECCV 2010: 11th European Conference on Computer Vision, Heraklion, Crete, Greece, September 5-11, 2010, Proceedings, Part VI, chapter Face Liveness Detection from a Single Image with Sparse Low Rank Bilinear Discriminative Model, pages 504–517. Springer Berlin Heidelberg, Berlin, Heidelberg, 2010. ISBN 978-3-642-15567-3. doi: 10.1007/978-3-642-15567-3_37.
DAMER, DIMITROV: PRACTICAL FACE PRESENTATION ATTACK DETECTION
11
[21] P. Viola and M. Jones. Rapid object detection using a boosted cascade of simple features. In Computer Vision and Pattern Recognition, 2001. CVPR 2001. Proceedings of the 2001 IEEE Computer Society Conference on, volume 1, pages I–511–I–518 vol.1, 2001. doi: 10.1109/CVPR.2001.990517. [22] D. Wen, H. Han, and A. K. Jain. Face spoof detection with image distortion analysis. IEEE Transactions on Information Forensics and Security, 10(4):746–761, April 2015. ISSN 1556-6013. doi: 10.1109/TIFS.2015.2400395. [23] Z. Zhang, J. Yan, S. Liu, Z. Lei, D. Yi, and S. Z. Li. A face antispoofing database with diverse attacks. In 2012 5th IAPR International Conference on Biometrics (ICB), pages 26–31, March 2012. doi: 10.1109/ICB.2012.6199754.