International Journal of Economics and Finance; Vol. 7, No. 7; 2015 ISSN 1916-971X E-ISSN 1916-9728 Published by Canadian Center of Science and Education
Predicting Financial Failure Using Decision Tree Algorithms: An Empirical Test on the Manufacturing Industry at Borsa Istanbul Nurcan Öcal1, Metin Kamil Ercan2 & Eyüp Kadıoğlu3 1
Capital Markets Board of Turkey, Ankara, Turkey
2
Department of Business Administration, Gazi University, Ankara, Turkey
3
Capital Markets Board of Turkey, Ankara, Turkey
Correspondence: Eyüp Kadıoğlu, Capital Markets Board of Turkey, Eskisehir Yolu 8. Km No: 156, Ankara, Turkey. Tel: 90-532-790-3065. E-mail:
[email protected] Received: April 1, 2015
Accepted: April 23, 2015
Online Published: June 25, 2015
doi:10.5539/ijef.v7n7p189
URL: http://dx.doi.org/10.5539/ijef.v7n7p189
Abstract This study aims to develop a model using C5.0 and CHAID decision tree algorithms to estimate the financial failure and/or success of a given manufacturing company. Within the scope of this study, 35 financial ratios are used as independent variables calculated on the grounds of both company’s annual financial statements and notes from 2007 to 2013. The dependent variable is the successful or unsuccessful status in terms of financial capability of 206 manufacturing firms listed on the Borsa Istanbul. Qualitative criteria are used to categorize the companies as successful or unsuccessful. The rates of accurate classification for both models are found to be at acceptable levels. Although the CHAID algorithm’s general rate of accuracy and its rate for successful companies are greater than the rates obtained from the C5.0 algorithm for the same observations, the CHAID algorithm yielded much lower results than the C5.0 algorithm in predicting unsuccessful companies. Keywords: financial failure, decision tree, C5 algorithm, CHAID algorithm, Borsa Istanbul 1. Introduction Due to its socio-economic impact, the topic of company failure has attracted the attention of researchers and led to multiple studies on the factors influencing the financial failure and/or success of companies. Recent bankruptcies and financial crises have also kept the topic on the agenda. Taking into consideration the increasing complexity of financial instruments, the increasing number of issuers, and securitization and globalization; it is obvious that there will be an increase in the parties potentially affected by company failures. Accordingly, studies on the prediction of company failure will continue to attract interest. One of the core differences among studies on this topic is the definition of financial failure. Evaluating the literature, application for bankruptcy has been the most commonly used indicator of financial failure (Elam, 1975; Altman, Haldeman, & Narayan, 1977; Ohlson, 1980; Zmijewski, 1983; Casey & Bartczak, 1985; Beaver, Correia, & McNichols, 2009; Wu, Gaunt, & Gray, 2010; Jones & Peat, 2014). On the other hand, some studies have used different measures. For example, Beaver (1966) and Edminister (1972) accepted nonperforming financial liabilities in due time, unpaid debts apart from those leading to bankruptcy, bounced checks, not distributing profit to privileged shareholders and so on as measures for financial failure. Financial failure is defined in the following ways: the appointment of an equity receiver apart from an application the right to bankruptcy or reorganization as per the bankruptcy code (Altman, 1968); the decrease of a company’s assets between two defined time periods (Wilcox, 1970); the inability to pay debts due or to make a deal with creditors in order to reduce debts, thus, entering into bankruptcy (Blum, 1974); entering into liquidation as demanded by creditors (Deakin, 1976); entering into liquidation as demanded by creditors and the suspension of trading by court order (Taffler, 1982); incurring loss for three years or the termination of production due to financial crisis (Aktaş, 1993); incurring loss for two years or possessing net book value per share that is under net asset value per share, incurring a loss for one year and also possessing equity below the value of capital issued, and concern stated within independent audit report on the continuity of the company according to a special definition for China made by Altman et al. (2007); incurring loss for two years and share 189
www.ccsenet.org/ijef
International Journal of Economics and Finance
Vol. 7, No. 7; 2015
movement lower than that of the general index in which the share is traded (Özdemir, 2011). This study, which uses qualitative indicators to identify unsuccessful companies, aims to classify companies that operate in the manufacturing industry as successful or unsuccessful according to their financial ratios. Discriminant analysis, logistic regression, artificial neural networks, principal component analysis and decision trees are commonly used in the literature. This study uses decision tree algorithms such as artificial neural networks, which are one of the new-generation data mining methods commonly used in recent classification and estimation studies on the grounds that their tree-like structure makes them easy to interpret (Koyuncugil, 2007; Koyuncugil & Özgülbaş, 2008). Decision trees apply multiple tests called decision tree algorithms to a data set when determining the way that will best predict the dependent variable. This study utilizes the C5.0 algorithm developed by John Ross Quinlan and the chi-squared automatic interaction detector (CHAID) algorithm developed by Gordon V. Kass (Bounsaythip & Rinta-Runsala, 2001; Emel & Taşkın, 2005). This study uses the annual financial reports and disclosures of 206 manufacturing companies listed in Borsa Istanbul for the period from 2007 to 2013. Upon reviewing financial failure studies conducted in Turkey, it is clear that no prior study has used the same definition of financial failure, data, methodology and the period as this study. This study is unique in that it reviews and analyzes data related to news announcements and disclosures on the Borsa Istanbul website for the period prior to 2009 and Public Disclosure Platform (PDP) website belonging to 206 companies for the period from 2010 and onward. This study also looks at announcements made by Borsa Istanbul and PDP concerning market changes, companies delisted due to financial distress, companies transferred from the National Market to the Second National Market or the Watchlist Companies Market due to financial distress, companies obliged to make monthly declarations due to financial distress, companies warned by the Capital Markets Board of Turkey (CMB) or Borsa Istanbul to take precautionary measures due to loss of capital, and companies whose governing bodies applied to the courts. The second section of our study summarizes the literature on measures of financial failure and methods used in previous studies. The third section explains the data set and method used in our study, and the fourth section analyzes the data obtained. The final section is the conclusion. 2. Indicators of Financial Failure and Methods Used in Previous Studies 2.1 Indicators of Financial Failure Both quantitative and qualitative indicators may be used to determine financial failure. Numeric indicators may be either book-value based or market-value based (Özdemir, 2011). Table 1 outlines the various types of indicators. Table 1. Indicators used to determine financial failure
Book-value-based indicators
Marketvalue-based indicators
Quantitative indicators
Qualitative indicators
-Incurring loss for three consecutive years
-Suspension of the market in which the shares
-Negative equity
are traded
-Erosion of asset value over a specific ratio
-Transfer of the company to the Watchlist
-Erosion of capital over a specific ratio
Company Market
-Decrease of retained earnings over a specific ratio
-Delisting of the company from the market
-Decrease in the market value of company shares greater than
-Application for bankruptcy
the change in the index in which the shares are traded over a
-Bankruptcy
specific period -Decrease in the market value of the company shares greater than the return of the other shares in the same market over a specific period -Decrease in the net written-down value of a share below its net book value
Most studies use book-value-based indicators, and companies are classified using one or more of these indicators. On the other hand, the homogeneity of the companies present in a category decreases depending on the indicator chosen and category size. 190
www.ccsenet.org/ijef
International Journal of Economics and Finance
Vol. 7, No. 7; 2015
Market-value-based indicators may achieve accurate results when markets are rather efficient and data is accessible. On the other hand, it may be argued that market-value-based indicators are inappropriate for cases like Turkey in which markets are inefficient. Therefore, using qualitative data to classify companies may prove less challenging. This study defines a given company as unsuccessful provided that it is subject to any of the precautionary measures listed below. Its status as unsuccessful proceeds from the beginning of the year in which the measure was applied until the year it was lifted, if such were the case. The measures are as follows: a) Delisting from market due to financial distress; b) The suspension of trading due to financial distress; c) Change of market due to financial distress (i.e. transfer from the National Market to the Watchlist Companies Market or the Second National Market); d) Obligation to make monthly declarations due to financial distress; e) Notice to take precautionary measures by CMB or Borsa Istanbul due to capital loss, or application to court by the firm’s authorized bodies. 2.2 Predicting Financial Failure and Methods Used There has been a noticeable inadequacy of hypotheses regarding the causes of financial failure (Aktaş, 1997; Foster, 1986). It has been suggested that this inadequacy stems from the following causes: 1) Uncertainty when determining the variables that will be used to predict financial failure; 2) Uncertainty regarding the choice of linear or nonlinear model; 3) Uncertainty in determining the weights that will be given to variables. Despite this inadequacy of hypotheses, explanatory and predictive models have been developed to solve the above problems. Table 2 and 3 summarize several studies within the literature on determining financial failure and their methods. Table 2. Summary of studies on determination of financial failure and methods used Author(s)
Period/country
Methods used
Result(s)
Altman et al. (1994)
1982-1992
Linear
Discovered that probability-based models are more
Italy
logistic regression and
discriminant,
robust than other artificial neural networks
neural networks Lin & McClean
1980-1999 UK
(2001)
Linear
discr.,
logit,
neural net. and 5.0
Found that decision trees and neural networks yield better results than discriminant and logistic regression
Nguyen (2005)
1988-2002
Multilayer
Australia
networks
neural and
logistic
regression Ooghe et al. (2005)
Belgium
Found that the models used are effective for predicting corporate failure and that probabilistic neural networks outperform other models
Simple-intuitive models
Provides
a
basis
for
future
research
on
simple-intuitive models. For example, the different range of variables and the treatment of special cases are methodological issues to be tackled Sun & Li (2006)
2000-2005 China
Chen and Du (2009)
Preprocessing
financial
Preprocessing can enhance the ability to predict
data for decision tree
financial distress
Artificial
Found that ANN approach obtains better accuracy
neural
networks, data mining
of prediction than data mining cluster analysis
cluster analysis Gepp et al. (2010)
1971-1981 USA
Decision trees
The decision tree method is a superior classifier and predictor
Chen (2011)
2000-2007 Taiwan
Bee & Abdollahi (2013)
2006-2010
PCA and decision trees
Artificial intelligence can be a more effective method than traditional statistics
Malaysia
One of the main determiners of failure is leveraged Logistic regression
191
buyout ratio
www.ccsenet.org/ijef
Mahdi & Fezeh (2013)
International Journal of Economics and Finance
2001-2011
Particle
Iran
optimization,
swarm
Particle swarm optimization and classification yield better results than regression trees and
classification, regr. trees, support
Vol. 7, No. 7; 2015
vector
support vector data description
data
description Jones & Peat (2014)
1989-2005
Latent class analysis
LCA method yields better results than standard
Australia
logistic regression model
Note. The table has been expanded using information from the work of Ekşi (2011).
Table 3. Summary of studies on predicting financial failure in Turkey and their methods Author(s) Aktaş et al. (2003)
Benli (2005)
Altaş & Giray (2005)
Period 1983-1997
1997-2001
2001
Methods used
Result(s)
Multiple regression, logistic and
The explanatory power of neural networks is
discriminant analyses
greater than that of multiple regression analysis
Logistic regression and artificial neural networks
The
predictive
ability
of
artificial
neural
networks is stronger than that of logistic regression The most important ratio in determining failure is
Logistic regression
the liquidity ratio Differences between two groups of businesses
İçerli & Akkaya
1990-2003
are detected based on current ratio, acid-test
Z-test
ratio,
receivables
turnover
ratio
and
liabilities-to-assets ratio Ekinci et al. (2008) Vuran (2009)
Albayrak & Yılmaz
2000 1997-2007
2004-2006
Artificial neural networks can be used to predict
Artificial neural networks Discriminant
and
company failures logistic
regression analyses
The profitability ratio prevailed as the most significant indicator in both years
Decision tree
Determined
the
companies
operating
key
variables in
separating
finance
and
manufacturing industries Akkaya et al. (2010)
1998-2007
Çelik (2010)
1997-2002
Yakut & Elmas (2013)
2005-2008
Neural networks forecasted approximately 82%
Neural networks Discriminant
of failures correctly regression
and
artificial neural networks
Both models classified firms accurately in 88.9% of cases and both models can be used to predict failure in the banking industry
Discriminant regression and art.
Artificial neural networks yield better results
neural networks
than discriminant regression EBITDA I / total assets, Cash flows from
Öcal (2014)
2007-2013
Logistic regression
operations / total liabilities, Total liabilities / total assets and Net sales / short-term liabilities can be used to predict financial failure
Note. The table has been expanded using information from the work of Ekşi (2011).
3. Data Set and Method This study uses the annual financial statements and notes of companies in the manufacturing industry. These statements and notes pertain to the period ranging from 2007 to 2013, and are prepared according to International Financial Reporting Standards (IFRS). The sample consists of the 206 manufacturers listed in the Borsa Istanbul Equity Market. These publicly disclosed financial reports and explanations (balance sheets, income statements, cash flow statements and notes) are obtained from the Borsa Istanbul website (for the period prior to 2009), from the PDP website (from 2010 onward) and by using an analysis program provided by the Financial Information News Network (FINNET). This study calculates 35 financial ratios in 5 groups that may have an effect on financial distress. When determining the financial ratios serving as independent variables, the prominent ratios within the literature were taken into consideration. As IFRS were in effect during the period under examination, it was possible to access data not considered by previous studies such as cash flows resulting from operations/investments and foreign 192
www.ccsenet.org/ijef
International Journal of Economics and Finance
Vol. 7, No. 7; 2015
exchange positions. Table 4 lists the financial ratios used in this study along with their definitions. Table 4. Financial ratios used in this study and their definitions Number
Indep. Var.
Definitions
Financial ratios used to measure the relationship between profit and sales 1
KSA1
2
KSA2
Gross margin / net sales Operating profit / net sales
3
KSA3
Profit before tax / net sales
4
KSA4
Net profit / net sales
5
KSA5
Earnings before interest and taxes (EBIT) / net sales
6
KSA6
EBITDA I / net sales
7
KSA7
EBITDA II (Note 1) / net sales
Financial ratios used to measure the relationship between profit and equity 8
KSE1
Profit before tax / total equity
9
KSE2
Profit after tax / total equity
10
KSE3
Profit after tax / total assets
11
KSE4
EBIT / total assets
12
KSE5
EBITDA I / total assets
13
KSE6
EBITDA II / total assets
Financial ratios used to measure debt coverage 14
BK1
Interest coverage (EBIT / interest expense)
15
BK2
EBITDA / (interest expense + current portion of long-term debt)
16
BK3
Total liabilities / EBITDA II
17
BK4
Assets in foreign currency / liabilities in foreign currency
18
BK5
Cash flows from operating activities / total liabilities
19
BK6
Cash flows from operating activities / (total equity + total liabilities)
20
BK7
Cash flows from operating and investment activities / total equity
Financial ratios used to analyze capital structure 21
SY1
Total liabilities / total equity
22
SY2
Leverage ratio (total liabilities / total assets)
23
SY3
Tangible fixed assets (net) / total equity
24
SY4
Equity structure (shareholder’s equity + capital reserves + revenue-restricted reserves / total equity)
Financial ratios used to analyze liquidity 25
L1
Current ratio (current assets / short-term liabilities)
26
L2
Liquidity ratio (liquid assets + securities + short-term receivables / short-term liabilities)
27
L3
Inventory-dependency rate [short-term liabilities - (liquid assets + quick assets) / inventories]
28
L4
Net sales / short-term liabilities
29
L5
Profit after tax / short-term liabilities
30
L6
Receivables turnover rate (net sales / trade receivables)
31
L7
Inventory turnover rate (cost of sales / inventories)
32
L8
Effectiveness rate [1/((1+receivables turnover rate) + (1+inventory turnover rate))]
33
L9
Working capital turnover rate (net sales / current assets)
34
L10
Assets turnover rate (net sales / total assets)
35
L11
Debts turnover rate (cost of sales / trade debts)
This study reviews the news and disclosures found on the Borsa Istanbul and PDP websites relating to the 206 companies selected, market transfers made by Borsa Istanbul and announced on the PDP website, suspension-of-trading announcements on the Borsa Istanbul website. This study defines a company as financially distressed in any of the following circumstances: delisting due to financial distress, market transfer and obligation to make monthly declarations due to financial distress, notice from CMB or Borsa Istanbul to take precautionary measures due to capital loss (Note 2) or application to the courts by authorized bodies of the company. Their status as financially distressed starts at the beginning of the year when the precautionary measure was taken until the time when the precaution was lifted, if such were the case. The dependent variable is whether or not a company’s status is that of financial distress. There are two possible
193
www.ccsenet.org/ijef
International Journal of Economics and Finance
Vol. 7, No. 7; 2015
categories for the independent variable: the value 0 is given to financially distressed companies and the value 1 is given to companies that are not financially distressed. Some data consisting of outliers/extreme values or having some missing values were eliminated from the study. Additionally, the financial ratios of some companies are different, and in order to eliminate their negative effects on the model, all variables are normalized by subtracting the mean and dividing into one standard deviation. As a result, 88.5% (1,149) of the observations are considered successful, while 11.5% (149) of the observations are considered to be unsuccessful companies. Studies and statistical interpretations have found that the greatest danger in performing classification studies that are conducted with data from unbalanced successful and unsuccessful observation numbers is that the classification success rate is higher for the group with the higher observation number, while the success rate is lower for the other group. According to the pre-analysis, this danger exists for our original data set as the number of successful and unsuccessful companies are proportionally unbalanced. It is thought to be beneficial to run a study with a data set in which the number of successful and unsuccessful companies are proportionally balanced. In our study, SPSS Clementine 11 software is used to define a data set that will serve as a representative for all observations. All of the unsuccessful companies are used and 14% of the successful companies are selected randomly to form a subsample consisting of 149 unsuccessful and 157 successful companies. Therefore, balance is ensured and multiple successful companies are preserved within the data set in order to avoiding losing information obtained from the analysis. As a result, a subsample of 306 observations is taken as a basis to form the model. Table 5 gives the descriptive statistics of the variables used. Table 5. Descriptive statistics regarding variables Minimum
Maximum
Mean
Skewness
Kurtosis
1
KSa1
-1.60
1.00
0.15
0.22
-3.04
23.04
2
KSa2
-248.46
2.73
-1.36
16.18
-14.33
214.88
3
KSa3
-224.32
3.08
-1.28
14.30
-14.98
232.50
4
KSa4
-262.59
2.60
-1.32
16.40
-15.80
252.40
5
KSa5
-245.29
2.34
-1.34
15.99
-14.30
213.92
6
KSa6
-6.20
2.13
-0.01
0.53
-7.57
82.78
7
KSa7
-6.20
0.93
-0.01
0.51
-8.64
93.71
8
KSe1
-8.54
42.37
0.14
2.85
12.65
186.88
9
KSe2
-8.63
42.93
0.12
2.87
12.82
190.85
10
KSe3
-4.45
6.81
-0.03
0.54
5.54
113.58
11
KSe4
-2.97
6.80
0.03
0.48
9.70
155.57
12
KSe5
-0.96
0.74
0.05
0.12
-1.54
23.28
13
KSe6
-0.96
0.78
0.05
0.12
-1.40
23.47
14
BK1
-1926.04
65.03
-13.96
138.48
-11.77
151.25
15
BK2
-910.75
174.02
-2.58
60.79
-13.08
194.32
16
BK3
-997.42
889.69
2.47
124.11
0.38
33.51
17
BK4
0.00
1450.20
8.73
94.56
14.74
224.05
18
BK5
-2.67
3.76
0.02
0.54
0.07
14.62
19
BK6
-1.21
0.72
-0.01
0.20
-2.28
11.44
20
BK7
-3.96
3.33
-0.06
0.65
-1.04
10.75
21
SY1
-111.11
188.50
1.13
14.59
6.16
117.53
22
SY2
0.03
12.56
0.87
1.40
5.36
34.48
23
SY3
-15.66
95.84
1.19
6.36
12.59
188.42
24
SY4
-214.38
86.94
0.20
15.12
-10.58
160.87
25
L1
0.01
28.70
1.86
2.66
5.72
46.72
26
L2
0.00
28.21
1.18
2.37
7.76
76.51
27
L3
-422.85
158.40
7.65
33.85
-7.10
105.88
28
L4
0.00
17.26
2.74
2.58
1.84
4.70
29
L5
-20.70
19.40
-0.01
1.92
-0.96
90.75
30
L6
0.00
62.98
7.47
8.80
3.48
14.43
31
L7
0.00
348.09
11.23
29.53
8.03
77.36
32
L8
0.02
0.58
0.17
0.10
1.18
2.21
194
Standard Deviation
www.ccsenet.org/ijef
In nternational Jouurnal of Econom mics and Finance
Vol. 7, No. N 7; 2015
33
L9
0.00
35.22
2.06
2.80
8.05
82.90
34
L10
0.00
4.35
0.85
0.62
1.89
6.68
35
L11
0.00
237.64
8.96
17.59
9.33
111.91
4. Findin ngs and Interp pretation When deevising the moodel, all obseervations (1499 unsuccessfu ul, 1,149 successful and 1,2298 observatiions total) were not used; the anallysis included d 306 observattions (157 succcessful and 14 49 unsuccessfful) constitutin ng 24% of the total ddata. The rem maining observ vations are succcessful comp panies, and theey remained eexcluded from m the set in order to m maintain balannce. The mod del consists off 266 observaations chosen randomly from om the originaal data set, and the reemaining obseervations are used u for testinng purposes (N Note 3). 4.1 Resullts Obtained from fr the C5.0 Decision D Treee Algorithm an nd Interpretatiion
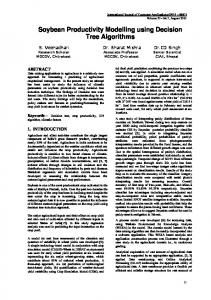
Figure 1. Schema on classification c rrules obtained d by the C5.0 decision d tree aalgorithm 195
www.ccsenet.org/ijef
International Journal of Economics and Finance
Vol. 7, No. 7; 2015
The study applies the C5.0 decision tree algorithm to 266 observations (122 unsuccessful and 144 successful). The process is continued until 10 observations remain on each leaf. Figure 1 displays the schema, and Appendix-1 states the cycle and rule steps of schema. Examining the model, it can be seen that classification is made using variables KSA3, SY2, L9, SY4, L1, BK5 and KSE5. In other words, a company’s status as successful or unsuccessful can be interpreted by values obtained from the following ratios: profit before tax / net sales, leverage ratio (total liabilities / total assets), working capital turnover rate (net sales / current assets), equity structure, current ratio (current assets / short-term liabilities), cash flows from operations / total liabilities and EBITDA I / total assets. Decision trees can be used to predict whether a company will be successful or unsuccessful. Accordingly, this feature of decision trees can be used when rating the companies (Öcal, 2014). From the decision tree shown in Figure 1, it can be seen that 18 different company profiles emerge as a result of the classification of observations within the data set. Table 6 summarizes the company profiles. Table 6. Company profiles obtained from the schema formed by C5.0 decision tree algorithm Profile
Node
KSA3
1
1
≤-0.002
SY2
L9
2
2
>-0.002
3
3
>-0.002
>0.551
4
18
>-0.002
≤0.551
5
4
>-0.002
≤0.551
≤-0.769
6
5
>-0.002
≤0.551
>-0.769
SY4
7
6
>-0.002
≤0.551
>-0.769
≤0.096
8
13
>-0.002
≤0.551
>-0.769
>0.096
L1
SY4
KSE5
9
7
>-0.002
≤0.551
>-0.769
≤0.096
>-0.351
10
12
>-0.002
≤0.551
>-0.769
≤0.096
≤-0.351
11
8
>-0.002
≤0.551
>-0.769
≤0.096
≤-0.351
≤-0.011
12
9
>-0.002
≤0.551
>-0.769
≤0.096
≤-0.351
>-0.011
13
10
>-0.002
≤0.551
>-0.769
≤0.096
≤-0.351
>-0.011
≤-0.161
14
11
>-0.002
≤0.551
>-0.769
≤0.096
≤-0.351
>-0.011
>-0.161
BK5
15
17
>-0.002
≤0.551
>-0.769
>0.096
>0.223
16
14
>-0.002
≤0.551
>-0.769
>0.096
≤0.223
17
15
>-0.002
≤0.551
>-0.769
>0.096
≤0.223
≤-0.226
18
16
>-0.002
≤0.551
>-0.769
>0.096
≤0.223
>-0.226
Profiles 1 and 2 are determined by variable KSA3. Variable KSA3 forms the first profile for observations smaller than or equal to -0.002 and forms the second profile for observations greater than -0.002. The first profile constitutes 46 observations of which 45 (97.8%) are unsuccessful companies. Therefore, companies whose variable KSA3 is under or equal -0.002 can be evaluated as unsuccessful. The second profile is comprised of 220 observations, of which 77 (35%) are unsuccessful and 143 (65%) are successful companies. Additional data is required to designate the companies whose variable KSA3 is greater than -0.002 as successful or unsuccessful. Profiles 3 and 4 are determined by variables KSA3 and SY2. Profile 3 is comprised of companies in Profile 2 (with a KSA3 variable greater than -0.002) of which the SY2 variable is greater than 0.551. Within Profile 3, there are 26 observations, of which 25 (96.15%) are unsuccessful. Therefore, companies with a KSA3 variable greater than -0.002 and an SY2 variable greater than 0.551 can be classified as unsuccessful. Profile 4 is comprised of companies within Profile 2 (with a KSA3 variable greater than -0.002) with an SY2 variable smaller than or equal to 0.551. In Profile 4, there are 194 observations, of which 52 are unsuccessful and 142 are successful. Additional data is required to classify companies with a KSA3 variable greater than -0.002 and same a SY2 variable smaller than or equal to 0.551 as successful or unsuccessful. The following results are obtained when the data tree is interpreted as a whole: a) Companies with a KSA3 variable less than or equal to -0.002 can be classified as unsuccessful (Node 1). b) Companies with a KSA3 variable greater than -0.002 and an SY2 variable greater than 0.551 can be classified as unsuccessful (Node 18). c) Companies with a KSA3 variable greater than -0.002, an SY2 variable less than or equal to 0.551, and an L9 variable less than or equal to -0.769 can be classified as unsuccessful (Node 5). 196
www.ccsenet.org/ijef
In nternational Jouurnal of Econom mics and Finance
Vol. 7, No. N 7; 2015
d) Companies with a KSA3 variable greater thaan -0.002, an SY2 variablee less than orr equal to 0.551, an L9 variable ggreater than -00.769, an SY4 4 variable lesss than or equaal to 0.096 an nd an L1 variaable greater th han -0.351 can be claassified as succcessful (Nodee 12). e) Compaanies with a KSA3 K variable greater than -00.002, an SY2 2 variable less than or equal to 0.551, an L9 L variable greater thaan -0.769, an L1 L variable lesss than or equaal to -0.351, an nd an SY4 variable less than oor equal to -0.011 can be classified as successful (Node ( 8). K variablle greater thaan -0.002, an SY2 variablee less than orr equal to 0.551, an L9 f) Compaanies with a KSA3 variable ggreater than -00.769, an L1 variable v less thhan or equal to t -0.351, an SY4 S variable tthat is both grreater than -0.011 annd less than or o equal to 0.0 096, and a K KSE5 variable less than or equal to -0.1 61 can be claassified as unsuccesssful (Node 100). g) Companies with a KSA3 variable greater thaan -0.002, an SY2 variablee less than orr equal to 0.551, an L9 variable ggreater than -00.769, an L1 variable v less thhan or equal to t -0.351, an SY4 S variable tthat is both grreater than -0.011 annd less than or equal to 0.0 096, and a KS SE5 variable greater g than -0 0.161 can be classified as successful (Node 11). h) Companies with a KSA3 variable greater thaan -0.002, an SY2 variablee less than orr equal to 0.551, an L9 variable ggreater than -00.769, and an SY4 variable greater than 0.223 0 can be classified c as unnsuccessful (N Node 17). i) Compaanies with a KSA3 K variablle greater thaan -0.002, an SY2 variablee less than orr equal to 0.551, an L9 variable ggreater than -00.769, an SY4 4 variable thatt is both greateer than 0.096 and less than or equal to 0.2 223, and a BK5 variiable less thann or equal to -0 0.226 can be cclassified as su uccessful (Node 15). j) Compaanies with a KSA3 K variablle greater thaan -0.002, an SY2 variablee less than orr equal to 0.551, an L9 variable ggreater than -00.769, an SY4 4 variable thatt is both greateer than 0.096 and less than or equal to 0.2 223, and a BK5 variiable greater thhan -0.226 can n be classifiedd as unsuccesssful (Node 16)). As explained above, the analysis iss made using 306 observattions constitutting 24% of tthe entire data set. The remainingg observationns belonging to successfull companies are a left out of o the analysiis in order to o maintain balance. The model coonsists of 266 6 of 306 obserrvations (149 unsuccessful and 157 succcessful). The remaining observations are used for f testing purrposes. Figure 2 displays the success s graph hs obtained froom the trainin ng and testing g sets. The upp ppermost line shows the greatest ddegree of accuuracy possiblee. The area bettween the seco ond line and th he line with a 45-degree an ngle shows the succeess of the moddel. The width of this area iss directly prop portionate to th he success of the model. Accordinng to the graphhs in Figure 1, the C5.0 deccision tree algorithm is high hly effective aat predicting th he success and failurre of companiies. The graph hs demonstratte that it is po ossible to classsify the wholee data set usin ng 60% of the observvations. Accuurate classificaation with littlee data may bee considered a notable succeess.
Figuure 2. Success graphs for traaining and testting sets of scchema formed by C5.0 decission tree algorrithm Table 7 sstates the ratee of accuratee classificationn of training and testing sets s formed bby the C5.0 algorithm. a
197
www.ccsenet.org/ijef
International Journal of Economics and Finance
Vol. 7, No. 7; 2015
According to the results, the model’s classification accurate is 90.97% for the training set and 87.5% for the testing set. Thus, the classifications made by the C5.0 algorithm can be considered successful. Table 7. General accurate classification rates of training and testing sets formed by the C5.0 algorithm Training
Testing
Observed Class
Observation
Percent
Observation
Correct
242
90.97
35
Percent 87.5
Wrong
24
9.03
5
12.5
Total
266
100.00
40
100.00
Table 8 displays the rates of accurate classification obtained from the C5.0 algorithm within the total data set. The general rate of accurate classification is 85.13%, and the accurate classification rate is 92.62% for successful companies and 84.16% for unsuccessful companies. Table 8. Accurate classification rates obtained from the schema formed by the C5.0 algorithm Prediction
0 Observed Class 1
Total Observation
0
1
149
138
11
92.62
7.38
Frequency % Frequency
1149
%
182
967
15.84
84.16
4.2 Results Obtained from CHAID Decision Tree Algorithm and Interpretation As with the C5.0 algorithm, 266 observations are used in the formation of CHAID algorithm model (122 unsuccessful and 144 successful). The process is continued until 10 observations remain on each leaf and 3 classifications emerge (see Figure 3) (Note 4). Appendix-2 lists the cycle and rule steps of the schema obtained. It can be seen that classifications are made by variables L1, BK1, SY3, KSE5, L10, SY2, BK5, KSE2 and L2. In other words, a company’s status as successful or unsuccessful can be interpreted by values obtained from the following ratios: current ratio, interest coverage, tangible fixed assets (net) / total equity, EBITDA I / total assets, assets turnover rate, leverage ratio, cash flows from operations / total liabilities, profit after tax / total equity, and liquidity. In the decision tree shown above, 21 different company profiles emerge from the classification of the data set. Table 9 summarizes the features of each profile. Table 9. Company profiles obtained from the schema formed by the CHAID decision tree algorithm Profile
(Node
L1
1
1
≤-0.556
BK1
2
4
-0.556-0.428
4
2
≤-0.556
≤0.030
5
3
≤-0.556
>0.030
SY3
6
5
-0.556-0.428
≤-0.698
9
12
>-0.428
>-0.698
10
9
>-0.428
≤-0.698
≤-0.970
11
10
>-0.428
≤-0.698
-0.970-0.492
SY2
12
11
>-0.428
≤-0.698
13
13
>-0.428
>-0.698
≤0.315
14
20
>-0.428
>-0.698
0.315-0.428
>-0.698
>0.467
198
BK5
KSE2
L2
www.ccsenet.org/ijef
In nternational Jouurnal of Econom mics and Finance
Vol. 7, No. N 7; 2015
16
14
> >-0.428
>-0.698
≤0.315
≤-0.5587
17
15
> >-0.428
>-0.698
≤0.315
>-0.428
>-0.698
≤0.315
>-0.428
>-0.698
≤0.315
-0.113
20
18
> >-0.428
>-0.698
≤0.315
-0.113
≤-0.462
21
19
> >-0.428
>-0.698
≤0.315
-0.113
>-0.462
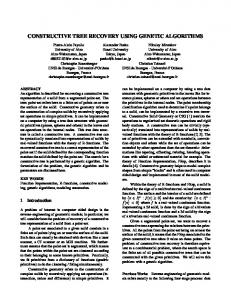
Figure 3. Schema of cllassification ruules obtained from CHAID decision tree algorithm Profiles 11, 2 and 3 are determined by b the L1 variiable, which forms f the firstt profile for obbservations leess than or equal to -0.556. Obserrvations with an L1 variabble ranging fro om -0.556 to -0.428 form tthe second prrofile, and observations with an L1 variable greater than -0.428 form the third pro ofile. Profile 1 is comprissed of 53 observations, of whichh 51 (97.8%) are unsuccesssful companiees. Therefore, companies w with an L1 varriable less than or eqqual to -0.5566 can be classified as unsucccessful. The program p is ex xtended for onne more step in i order to receive a more definitiive result; the 53 companie s that constitu ute the first prrofile are sepaarated by using g the BK1 variable aand a group iss defined that is i composed oof 100% unsuccessful comp panies (Profilee 4).
199
www.ccsenet.org/ijef
International Journal of Economics and Finance
Vol. 7, No. 7; 2015
Profiles 6 and 7 are determined by variables L1 and SY3. Companies with an L1 variable ranging from -0.556 to -0.428 and an SY3 variable equal to or less than 0.047 constitute Profile 6. Companies with an SY3 variable greater than 0.047 constitute Profile 7. Profile 6 is comprised of 12 unsuccessful companies. According to the model, companies with an L1 variable ranging from -0.556 to -0.428 and an SY3 variable equal or less than 0.047 are categorized as unsuccessful. Profile 7 is comprised of 41 observations total, of which 20 (48.78%) are unsuccessful and 21 (51.22%) are successful. At the same time, it is not possible to interpret a company’s status as successful or unsuccessful by using the model if its L1 variable is between -0.556 and -0.428 and its SY3 variable is greater than 0.047. Hence, the model cannot determine an additional variable to facilitate the classification of firms in this group. Profiles 13, 14 and 15 are determined by variables L1, KSE5 and SY2. Companies with an L1 variable greater than -0.428, a KSE5 variable greater than -0.698, and an SY2 variable equal or less than 0.315 constitute Profile 13. Those companies with an SY2 variable ranging from 0.315 to 0.467 constitute Profile 14, and those companies with an SY2 variable greater than 0.467 constitute Profile 15. Profile 13 contains 109 observations, of which 6 (5.51%) are unsuccessful and 103 (94.50%) are successful. According to the model, companies are considered successful when they possess an L1 variable greater than -0.428, a KSE5 variable greater than -0.698, and an SY2 variable equal to or less than 0.315. The program continued classifying using variables BK5, KSE2 and L2. Although a group of 100% successful companies is obtained at the end of the classification process, it is thought that next part of decision tree has no important benefit to the model. The following results are obtained when the data tree is interpreted as a whole: a) Companies with an L1 variable less than or equal to -0.556 and a BK1 variable less than 0.030 can be considered unsuccessful (Node 2). b) Companies with an L1 variable equal to or less than -0.556 and a BK1 variable greater than 0.030 are highly likely to be unsuccessful. However, the possibility of them being successful should not be ignored (Node 3). c) Companies with an L1 variable ranging from -0.556 to -0.428, and an SY3 variable equal to or less than 0.047 can be classified as unsuccessful (Node 5). d) Companies with an L1 variable ranging from -0.556 to -0.428, and an SY3 variable greater than 0.047 cannot be categorized as either successful or unsuccessful using the model (Node 6). e) Companies with an L1 variable greater than -0.428, a KSE5 variable equal to or less than -0.698, and an L10 variable equal to or less than -0.970 can be categorized as unsuccessful (Node 9). f) Companies with an L1 variable greater than -0.428, a KSE5 variable equal to or less than -0.698, and an L10 variable ranging from -0.970 to -0.492 are thought to have a high probability of failure (Node 10). g) Companies with an L1 variable greater than -0.428, a KSE5 variable equal to or less than -0.698, an L10 variable greater than -0.492 are thought to have a high probability of success (Node 11). h) Companies with an L1 variable greater than -0.428, a KSE5 variable greater than -0.698, and an SY2 variable equal to or less than 0.315 are thought to have a high probability of success (Node 13). The program continued classifying using variables BK5, KSE2 and L2. Although a group of 100% successful companies is obtained at the end of the classification process, it is thought that next part of decision tree has no important benefit to the model. i) Companies with an L1 variable greater than -0.428, a KSE5 variable greater than -0.698 and an SY2 variable ranging from 0.315 to 0.467 can be largely considered successful. However, it should be kept in mind that a high margin of error exists (Node 20). j) Companies with an L1 variable greater than -0.428, a KSE5 variable greater than -0.698 and an SY2 variable greater than 0.467 can be considered unsuccessful (Node 21). k) Companies are considered successful if they possess an L1 variable greater than -0.428, a KSE5 variable greater than -0.698, an SY2 variable equal to or less than 0.315, a BK5 variable greater than -0.587, a KSE2 variable greater than -0.113, and an L2 variable greater than -0.462 (Node 19). As with the C5.0 algorithm, the analysis uses 306 observations that constitute 24% of the entire data set. The remaining observations belong to successful companies, and they are excluded from the analysis in order to maintain balance. Of the 306 observations, 266 are chosen to form a training set (49% unsuccessful and 51% successful). The remaining observations comprise a testing set. Figure 4 displays the success graphs obtained from the training and testing sets. The uppermost line shows the
200
www.ccsenet.org/ijef
In nternational Jouurnal of Econom mics and Finance
Vol. 7, No. N 7; 2015
greatest ddegree of accuuracy possiblee. The area bettween the seco ond line and th he line with a 45-degree an ngle shows the succeess of the moddel. The width of this area iss directly prop portionate to th he success of the model. Accordinng to the graphhs in Figure 4, 4 the CHAID algorithm maay be considered highly efffective at pred dicting the success aand failure of companies. The T graphs dem monstrate that it is possiblee to classify thhe whole dataa set using 60% of thhe observationns. Accurate classification w with little dataa may be considered a notabble success.
Figure 4. Success graaphs for trainiing and testingg sets of modeel formed by the t CHAID deecision tree allgorithm Table 10 states the ratee of accurate classification c oof the training g and testing sets formed byy the CHAID algorithm. a Accordinng to the results, the modell’s classificatiion accuracy is 83.03% for the trainingg set and 82.5 5% for the testing seet. Thus, the classifications c s made by thee C5.0 algoritthm can be co onsidered succcessful. Altho ough these rates are less than thoose of the C5.0 algorithm ((90.97% and 87.5%, respeectively) the cclassificationss made by CHAID ccan be consideered successfu ul. Table 10.. General rate of accurate cllassification oof training and d testing sets formed f by the CHAID algorrithm T Training
Testing
Observed Cllass
Observaation
Percentt
Observatio on
Percent
Correct
221
83.08
33
82.5
Wrong
45
1692
7
17.5
Total
266
100.00
40
100.00
Table 11 displays the rates r of accuraate classificatiion obtained from fr the CHAID algorithm within the tottal data set. The geneeral rate of acccurate classiffication is 87. 37%. The acccurate classifiication rate iss 89.03% for successful companiees and 74.50% % for unsucccessful compaanies. Compaaring correct classificationn rates with the t results obtained from the C5.00 algorithm, itt can be seen that the results of CHAID are greater thhan those obtaained from the C5.0 algorithm forr general and successful coompanies, whiile the results of CHAID ar are far below the t results obtained from C5.0 forr unsuccessfull companies. Table 11.. Correct classsification ratio os obtained froom the CHAID D algorithm Prediction
0 Observed Classs 1
Total Observation
0
1
149
111
38
74.50
25.500
Frequ uency % Frequ uency
1149
%
201
126
1023
10.97
89.033
www.ccsenet.org/ijef
International Journal of Economics and Finance
Vol. 7, No. 7; 2015
The C5.0 algorithm model is formed using seven variables, while the CHAID model is formed using nine. The following variables are used both in two models: SY2 (leverage ratio (total liabilities / total assets)), L1 (current ratio (current assets / short=term liabilities)), BK5 (cash flows from operating activities / total liabilities), and KSE5 (EBITDA I / total assets). The following section summarizes the results of the analysis of the C5.0 and CHAID decision tree algorithms. Firstly, as expected, both models classify firms based on the fundamental ratios related to leverage, liquidity, profitability and cash flow. Secondly, the models developed based on C5 and CHAID decision tree algorithms classify both successful and unsuccessful firms with acceptable rates of accuracy. 5. Conclusion Companies tend to operate as if they possess immortality. However, a considerable number of companies have to terminate operations for various reasons. The financial failure of a company affects numerous market participants such as investors, shareholders, workers, creditors, clients and authorizing bodies. Therefore, the failure of a company has an effect on the economy. Globalization and the increase in the number of new, more complex financial instruments compound the effects of failure. Within this context, predicting financial failure attracts the interest of researchers. When predicting financial failure, studies make use of statistical and mathematical methods along with a theoretical approach. Artificial intelligence at has also been used in recent years. This study uses C5.0 and CHAID decision tree algorithms, which have frequently been utilized for classification and prediction studies in recent years. The study tests the status of companies as successful or unsuccessful based on financial capability using more than one defining variable. Thus, our dependent variables consist of two groups. The study uses the annual financial statements and notes of manufacturing companies listed in the Borsa Istanbul Equity Market during the period from 2007 to 2013. These documents are prepared according to IFRS. The 206 manufacturing companies traded on the Borsa Istanbul Equity Market have been selected for the sample provided they were listed for either all of part of the examination period. Publicly disclosed financial statements and their notes (balance sheets, income statements and cash flow statements) are collected, and 35 financial ratios in five categories have been calculated. These ratios comprise the independent variable of the study. They consist of 1,149 observations (88.5%) classified as successful and 149 observations (11.5%) classified as unsuccessful. Rather than use all of the observations (1,298 in total with 149 unsuccessful and 1,149 successful), the study uses 306 observations (157 successful and 149 unsuccessful) comprising roughly 24% of the total data. In order to balance our sample, the remaining observations belonging to successful companies are excluded. The model is composed of 266 observations with 49% belonging to unsuccessful companies and 51% belonging to successful companies. The remaining observations are used for test purposes. Evaluating the model developed using the C5.0 decision tree algorithm, it can be seen that a company’s status as successful or unsuccessful can be determined by values received from the following ratios: profit before tax / net sales, leverage ratio, working capital turnover rate, equity structure, current ratio, cash flow from operations / total liabilities and earnings, and EBITDA I / total assets. The model formed by algorithm C5.0 is applied to whole date set (1,298 observations), producing a general accurate classification rate of 85.13%. The rates of accuracy are 92.62% for successful companies and 84.16% for unsuccessful companies. Evaluating the model developed using the CHAID decision tree algorithm, it can be seen that a company’s status as successful or unsuccessful can be determined by values received from the following ratios: current ratio, interest coverage, tangible fixed assets (net) / total equity, EBITDA I / total assets, assets turnover rate, leverage ratio, cash flows from operations / total liabilities, profit after tax / total equity, and liquidity ratio. The model formed by algorithm CHAID is applied to whole date set (1,298 observations), producing a general accurate classification rate of 87.37%. The rates of accuracy are 74.5% for successful companies and 89.03% for unsuccessful companies. Comparing the results of the models formed by the C5.0 and CHAID algorithms, it can be seen that accurate classification rates are at acceptable levels for both models. Although the CHAID algorithm’s general rate of accuracy and its rate for successful companies are greater than the rates obtained from the C5.0 algorithm for the same observations, the model formed by the C5.0 algorithm can be considered more successful than that of the
202
www.ccsenet.org/ijef
International Journal of Economics and Finance
Vol. 7, No. 7; 2015
CHAID algorithm. This is because the accurate classification rate of the model formed the C5.0 algorithm is far greater than the results obtained for unsuccessful companies from the model formed by the CHAID algorithm. The C5.0 decision tree algorithm predicts company success and failure with an accuracy rate of 85%-93% while the CHAID algorithm does so with an accuracy rate of 75%-89%. It can be concluded that both models classify firms as expected based on fundamental ratios related to leverage, liquidity, profitability and cash flows. Furthermore, the models developed based on decision tree C5.0 and CHAID algorithms can be used for classifying both successful and unsuccessful firms at acceptable levels. We also propose that these models be used for credit rating studies and/or practices and the scoring of firms. References Akkaya, G. C., Demireli, E., & Yakut, Ü. H. (2010). İşletmelerde Finansal Başarısızlık Tahminlemesi: Yapay Sinir Ağları Modeli ile İMKB Üzerine Bir Uygulama. Journal of Eskişehir Osmangazi University Social Sciences, 10(2), 187-216. Aktaş, R. (1993). Endüstri İşletmeleri İçin Mali Başarısızlık Tahmini (Çok Boyutlu Model Uygulaması). Ankara: Türkiye İş Bankası Kültür Yayınları, 323. Aktaş, R., Doganay, M., & Yıldız, B. (2003). Mali Basarısızlıgın Öngörülmesi: İstatistiksel Yöntemler ve Yapay Sinir Ağı Karşılaştırması. Journal of Ankara University Social Sciences, 58(4), 13. Albayrak, A. S., & Yılmaz, Ş. K. (2009). Veri Madenciliği: Karar Ağacı Algoritmaları ve İMKB Verileri Üzerine Bir Uygulama. Journal of Süleyman Demirel University Economics & Administrative Sciences, 14(1), 31-52. Altaş, D., & Giray, S. (2005). Mali Başarısızlığın Çok Değişkenli İstatistiksel Yöntemlerle Belirlenmesi: Tekstil Sektörü Örneği. Journal of Anadolu University Social Sciences, 2, 13-27. Altman, E. I. (1968). The Prediction of Corporate Bankruptcy: A Discriminant Analysis. The Journal of Finance, 23(1), 128. http://dx.doi.org/10.2307/2325319 Altman, E. I., Haldeman, R. G., & Narayanan, P. (1977). ZETATM Analysis: A New Model to identify Bankruptcy Risk of Corporations. Journal of Banking and Finance, 1, 29-54. http://dx.doi.org/10.1016/0378-4266(77)90017-6 Altman, E. I., Marco, G., & Varetto, F. (1994). Corporate Distress Diagnosis: Comparisons Using Linear Discriminant Analysis and Neural Networks. Journal of Banking & Finance, 18, 505-529. http://dx.doi.org/10.1016/0378-4266(94)90007-8 Altman, E., Ling, I. Z., & Yen, J. (2007). Corporate Financial Distress Diagnosis in China. New York University Salomon Center, Working Paper. Bayazıtlı, E., & Ve Özdemir, F. S. (2012). Finansal Başarısızlık Tahminleri Yönüyle UFRS ve Bilginin İhtiyaca Uygunluğu. Journal of Mali Çözüm, 26-27. Beaver, H. W. (1966). Financial Ratios as Predictors of Failure. Journal of Accounting Research, 71-111. http://dx.doi.org/10.2307/2490171 Beaver, W. H., Correia, M., & McNichols, M. (2009). Have Changes in Financial Reporting Attributes Impaired the Ability of Financial Ratios to Assess Distress Risk? Rock Center for Corporate Governance, Working Paper Series. http://dx.doi.org/10.2139/ssrn.1341305 Bee, T. S., & Abdollahi, M. (2013). Corporate Failure Prediction: Malaysia’s Emerging Market. International Journal of Finance, 25(4), 7985-8011. Benli, Y. K. (2005). Bankalarda Mali Başarısızlığın Öngörülmesi Lojistik Regresyon ve Yapay Sinir Ağı Karşılaştırması. Journal of Gazi University Industrial Arts Education Faculty, 16, 31-46. Blum, M. (1974). Failing Company Discriminate Analysis. Jouarnal of Accounting Research, 1-25. http://dx.doi.org/10.2307/2490525 Bounsaythip, C., & Rinta-Runsala, E. (2001). Overview of Data Mining For Customer Behavior Modeling, VTT. Information Technology Research Report, 1, 18. Casey, C., & Bartczak, N. (1985). Using Operating Cash Flow Data to Predict Financial Distress: Some Extensions. Journal of Accounting Research, 23(1), 384-401. http://dx.doi.org/10.2307/2490926 Çelik, M. K. (2010). Bankaların Finansal Başarısızlıklarının Geleneksel ve Yeni Yöntemlerle Öngörüsü. Journal
203
www.ccsenet.org/ijef
International Journal of Economics and Finance
Vol. 7, No. 7; 2015
of Management & Economics, 17(2), 129-143. Chen, M. Y. (2011). Predicting corporate financial distress based on integration of decision tree classification and logistic regression. Expert Systems with Applications. 38, 11261-11272. http://dx.doi.org/10.1016/j.eswa.2011.02.173 Chen, W. S., & Du, Y. K. (2009). Using Neural Networks and Data Mining Techniques for the Financial Distress Prediction Model. Expert Systems with Applications. 36. 4075-4086. http://dx.doi.org/10.1016/j.eswa.2008.03.020 Deakin, E. B. (1976). Distributions of Financial Accounting Ratios: Some Empirical Evidence. The Accounting Review, 90-96. Edminister, R. O. (1972). An Empirical Test of Financial Ratio Analysis of Small Business Failure Prediction. Journal of Financial and Quantitative Analysis, 1477-1493. http://dx.doi.org/10.2307/2329929 Ekinci, Y., Temur, G. T., Çelebi, D., & Bayraktar, D. (2008). Ekonomik Kriz Döneminde Firma Başarısı Tahmini: Yapay Sinir Ağları Tabanlı Bir Yaklaşım. Journal of Industrial Engineering, 21(1), 17-29. Ekşi, İ. H. (2011). Classification of Firm Failure with Classification and Regression Trees. International Research Journal of Finance and Economics, 76, 113-120. Elam, R. (1975). The Effect of Lease Data on the Predictive Ability of Financial Ratios. The Accounting Review, 50(1), 25-43. Emel, G. G., & Taşkın, Ç. (2005). Veri Madenciliğinde Karar Ağaçları ve Bir Satış Analizi Uygulaması. Journal of Eskişehir Osmangazi University Social Sciences, 6(2), 228-229. George, F. (1986). Financial Statement Analysis (2nd ed.). New Jersey, Englewood Cliffs, Prentice-Hall International, 546. Gepp, A., Kumar, K., & Bhattacharya, S. (2010). Business Failure Prediction Using Decision Trees. Journal of Forecasting, 29, 536-555. http://dx.doi.org/10.1002/for.1153 İçerli, M. Y., & Akkaya, G. C. (2006). Finansal Açıdan Başarılı Olan İşletmelerle Başarısız Olan İşletmeler Arasında Finansal Oranlar Yardımıyla Farklılıkların Tespiti. Journal of Economics & Administrative Sciences, 20(1), 413-421. Jones, S., & Maurice, P. (2014). Predicting Corporate Bankruptcy Risk in Australia: A Latent Class Analysis. Journal of Applied Management Accounting Research, 12(1), 13-25. Koyuncugil, A. S. (2007). Veri Madenciliği ve Sermaye Piyasalarına Uygulanması. Capital Market Board of Turkey, Working Paper, 8. Koyuncugil, A. S., & Özgülbaş, N. (2008). İMKB’ de işlem gören KOBİ’ lerin güçlü ve zayıf yönleri: CHAID karar ağacı uygulaması. Journal of Dokuz Eylül University Economics & Administrative Sciences, 23(1). Lin, Y. F., & McClean, S. (2001). A Data Mining Approach to the prediction of corporate failure. Knowledge-Based Systems, 14, 189-195. http://dx.doi.org/10.1016/S0950-7051(01)00096-X Mahdi, S., & Fezeh, Z. F. (2013). A Comparative Analysis of Corporate Failure Prediction: A Case from Iran. IUP Journal of Business Strategy, 10(3), 19-31. Nguyen, H. G. (2005). Using Neutral Network in Predicting Corporate Failure. Journal of Social Sciences, 1(4), 199-202. http://dx.doi.org/10.3844/jssp.2005.199.202 Öcal, N. (2014). Firma Derecelendirmesi ve Borsa İstanbul’da İmalat Sektörü için Model Önerisi. Unpublished PHD’s Thesis, Gazi University, Institute of Social Sciences, Department of Business Administration, Accounting and Finance, Ankara. Ohlson, J. A. (1980). Financial Ratios and the Probabilistic Prediction of Bankruptcy. Journal of Accounting Research, Spring, 109-111. http://dx.doi.org/10.2307/2490395 Ooghe, H., Spaenjers, C., & Vandermoere, P. (2005). Business Failure Prediction: Simple-Intuitive Models versus Statistical Models. Faculteit Economie En Bedrijfskunde, Universiteit Gent. 11. Özdemir, F. S. (2011). Finansal Başarısızlık ve Finansal Tablolara Dayalı Tahmin Yöntemleri. Ankara: Siyasal Kitapevi, 82. Sun, J., & Hui, L. (2006). Data Mining method for listed companies’ financial distress prediction. Knowledge Based Systems, 21, 1-5. http://dx.doi.org/10.1016/j.knosys.2006.11.003
204
www.ccsenet.org/ijef
International Journal of Economics and Finance
Vol. 7, No. 7; 2015
Taffler, R. J. (1982). Forecasting Company Failure in the UK Using Discriminant Analysis and Financial Ratio Data. Journal of the Royal Statistical Society, 145(3), 342-358. http://dx.doi.org/10.2307/2981867 Vuran, B. (2009). Prediction of Business Failure: A Comparison of Discriminant and Logistic Regression Analyses. Journal of Istanbul University School of Business Administration, 38(1), 47-65. Web
Site. (n.d.). Borsa İstanbul Corp. Firm Disclosures. Retrieved from http://www.borsaistanbul.com/yatirimcilar/sirket-haberleri-arsiv, accesses within November 2013- January 2014.
Web
Site. (n.d.). Borsa İstanbul Corp. Markets. Retrieved http://www.borsaistanbul.com/urunler-ve-piyasalar/piyasalar/pay-piyasasi accesses on 29.09.2014
Web
Site. (n.d.). Public Disclosure Platform. Firm Disclosures. Retrieved from http://www.kap.gov.tr/bildirim-sorgulari/sirket-haberleri.aspx accesses within November 2013- January 2013
Web
Site. (n.d.). Borsa İstanbul Corp. Firm Data. Retrieved from http://www.borsaistanbul.com/veriler/verileralt/hisse-senetleri-piyasasi-verileri/sirketler-verileri, accesses within of November 2013-January 2014
from
Wilcox, J. (1970). A Simple Theory of Financial Ratios as Predictors of Failure. Working Paper, Alfred P. Sloan School of Management. http://dx.doi.org/10.2307/2489944 Wu, Y., Gaunt, C., & Stephen, G. (2010). A Comparison of Alternative Bankruptcy Prediction Models. Journal of Contemporary Accounting & Economics, 6(1), 34-45. http://dx.doi.org/10.1016/j.jcae.2010.04.002 Yakut, E., & Elmas, B. ( 2013). İşletmelerin Finansal Başarısızlığının Veri Madenciliği Ve Diskriminant Analizi Modelleri İle Tahmin Edilmesi. Journal of Afyon Kocatepe University Economics & Administrative Sciences, 15(1), 237-254. Zmijewski, M. E. (1984). Methodolojical Issues Related to the Estimation of Financial Distress Prediction Models. Journal of Accounting Research, 22. http://dx.doi.org/10.2307/2490859 Notes Note 1. The difference between EBITDA I and EBITDA II is that EBITDA II consists of termination provisions for severance payments. Note 2. Although the erosion of capital is a quantitative indicator, in our study it is interpreted as a qualitative indicator. That is, whether or not and to what extent capital has eroded. Note 3. SPSS Clementine 11 software is used for the study. Note 4. It is a matter of the researcher’s preference as to the number of classification branches included in the CHAID algorithm, which consists two of steps and works has been developed as a solution to the shortcomings of decision tree algorithms. Three categories have been defined for the purposes of this study to avoid the complications that arise as amount of branches increases. Appendix A. Cycle And Rule Steps of Received C5 Algorithm Model KSA3 0 (46; 0.978) KSA3 > -0.0022480 [ Mode: 1 ] (220) SY2 -0.7686370 [ Mode: 1 ] (179) SY4 -0.1614340 [ Mode: 1 ] => 1 (11; 0.818) L1 > -0.3509390 [ Mode: 1 ] => 1 (97; 0.979) SY4 > 0.0955960 [ Mode: 0 ] (43) SY4 -0.2259960 [ Mode: 0 ] => 0 (14; 0.714) SY4 > 0.2230870 [ Mode: 0 ] => 0 (15; 0.867) Appendix B. Cycle And Rule Steps Of Received CHAID Algorithm Model L1 0.0298794 [ Mode: 0 ] => 0 (7; 0.714) L1 > -0.5563343 and L1 0.0474820 [ Mode: 1 ] => 1 (41; 0.512) L1 > -0.4277993 [ Mode: 1 ] (160) KSE5 -0.9700303 and L10 0 (8; 0.75) L10 > -0.4922527 [ Mode: 1 ] => 1 (14; 0.786) KSE5 > -0.6984666 [ Mode: 1 ] (122) SY2 -0.5865755 [ Mode: 1 ] (101) KSE2 1 (6; 0.667) KSE2 > -0.1125561 [ Mode: 1 ] (95) L2 1 (4; 0.75) L2 > -0.4623737 [ Mode: 1 ] => 1 (91; 1.0) SY2 > 0.3154006 and SY2 1 (7; 0.714) SY2 > 0.4670385 [ Mode: 0 ] => 0 (6; 1.0) Copyrights Copyright for this article is retained by the author(s), with first publication rights granted to the journal. This is an open-access article distributed under the terms and conditions of the Creative Commons Attribution license (http://creativecommons.org/licenses/by/3.0/).
206