to assign reliable porosity values to particle packs, which are not entirely consolidated. However, as soon as ... The bottom and the top of the unit cell are treated as .... different simulations reach an optimal value after about 100000 iterations.
PREDICTING INITIAL POROSITY AS A FUNCTION OF GRAIN-SIZE DISTRIBUTION FROM SIMULATIONS OF RANDOM SPHERE PACKS Luc Alberts & Gert Jan Weltje Department of Applied Earth Sciences, Delft University of Technology PO Box 5028, NL-2600 GA Delft, The Netherlands
1. SUMMARY
In this paper we present a model developed to predict the porosity of a sample of particles shortly after deposition. The concept of the model is based on sphere packing models, which have been developed in powder technology to predict physical properties of realistic porous media. A unit cell -representing a thin layer of grains- is randomly filled with spheres obeying an arbitrary grain size distribution, after which simulation of rearrangement processes creates a gravitationally stable packing. The current model allows us to simulate the complete porosity decline starting from a random loose packing until a random close packing is reached. The results indicate that the behavior of the model is very dynamic and that the stop criterion for the algorithm is a very important factor to assign reliable porosity values to particle packs, which are not entirely consolidated. However, as soon as we are able to define appropriate stop criteria for different depths in active sedimentary environments, we believe we will be capable of predicting porosities for a complete sedimentary profile. 2. INTRODUCTION
Prediction of porosity and permeability in subsurface deposits is of prime importance to hydrologists and reservoir engineers. These variables are notoriously difficult to predict on account of the large number of factors that influence the pore-size and shape distributions during and after deposition. Recent advancement of sedimentary process-response simulators has resulted in algorithms that are capable of handling grains of different sizes and densities (Harbaugh, et al, 1999; Syvitski and Bahr, 2001; Storms et al, in press). Successful application of such algorithms to problems in hydrology and reservoir engineering requires more accurate predictions of initial porosity for arbitrary grain-size distributions. This allows one to make better use of the many compaction models that predict the evolution of porosity with increasing depth, whether it will be a very detailed many-parameter model or a simple exponential model (Bahr et al, 2001). The depositional or initial porosity is defined as the porosity of sediments at the earth’s surface directly after deposition. The usual approach to estimating initial porosities is based on in-situ or laboratory measurements of sediments (Atkins & McBride, 1992; Pryor, 1973; Beard & Weyl, 1973). In our opinion these methods are questionable to use as a basis for compaction modeling. It is a) very difficult to get undisturbed field samples, b) almost impossible to construct random packings in the laboratory, and c) nearly impossible to measure every conceivable grain-size distribution in the reservoir. In this paper we present a numerical model that enables us to predict the initial porosity of sediments consisting of spherical grains with arbitrary size distributions.
3. MODEL APPROACH
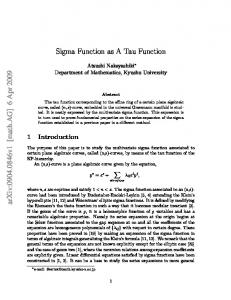
Many sphere-packing models have been constructed in the past to study numerous different properties of porous media. One of the most common methods of computational sphere pack generation is the sequential deposition method or “rain” model based on algorithms of Bennett (1972) and Matheson (1974). The sphere pack is assembled and the spheres undergo no further changes, therefore this can be considered as a static model. The same classification is valid for several alternative methods of sphere pack generation (e.g., Tacher et al, 1997; Finney, 1970). Static lattices are suitable for many studies, because generation of such lattices takes little calculation time and they represent solid porous media well. However, for the purpose of studying the porosity of shallow sediments these static models are not very useful, because many processes continue to change the lattice after deposition. The concept of our model is based on the work of Nolan & Kavanagh (1992, 1993), where spheres are randomly placed in a cylinder resulting in a lattice with large overlaps between the spheres and many unstable spheres. An iterative process gradually transforms the pack into a gravitationally stable and overlap free configuration, by moving, dropping or rolling each sphere by a small increment. For our purpose the model of Nolan & Kavanagh (1993) needed to be adapted and was rewritten in C++ using an object-based approach. The input algorithms were changed to enable the generation of lattices consisting of spheres obeying any desired size distribution. A second and more fundamental change was the implementation of periodic boundary conditions in x- and ydirections to avoid any wall effects. Some other minor modifications were applied to several algorithms mostly for reasons of easier calibration. Nevertheless, the general procedure illustrated in the flow chart (Figure 1) is rather similar to the original model. Spheres with radii picked from a distribution curve are randomly positioned in a unit cell of specified dimensions. The initial packing configuration can be determined by varying the percentage of volume of the cell that will be occupied by spheres. Changing the dimensions of the unit cell will then determine the number of spheres in the pack. After placement, the spheres in the pack will have large overlaps and as a result experience forces to reduce this overlap. The vector sum of the forces acting on a sphere determines in which direction a sphere will move; the average overlap of the sphere with its contacting neighbors determines the distance it will move. The bottom and the top of the unit cell are treated as “mattresses” which push the spheres back into the pack; the upper “mattress” will move along with the highest sphere in the pack. If after movement the sphere is unstable and the average overlap with its contacts is small, the sphere is allowed to roll or drop, depending on whether the sphere has a contact below it or not. At the beginning of each iteration the pack can be compressed or dilated by a small amount to simulate shaking or pounding. The process of moving, rolling and dropping continues until the stop criterion has been met. A logical criterion to stop is when the mean overlap of the pack is very small and the stability of the pack is very large. However, it is also interesting to see the change in porosity after a large number of iterations. How these iterations can be related to a time scale is still an issue for further research. The model typically calculates 10000 iterations per hour for a population of 1000 spheres on a Pentium III-800Mhz computer.
Figure 1 Flowchart of the model (see text for details). 4. RESULTS
The development of porosity as a result of the rearrangement of the spheres was plotted against the number of iterations. The different states of the packing during the process can be represented in a plot of porosity against the mean coordination number (average number of contacts per sphere). Visual analysis of the packings was possible by using VRML-files (see CD-ROM for examples); screenshots of a binary packing before and after numerous iterations are shown in Figure 2.
Figure 2 3D-visualization of the model applied on a binary mixture (diameter ratio 1:3; fraction of large spheres 0.75) (A) before and (B) after 20000 iterations.
The behavior of the model was tested by variation of several parameters compared to a base case. We chose to limit the first simulations to packings of equal spheres and binary mixtures, because much theoretical and laboratory research has been focused on these types of packing (see Cumberland and Crawford, 1987; and references therein). For the base case we took a packing of about 800 equal spheres with a fixed random seed, where the initial fill of the unit cell was set to 50%. The only active rearrangement process in the base case was rolling; no compression was applied. Figure 3 shows that the model simulates a realistic porosity decline, although after as many as 80000 iterations the pack has not yet reached a optimal porosity. Prolonged simulation runs show that for different cases the optimal packing configuration is reached after about 100000 iterations (see Figure 7). The trajectory through the plane characterized by porosity and mean coordination number in Figure 4 falls inside the boundaries of random packing defined by Nolan & Kavanagh (1992). As a result of rolling many bridges are formed and the final state of the model will be a bridged random close packing. Nolan & Kavanagh (1992) varied the initial fill of their cylinder to simulate any random packing between random loose packing and random close packing; variations of initial fill shown in Figure 4 indicate that this was mainly determined by the choice of the stop criterion. An increased initial fill indeed results in closer packing densities initially, but a prolonged simulation time will eventually result in a bridged random close packing. The result of simulations for the same conditions with only a different random initial position of the spheres in the pack, at the stop criterion of a gravitational stability of 99% of the spheres and a mean overlap of lower than 0.4% of the sphere radius, shows a considerable range of porosity values at convergence (Figure 5). The agreement of the range of porosities (43%-48%) with the measurements of Atkins and McBride (1992) must be considered with care, especially since the starting porosity of the simulation also varies due to differences in mean overlap as a result of random positioning. The general trend of porosity decrease and decrease of standard deviation is encouraging, however, and may be used to derive a measure of uncertainty of the simulated values.
Porosity decrease 0.55
porosity
0.5
0.45
0.4
0.35
0.3 0
10000
20000
30000
40000
50000
60000
70000
80000
90000
# of iterations
Figure 3 Porosity decrease as a result of the iterative process for the base case model.
Packing State 13 Initial Box Fill 50% Initial Box Fill 55% Initial Box Fill 60% Cubic Orthorombic Tetragonalsphenoidal Rombohedral
12
10 9 8
Bridge-free Loose Random Packing
7
Random Close Packing
6
Angular separation Bridging Random Loose Packing
0.55
0.5
0.45
0.4
Bridging
5
Bridged Random Close Packing
4
0.35
0.3
coordination number
11
3 0.25
porosity
Figure 4 Characteristics of the sphere packings produced by the model during the iteration process for the base case and two simulations, which started with a higher initial fill of the unit cell. The location of the models results are compared to regular packings of mono-sized spheres (Cumberland and Crawford, 1987 p.16) and the boundaries of random packing (Nolan & Kavanagh, 1992).
Porosity of 20 different random packs 0.54
0.014
0.52
0.012
0.5
0.01
0.48
0.008
0.46
0.006
0.44
0.004 Average porosity
0.42
std deviation
porosity
(stop criterium: 99% stability & less than 0.4% overlap)
0.002
Standard deviation 0.4 10
100
1000
0 10000
iterations
Figure 5 Average porosity and standard deviation for 20 simulations with a different random seed. The black points show the porosity value for each simulation, when it has reached a high stability and a low mean overlap.
While Figure 4 shows the trajectory of rearrangement leading to bridged random close packing, occurrences of random close packing without bridging of particles can also exist. Changes in the load on a sediment pack due to erosion or sedimentation or the pounding of waves could cause an extra compression or relaxation of the deposits. The response of the model to vertical compression appears to be different and a tighter packing characterized by a lower porosity and a higher mean coordination number is eventually formed (Figure 6 and 7). Similarly, by restricting the capability of particles to roll, tumble or slide down, a packing without appreciable bridging is produced. 5. DISCUSSION AND CONCLUSIONS
We have presented a model that is capable of simulating the rearrangement process of a pack of particles realistically. It showed that the trajectory through the plane of porosity versus the mean coordination number moves from a random loose packing to a bridged random close packing when no additional compression is applied to the pack, and from a random loose packing to a random close packing when compression is applied. The porosity of the pack during the rearrangement process decreases from 50% to about 35%. Another conclusion that can be drawn from the results of the current model is that the stop criterion is the most important variable to determine the simulated porosity at a specified time. For a representative prediction of porosities near the surface of a sedimentary environment a better insight into the effects of using different stop criteria is needed. Once this is known the effect of different grain size distributions on porosity can be evaluated.
Porosity decrease 0.53 0.51 0.49 0.47
porosity
0.45 0.43
seed 2: rolled not shaken
0.41
seed 3: rolled not shaken
0.39
seed 3: shaken not rolled
0.37 0.35
seed 3: shaken & rolled seed 3: nor shaken neither rolled
0.33 100
1000
10000
100000
1000000
iterations
Figure 6 Effect of different rearrangement processes on the porosity decrease of the pack. Notice that the different simulations reach an optimal value after about 100000 iterations.
Packing state 7 rolled not shaken shaken & rolled shaken not rolled nor shaken neither rolled
6.5
5.5 5 4.5 4 3.5 3 2.5 2 0.55
0.5
0.45
0.4
0.35
porosity
Figure 7 Effect of different rearrangement processes on the type of packing.
0.3
coordination number
6
6. ACKNOWLEDGMENTS
We thank Peter Kavanagh and Gary Nolan for providing us with the source code of their model, which formed the point of departure in the development of our model. 7. REFERENCES
Atkins, J.E. and McBride, E.F. (1992) Porosity and packing of Holocene river, dune, and beach sands: AAPG Bulletin, v.76, p. 339-355. Bahr, D.B., Hutton, E.W.H., Syvitski, J.P.M. and Pratson, L.F. (2001) Exponential approximations to compacted sediment porosity profiles: Computers & Geoscience, 27, p. 691700. Beard, D.C. and Weyl, P.K. (1973) Influence of texture on porosity and permeability of unconsolidated sand: AAPG Bulletin, v.57, p. 349-369. Bennett, C.H. (1972) Serially deposited amorphous aggregates of hard spheres: J. Appl. Phys., 43, p. 2727-2734. Cumberland, D.J. and Crawford, R.J. (1987) “The packing of particles”, Elsevier, Amsterdam. 148pp. Finney, J.L. (1970) Random packings and the structure of simple liquids I. The geometry of random close packing: Proc. Roy. Soc. Lond. A, 319, p. 479-493. Harbaugh, J.W., Watney, W.L., Rankey, E.C., Slingerland, R., Goldstein, R.H. and Franseen, E.K., (editors) (1999) “Numerical experiments in stratigraphy: Recent advances in stratigraphic and sedimentologic computer simulations”, SEPM Special Publication No. 62, Tulsa, Oklahoma, U.S.A., 362pp. Matheson, A.J. (1974) Computation of a random packing of hard spheres: J. Phys. C: Solid State Phys., 7, p. 2569-2576. Nolan, G.T. and Kavanagh, P.E. (1992) Computer simulation of random packing of hard spheres: Powder Technology, 72, p 149-155. Nolan, G.T. and Kavanagh, P.E. (1993) Computer simulation of random packings of spheres with log-normal distributions: Powder Technology, 76, p. 309-316. Pryor, W.A. (1973) Permeability-porosity patterns and variations in some Holocene sand bodies: AAPG Bulletin, v.57, p. 162-189. Storms, J.E.A., Weltje, G.J., van Dijke, J.J., Geel, C.R. and Kroonenberg, S.B. (2002) Processresponse modeling of wave-dominated coastal systems: simulating evolution and stratigraphy on geological time scales: Journal of Sedimentary Research, March 2002. Syvitski, J.P.R. and Bahr, D.B. (editors) (2001) “Numerical models of marine sediment transport and deposition”, Computers & Geoscience, 27-6.
Tacher, L., Perrochet, P. and Parriaux, A. (1997) Generation of granular media: Transport in Porous Media, 26, p. 99-107.