38 R. Auhl, R. Everaers, G. S. Grest, K. Kremer and S. J. Plimpton,. J. Chem. Phys., 2003, 119, 12718â12728. 3926 | Soft Matter, 2009, 5, 3920â3926.
PAPER
www.rsc.org/softmatter | Soft Matter
Predicting polymer dynamics at multiple length and time scales Vagelis A. Harmandarisab and Kurt Kremera Received 16th March 2009, Accepted 3rd June 2009 First published as an Advance Article on the web 14th July 2009 DOI: 10.1039/b905361a Soft condensed matter, involving such diverse systems as synthetic or biological macromolecules to colloids, is a fast growing research area due to its scientific and technological relevance. Beyond scaling theories of simple model systems the dynamics and rheology of complex fluids have been extensively studied through various experimental techniques and computer simulations. While these techniques typically address a single dynamic quantity it is a challenge to develop simulation methodologies that can directly access different dynamic quantities as well as a broad range of length and time scales of specific systems. Here we present a hierarchical simulation approach to overcome these problems. We predict polymer dynamics over a broad spectrum of length and time scales ranging from segmental relaxation on the monomer level to long time chain diffusion. As an example we study various dynamical modes of atactic polystyrene melts of molecular weights relevant to polymer processing (up to 50,000 g/mol) without any adjustable parameter and compare the results to experiments.
1 Introduction Soft condensed matter systems are complex fluids of amazing diversity, ranging from polymers to colloids, emulsions, surfactants, etc. and varying in their applications over a range of industrial systems such as plastic coatings, foodstuff, biological materials, cosmetics, etc. A common characteristic of all these systems is that they possess structural, mechanical, and rheological properties that are intermediate between ordinary liquids and solids, i.e. they are viscoelastic fluids.1 The dynamics of such systems, is a prototypical soft matter problem and has attracted considerable experimental and theoretical attention for many years.1–6 However, despite its huge technical and scientific relevance, a direct quantitative link between chemical structure at the molecular level and measurable dynamic quantities (like segmental correlation or diffusion constants) over a broad range of length and time scales is still missing. Such a knowledge would be especially important for processing which is dominated by rheological properties. This is a situation, where well tailored computer simulations could be of significant help. On the microscopic level, detailed atomistic molecular dynamics (MD) simulations allow quantitative predictions of the dynamics of simple polymers, like polyethylene and polybutadiene, over a broad range of time scales.7–10 Polymers like poly(methyl methacrylate), and poly(vinyl acetate) with rather low molecular weights have also been studied with atomistic MD simulations but for rather shorter time scales of about 10�8 s.11–13 However, due to the broad spectrum of characteristic lengths and times involved in polymeric systems, it is not feasible to apply them to systems of a more complex chemical structure and with high molecular weight. On the mesoscopic level, coarse-grained
a Max Planck Institute for Polymer Research, Ackermannweg 10, D-55128 Mainz, Germany b Department of Applied Mathematics, University of Crete, 71110 Heraklion, Greece
3920 | Soft Matter, 2009, 5, 3920–3926
(CG) molecular dynamics and Monte Carlo simulations have proven to be very efficient means to study the dynamics of long, entangled simple model polymer systems.4,14 Coarser particle models, where the chemistry takes place through some phenomenological parameters, have also been developed.15–17 The parameters characterizing such models are usually obtained by fitting of a dynamic quantity to experimental data and suffer from the fact that they cannot be directly linked to microscopic details. The general challenge for soft condensed matter simulations is the development of methodologies that can directly study a broad range of length and time scales of specific systems without adjustable parameters and by that become truly predictive. For this reason several structure-based CG models have been employed to study specific polymer systems,18–26 where groups of chemically connected atoms are lumped into ‘superatoms’. The direct link to the chemistry, in structure-based CG models, is maintained through effective bonded and non-bonded temperature dependent potentials (more precisely free energies), which are obtained by averaging over microscopic details of the underlying atomistic models. By doing that structural properties of polymeric systems are described quite well. But such CG simulations cannot be used for a direct quantitative study of dynamics because the intrinsic time scale of the CG model is not the same as that of the underlying chemical system. The reason is that due to the reduced degrees of freedom in the CG description, the friction between the CG beads is significantly reduced compared to what it would be if the monomers were represented in full atomistic detail. To overcome this limitation the ratio between the CG time scale and the time of the underlying chemical system has to be derived from experiments or atomistic simulations.19,21–27 However a direct comparison of the resulting dynamics without resorting to experimental input, both at the segmental level and for the long-time chain diffusion, is still missing. In this paper we present a hierarchical methodology that combines dynamic simulations, on different length and time This journal is ª The Royal Society of Chemistry 2009
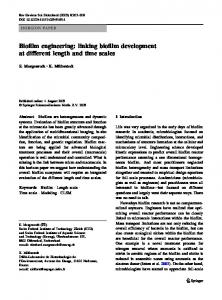
Fig. 1 Coarse-grained mapping scheme for PS: one monomer is mapped ˚ , mA ¼ 27 amu and sB ¼ 5.2 A ˚, to two different CG beads (sA ¼ 4.1 A mB ¼ 77 amu).24 CG bonds are shown with thick dashed lines.
scales. This approach allows us to predict through CG simulations, not only qualitatively, but also quantitatively, the dynamics of polymer systems of molecular weight relevant to polymer processing without any adjustable parameters, for a very broad range of length and time scales. As an example the whole methodology is applied in atactic polystyrene (PS), which has been extensively studied in the past through experiments (see for example ref. 3, 28–32 and references within) and is one of the most important polymer materials. CG MD simulations have been performed using a CG representation for PS that does not lose too many structural details, i.e. one PS monomer is mapped onto two effective coarse grained beads24 (see Fig. 1). Using this CG model the overall speed-up that can be achieved compared to atomistic simulations, due to the larger integration time step, the reduced degrees of freedom and the smoother interaction potentials, is about four orders of magnitude,27 allowing the study of well equilibrated long chain melts.
2 Simulation methodology In order to derive a time scaling factor S between different models we match the mean square displacements of the monomers in amplitude and slope. Both are important, since the motion characteristics of the different models coincides only above a characteristic length scale. Here we use a three level ansatz which combines all-atom (AA), united atom (UA) and CG MD simulations in order to fully describe the dynamics of short and long polymer chains, which therefore also exhibit different melt densities affecting the friction as well. First, detailed all atom simulations, are performed for short PS chains (M ¼ 1 kDa ¼ 1000 g/mol, only 10 repeat units) since only for such small chains reliable data for the mean square displacement of the monomers can be obtained with all-atom MD simulations. Then, united atom MD simulations, where hydrogens are lumped together with the carbons, defining new CHx united atoms, for various systems, with molecular weight from 1 kDa to 10 kDa are performed. Beyond that CG models are used, which however do not reproduce the motion patterns down to length scales of the order of one or two monomers. The molecular dynamics package GROMACS33 was used to perform all the atomistic (AA and UA) MD simulations. Initial This journal is ª The Royal Society of Chemistry 2009
well-equilibrated atomistic polymer melts are obtained by backmapping CG melts.23 All simulations have been performed at constant temperature and volume (NVT ensemble) at experimental densities.27,34 CG MD simulations have been performed using a CG model for PS in which one PS monomer is mapped onto two effective coarse grained beads, i.e. a 2:1 model24 (see Fig. 1). CG bead ‘‘A’’ corresponds to the CH2 of a PS monomer plus the half mass of each of the two neighboring CH groups along the chain backbone, whereas CG bead ‘‘B’’ is the phenyl ring. CG interactions have been developed by employing a structure-based CG methodology that combines atomistic and CG simulations.24 This model does not lose too many structural details in comparison to all atom systems, while still being very efficient compared to atomistic simulations. Various monodisperse atactic PS melts, with molecular weight from 1 kDa up to 50 kDa, at T ¼ 463 K have been studied with CG MD simulations. Note that the characteristic molecular weight Me for the formation of entanglements for atactic PS is about 15 kDa (at � to T ¼ 463 K).32 The size of the simulated box varies from 96.4 A � The chosen temperature is a typical process tempera162.26 A. ture for PS. CG MD simulations are performed in dimensionless LJ units using mA to scale all masses, sAV ¼ (sA + sB)/2 to scale all lengths and 3 ¼ kT to scale all energies. All CG MD simulations are performed using the ESPResSO package35 with qffiffiffiffiffiffiffiffiffiffiffiffiffiffiffiffiffiffiffi a time step Dt ¼ 0.01 s, with s ¼ mA s2AV =3, for times between 1 � 104 s and 3 � 106 s depending upon the system size. For more details about the atomistic and the CG simulations as well as the simulated PS melts see ref. 27.
3
Time mapping
The problem of time scales can be discussed in terms of local (monomeric) friction coefficients. For both the Rouse as well as the reptation model the local motion is governed by a scalar friction coefficient z, so that the melt viscosity h f z and the chain diffusion constant D(N) f z�1. For modelling of a polymer melt this bead friction depends on the specific model used to represent the polymer. The softer CG potentials result in a significantly reduced effective friction coefficient, zCG, between beads compared to the friction coefficient in the all-atom description, zAA, which is closest to the experimental situation. As a consequence the time in the CG dynamics simulations is that of the CG model and has to be properly scaled to reproduce an experiment. The proper time scaling of the CG data can be obtained, by employing the AA-UA-CG hierarchy, as follows: the united atom data are used in order to obtain the time scaling factor SUA–CG(M). Then the UA results are calibrated by all atom simulations, however only for much shorter times, resulting in an additional scaling factor SAA–UA(M). The time scaling parameter, which is the ratio of the effective bead frictions in the atomistic and the CG description, is given by S(M) h zAA/zCG ¼ SAA–UA(M)$SUA–CG(M)
(1)
Note that here S is a scalar quantity because we are studying polymer melts at equilibrium, which can be described by a scalar friction. For multi-component systems or polymers far beyond Soft Matter, 2009, 5, 3920–3926 | 3921
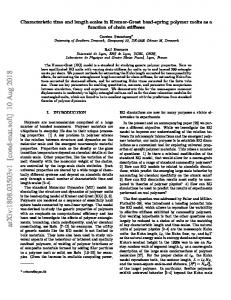
Fig. 2 Time scaling of the CG simulations using UA data and of the UA simulations using atomistic data for a PS melt (M ¼ 1 kDa, T ¼ 463 K), based on the motion of the polymer beads.
equilibrium, S can be a tensor; however the methodology proposed here can also be followed for such systems. Because the local energy landscape is quite complex and strongly fluctuating it is not possible to give a reasonable analytical prediction of S. Therefore, S should be obtained using data taken either from atomistic simulations or directly from experiments. Here we resort entirely to simulation input and later on compare the outcome to experiments. We use data from atomistic MD simulations and match the mean square displacement (MSD) of chain beads over a considerable time, where both amplitude and shape coincide. This provides direct insight into the length scales the particular CG simulation can be used for. First we examine the time mapping of the CG data based on the UA MD simulations. Fig. 2 shows the mean square displacements averaged over all beads i of the CG model and the correspondingly analyzed UA model (circles), g1(t), g1(t) ¼ {h(ri(t) � ri(0))2i}hii, with h i denoting ensemble average, from UA MD and CG MD simulations for a specific PS melt (1 kDa, T ¼ 463 K). The scaling factor, SUA–CG, in order to match the two curves on top of each other in the long time regime, is SUA–CG(M ¼ 1 kDa)¼ 3.1 ps/s. With this scaling factor � and a correboth curves coincide above a distance of about 8 A sponding time of about 100 ps. Below that distance and time the coarse graining results in a different shape of the curve, illustrating that a mere crossing of the curves is not sufficient to determine S and the minimal time and length of applicability of the CG simulations for PS. The possibility of already accurately � is one of the describing the motion of a PS chain above about 8 A advantages of the present CG model that was chosen to be close to the atomistic structure. In general SUA–CG depends on molecular weight and density, which depends on M (chain end free volume effect), as shown in Fig. 3 (B) for the systems studied here by both UA MD and CG MD simulations. As we can see SUA–CG varies in the short length regime (up to about 50 monomers), ranging from 3.1 ps/s to about 6.0 ps/s, and then it remains constant. This is in phase with the observed change in density, which varies from 0.925 g/cm3 for 1 kDa to about 0.97 g/cm3 for the 10 kDa and higher molecular weight melts (see Fig. 3).34 At high molecular weights (above 10 kDa) the change in the polymer dynamics is entirely due to the 3922 | Soft Matter, 2009, 5, 3920–3926
Fig. 3 Time mapping of the CG simulations of the PS melts using UA and AA data, and density as a function of molecular weight (T ¼ 463K).
increase of the molecular weight. On the other hand, in the short length regime the density effect is very important. The latter one is not being described accurately in the CG model, resulting in a dependence of S on the density (and on the molecular length). The important result of Fig. 3, is that a single value for the time scaling parameter S is appropriate to describe the dynamics of long polymer chains. However the UA model itself includes some minor coarse graining and in the case of the here employed TraPPE-UA PS model this is known to result in an accelerated dynamics compared to the all-atom system.27 Applying the same procedure as above, but now for the two models exhibiting different levels of atomistic detail, leads to the result shown in Fig. 2 (,). Though qualitatively similar, there is a remarkable difference. As Fig. 2 displays the two sets of data already � corresponding perfectly match from a distance above about 4 A, to the size of about a phenyl ring. Only this close match at such a short distance allows us to determine SAA–UA(M) from rather short simulations. For the example of Fig. 2 we arrive at SAA–UA(M ¼ 1 kDa) ¼ 35, resulting in SAA–CG(M ¼ 1 kDa) ¼ 110 ps/s. Because of the computational efficiency of the intermediate TraPPE UA model we are able to determine the time scaling factor with its full chain length dependence, as shown in Fig. 3 (squares). Note the similar qualitative but the large quantitative difference between SUA–CG(M) and SAA–CG(M). A possible shortcut for future applications follows from the observation that the variation of S closely follows the chain length dependent density change. This is in line with the entropy induced higher free volume of the chain ends and the concept that two melts with the same density would be expected to have the same monomeric friction coefficient (at fixed temperature).3 Therefore by performing the time mapping for the short chain system but at the density of the longer chains one also can obtain a reliable estimate of SAA–UA.27 If we follow either procedure the combined time mapping SAA–CG(M), shown in Fig. 3, varies between x 110 ps/s (for the 1 kDa system) and x 700 ps/s for the high (10 kDa and above) molecular weight (polymeric) regime.
4
Dynamics structure factor
An important question is whether a single time mapping, based on only one dynamic quantity, namely the mean square displacements of the beads, can describe other dynamic modes of This journal is ª The Royal Society of Chemistry 2009
the macromolecules. Experiments addressing different dynamic modes are typically performed on different samples or at different temperatures, making a direct comparison rather difficult. From simulation trajectories however we can calculate rather different properties for the very same ‘‘samples’’. To examine this we first compare results, concerning the mobility of polymer segments at various length and time scales, from the two levels of description, i.e. the microscopic (all-atom) and the CG one. One standard way to examine the dynamics of multiple length scales is the time dependent dynamics structure factor, S(q, t), as measured by neutron spin echo (NSE) sprectroscopy.36 The single chain intermediate dynamic structure factor of an isotropic (melt) sample can be calculated through:2 E XD sin½qrnm ðtÞ�=qrnm ðtÞ Sðq; tÞ ¼ (2) nm
where rnm(t) is the magnitude of the displacement vector between chain segments n,m, i.e. rnm(t) h |rnm(t)| ¼ |r(n, t) � r(m, 0)|, with n and m belonging in the same chain, and can be determined directly from the simulation trajectories. Fig. 4 shows the normalized single-chain dynamics structure factor obtained from the all-atom (full lines) and the CG (symbols) MD simulations, using eqn 2, for the short chain system (1 kDa at T ¼ 463 K). Various values of the scattering ˚ �1), providing direct insight vector q are reported (0.04, 0.1, 0.5 A in the mobility of different length scales inside the polymer chain without any fitting parameter. Various observations are important in Fig. 4. First, the agreement between the CG and the all˚ �1), which atom data for the smaller value of q vector (q ¼ 0.04 A corresponds to the motion of longer segments, i.e. the whole chain for the present case, reported here, is excellent in the whole spectrum of times, i.e. for all times above a few ps. The same is ��1). also true for the intermediate value of the q vector (q ¼ 0.1 A Note that error bars in the atomistic curves are essentially zero in the short time regime whereas in the long time regime they are much larger (shown with symbols). Data for S(q,t)/S(q,0) for the ��1) (>, green line), correlargest scattering vector, (q ¼ 0.5 A spond to rather short distances of the order of two to three monomers. Differences between the CG and the all-atom
Fig. 4 Single-chain dynamic structure factor S(q, t)/S(q, 0) of a short polymer melt from all-atom (lines) and CG (symbols) MD simulations. ˚ �1 The scattering vectors q are 0.04 (B), 0.1 (,) and 0.5 (>) A (M ¼ 1 kDa, T ¼ 463 K). The dashed lines are the Rouse predictions.
This journal is ª The Royal Society of Chemistry 2009
dynamics occur, as expected, for short times, whereas for longer times the agreement between the two sets of data is excellent. In Fig. 4 we also added the predictions of the discrete Rouse model, which assumes that segmental displacements follow a Gaussian distribution.2,8 For small and intermediate values of q the 1 kDa polymer melt follows relatively well the Rouse model, i.e. predictions are in very good agreement with the simulation data for all times. The dynamics of large q vectors (or smaller distances) shows clear deviations from the theoretical curve, i.e. Rouse predictions decay much faster than simulation data. This is not surprising since the Gaussian approximation is not valid for such small segments and strong deviations from the Rouse picture are expected. Fig. 5 shows S(q, t)/S(q, 0) for a high molecular weight entangled PS melt (50 kDa at T ¼ 463 K) for various values of q ˚ �1). Again we compare the CG MD vector (0.01, 0.05, 0.1 A simulation data to the prediction from the Rouse model. The bead friction for the Rouse model is taken from the plateau value of the molecular weight dependence. Systematic deviations between the simulation results and the Rouse predictions are observed. These deviations are to be expected and it is a clear indication of the onset of entanglements. This can be better shown in the inset of Fig. 5 where ln(S(q, t)/S(q, 0)) vs. q2t1/2/6 is presented. Note that according to the predictions of the Rouse model ln(S(q, t)/S(q, 0)) vs. q2t1/2/6 shows a constant decay rate, which is related directly to the Rouse time mean square displacement of the polymer melts.2 The plateau regime for the ��1 q vector at high q2t1/2/6 values is a clear indication of 0.1 A reptation behavior. The plateau value of ln(S(q, t)/S(q, 0)) gives ˚ , in good agreement with the a tube diameter of about 60–80 A value calculated from primitive path analysis of the same CG PS melts (see ref. 27). Note finally that the time scales reported in Fig. 5 (up to about 10�3 s) are not accessible by neutron spin echo experiments. Thus the proposed CG MD methodology can be directly used as a tool for predicting quantitatively polymer dynamics at such long time scales.
Fig. 5 Single-chain dynamic structure factor S(q, t)/S(q, 0) of an entangled polymer melt from CG MD simulations (symbols). The scat˚ �1 (M ¼ 50 kDa, tering vectors q are 0.02 (B), 0.05 (,) and 0.1 (>) A T ¼ 463 K). Dashed lines are the predictions of Rouse model. In the inset ln(S(q, t)/S(q, 0)) vs. q2t1/2/6 is shown.
Soft Matter, 2009, 5, 3920–3926 | 3923
5 Segmental dynamics The main advantage of the hierarchical methodology proposed here, is that a very broad range of dynamic modes, from segmental-monomeric correlation to long time chain diffusion, can be calculated without any adjustable parameters from a single CG dynamics run. As we have seen above for the dynamics structure factor, atomistic and CG MD simulations data are in excellent agreement and complement each other to cover a very broad range of length and time scales. To prove the quantitative predictive capabilities of our procedure, the obvious question is how well does this describe experimental systems? First, we study the segmental dynamics of polymer chains. A common way of studying segmental relaxation is by calculating a time correlation function of a vector, vb, representing a chemical bond or a bond vector within a monomer. The reorientation of such a vector can be studied by considering ensemble-averaged Legendre polynomials, Pl(t), of the inner product of the unit vector of vb. The most common used one is the second Legendre polynomial: P2(t) ¼ ½(3hcos2q(t)i � 1)
(3)
where q(t) is the angle of a vb bond at time t relative to its original position, which can be fitted to a Kohlrausch-Williams-Watts (KWW) stretched-exponential function: P2(t) ¼ A exp[�(t/sKWW)b]
(4)
Here sKWW is a characteristic relaxation time, b the stretch exponent and A a pre-exponential factor that takes into account relaxation processes at very short time scales. The segmental correlation time sseg,c is defined as the integral of P2(t)/P2(0), i.e. sKWW � �1 � (5) sseg; c ¼ G b b with G(x) being the gamma function. Experimentally nuclear magnetic resonance (NMR) experiments measure the spin–lattice relaxation time, which can be directly related to the reorientation of the C–2H bond. Here we examine the segmental dynamics of the atactic PS melts, as
Fig. 6 Segmental correlation times from NMR experiments37 and CG MD simulations for three different molecular weights.
3924 | Soft Matter, 2009, 5, 3920–3926
predicted from the CG MD simulations, using as vb the vector connecting the two ‘superatoms’, i.e. the ‘‘A–B’’ bond (see Fig. 1). The ‘‘A–B’’ vector P2(t) autocorrelation functions are fitted with the KWW equation and sseg,c is calculated through eqn 5. Note that a numerical calculation of the P2(t)/P2(0) integral gives similar results. If the CG bond displays the same rotational relaxation behavior as the C–H bonds, NMR experiments and P2(t) from the simulation should arrive at the same sKWW. In Fig. 6 we compare the CG MD results with NMR data.37 NMR data for three different molecular weights, obtained at different temperatures, are shown with lines. The relaxation times from the CG MD simulations, sseg,c, (at T ¼ 463 K), for similar molecular weights, are shown with symbols. The good agreement between the CG and the experimental data clearly shows that first, our CG model, which is still close to the chemistry, can directly used predict relaxation modes of bond vectors with characteristic times of only about 0.1–1 ns and second, the time scaling obtained from mean square displacements of the beads, applies here as well without any further fitting. This simultaneous prediction of two different dynamic modes, i.e. translational (mean square displacement of beads) and segmental orientational (bond decorrelation) dynamics, can be used to predict dynamic quantities obtained from different experimental techniques. Note that the systems studied here are polymer melts. Whether the same time mapping will also describe both orientational and translational motion at lower temperatures close to Tg is still an open question, which also depends on the type of the local orientation motion being studied. Naturally, side group motions which are not directly related to the backbone might not described properly in our CG simulations since the benzene ring is modeled as a sphere. But we believe that local orientations of vectors along the backbone, such as the one used here, can also be described properly by the model at lower temperatures. This will be the subject of a future work.
6
Self-diffusion coefficient
Ultimately, the long time diffusion of the polymers is relevant for many processing properties. Thus in order to have a complete comparison of the predicted polymer dynamics with available
Fig. 7 Self-diffusion coefficient of PS melts as a function of the molecular weight from CG MD simulations (open squares) and experimental data (C,29 A,30 :.31) (T ¼ 463K).
This journal is ª The Royal Society of Chemistry 2009
experimental data we also present the self-diffusion coefficient, D, as calculated from the MSD of the chain center-of-mass and has been discussed in detail elsewhere.27 Data for the self-diffusion coefficient of the CG PS melts as a function of the molecular weight (,) are shown in Fig. 7 and are compared to experimental data (full symbols).28–30 Experimental data of ref. 30 are corrected for the different temperature using the temperature dependence reported in ref. 30. Both simulation and experimental data are not corrected for the chain end free volume. The range of molecular weights (up to 50 kDa) spans the regime from unentangled to fully entangled PS melts.3 The results show a remarkable qualitative and quantitative agreement between the experimental and the simulated diffusion coefficients (see Fig. 7). This is of particular importance considering that results from the CG dynamics simulations are compared to experimental data, by using only detailed atomistic simulations for a few reference short-chain systems, without any adjustable parameters. The larger deviation between the simulation and the experimental data in the short length regime most probably is due to the effect of the (small) polydispersity of the experimental data (I x 1.04). In these short chains the presence of even a small amount of PS oligomers acts like a lubricant, reducing the friction. The length and time scales involved in the dynamics of the polymer systems studied here vary over a very broad range: on the one hand the segmental relaxation on length scales of about 0.5 nm (length of the ‘‘A–B’’ bond) corresponds to times of about 0.1–1 ns. On the other hand the end-to-end vector of the higher molecular weight PS chains (50 kDa) is about 14 nm, and their diffusion coefficient of the order of about 10�11 cm2/s (at T ¼ 463 K). This results into a relaxation time of the whole chain, i.e. decorrelation of the end-to-end vector, sd (according to reptation theory sd ¼ hR2i/3p2D2) of about 6.0 ms. The broad spectrum of length and time scales studied here is orders of magnitude beyond that which can be modelled with atomistic molecular dynamics simulations. Furthermore the direct study of such scales from a single dynamics run is also a characteristic of the proposed methodology, to be distinguished from more coarser models. In addition, in the mesoscopic description it is much easier to obtain well equilibrated chains of high molecular weight, compared to the atomistic one.24,38
7 Conclusions In conclusion, we present a hierarchical simulation approach that combines dynamic simulations on different length and time scales. Mapping over a small range of molecular lengths, using atomistic and united-atom simulation data, shows that the time mapping parameter S varies as a function of chain length induced by different melt densities. The asymptotic plateau value of S can be used for scaling the CG dynamics results of longer polymeric chains, where it is not possible to have reliable atomistic data at all. A key point in the proposed methodology is that the CG model is still close to the chemistry. Thus CG simulations can describe properly all the length scales only above about 0.5–1 nm and time above a few hundreds of ps. Furthermore the multi-scale nature of the proposed scheme, combined with a back-mapping procedure, allows to study time scales ranging from a few fs up to ms This journal is ª The Royal Society of Chemistry 2009
(about 12 orders of magnitude) by MD simulations and to compare directly to or predict experimental data without any adjustable parameters. This opens up the way for simulation studies that can be used for quantitative predictions of the dynamics and the rheology of complex systems within the M regime relevant to the polymer processing, for a very broad spectrum of length and time scales. The proposed computational approach is very general and can be directly extended to other polymer chemistries by properly choosing a structure-based CG model, which reproduces structural properties for length scales of about 0.5–1 nm and larger. Furthermore it can be extended for studying different systems such as biological macromolecules, non-equilibrium polymer melts, polymers at temperatures near to Tg, or polymer/solid interfacial systems. For such systems the nature of the friction might not allow a renormalization in time with a scalar quantity. However molecular dynamics simulations could be used for the calculation of the entire friction matrix, and the time mapping factor becomes a tensor. Then the methodology proposed here can also be followed with S being a tensor.
Acknowledgements Very fruitful discussions with Nico van der Vegt, Dirk Reith and Burkhard D€ unweg are greatly appreciated.
References 1 R. G. Larson The Structure and Rheology of Complex Fluids, Oxford Univ. Press, New York, 1999. 2 M. Doi and S. F. Edwards, The Theory of Polymer Dynamics Oxford Univ. Press, England, 1986. 3 J. D. Ferry, Viscoelastic Properties of Polymers, John Wiley and Sons, New York, 1980. 4 Monte Carlo and Molecular Dynamics Simulations in Polymer Science, ed. Binder, K., Oxford Univ. Press, New York, 1995. 5 R. Evereaers, S. K. Sukumaran, G. S. Grest, C. Svaneborg, A. Sivasubramanian and K. Kremer, Science, 2004, 303, 823–826. 6 T. Mcleish, Adv. Phys., 2002, 51, 1379. 7 V. A. Harmandaris and V. Mavrantzas, Molecular Dynamics of Polymers in Simulation Methods for Polymers, ed. D. N. Theodorou and M. Kotelyanski, Marcel Dekker, 2004. 8 V. A. Harmandaris, V. Mavrantzas, D. N. Theodorou, M. Kroeger, J. O. Ramirej, H. C. Oettinger and D. Vlassopoulos, Macromolecules, 2003, 36, 1376–1387. 9 W. Paul, G. D. Smith, D. Y. Yoon, B. Farago, S. Rathgeber, A. Zirkel, L. Willner and D. Richter, Phys. Rev. Lett., 1998, 80, 2346–2349. 10 M. Doxastakis, D. N. Theodorou, G. Fytas, F. Kremer, R. Faller, F. Muller-Plathe and N. Hadjichristidis, J. Chem. Phys., 2003, 119, 6883–6894. 11 A.-C. Genix, A. Arbe, F. Alvarez, J. Colmenero, B. Farago, A. Wischnewski and D. Richter, Macromolecules, 2006, 39, 6260– 6272. 12 C. Chen, J. K. Maranas and V. Garcia-Sakai, Macromolecules, 2006, 39, 9630–9640. 13 M. Tyagi, A. Arbe, F. Alvarez, J. Colmenero and M. A. Gonz�alez, J. Chem. Phys., 2008, 129, 224903. 14 K. Kremer, in Proceedings of the International School of Solid State Physics - 34th Course: Computer Simulations in Condensed Matter: from Materials to Chemical Biology ed. K. Binder and G. Ciccoti, Erice, 2006. 15 M. Doi and J. Takimoto, Phil. Transc.: Math. Phys. Eng. Sc., 2003, 361, 641–652. 16 A. E. Likhtman, Macromolecules, 2005, 38, 6128–6139. 17 A. Kindt and W. J. Briels, J. Chem. Phys., 2007, 127, 134901. 18 J. Baschnagel, K. Binder, P. Doruker, A. A. Gusev, O. Hahn, K. Kremer, W. L. Mattice, F. Muller-Plathe, M. Murat, W. Paul,
Soft Matter, 2009, 5, 3920–3926 | 3925
19 20 21 22 23 24 25 26 27 28
S. Santos, U. W. Suter and V. Tries, Adv. Polym. Sci., 2000, 152, 41– 156. W. Tsch€ op, K. Kremer, J. Batoulis, T. B€ urger and O. Hahn, Acta Polym., 1998, 49, 61–74. D. Reith, H. Meyer and F. M€ uller-Plathe, Macromolecules, 2001, 34, 2335–2345. J. Padding and W. J. Briels, J. Chem. Phys., 2002, 117, 925–943. S. O. Nielsen, G. Srinivas and M. Klein, J. Chem. Phys., 2005, 123, 124907. V. A. Harmandaris, N. P. Adhikari, N. F. A. van der Vegt and K. Kremer, Macromolecules, 2006, 39, 6708–6719. V. A. Harmandaris, D. Reith, N. F. A. van der Vegt and K. Kremer, Macrom. Chem. and Phys., 2007, 208, 2109–2120. S. Izvekov and G. A. Voth, J. Chem. Phys., 2006, 125, 151101. P. K. Depa and J. K. Maranas, J. Chem. Phys., 2005, 123, 094901. V. A. Harmandaris and K. Kremer, Macromolecules, 2009, 42, 791– 802. T. P. Lodge, Phys. Rev. Lett., 1999, 83, 3218–3221.
3926 | Soft Matter, 2009, 5, 3920–3926
29 M. Antonietti, K. J. F€ olsch and H. Sillescu, Makromol. Chem., 1987, 188, 2317–2324. 30 G. Fleisher, Coll. and Polym. Sci., 1987, 265, 89–95. 31 O. Urakawa, S. F. Swallen, M. D. Ediger and E. D. von Meerwall, Macromolecules, 2004, 37, 1558–1564. 32 C. Liu, J. He, E. Van Ruymbeke, R. Keunings and C. Bailly, Polymer, 2006, 47, 4461–4479. 33 H. J. C. Berendsen, D. Van der Spoel and R. Van Drunen, Comp. Phys. Comm., 1995, 91, 143–157. 34 P. Zoller and D. J. Walsh, Standard Pressure-Volume-Temperature Data for Polymers, Technomic, Lancaster, 1995. 35 H. J. Limbach, A. Arnold, B. A. Mann and C. Holm, Comp. Phys. Comm., 2006, 174, 704–727. 36 D. Richter, M. Monkenbusch, A. Arbe and J. Colmenero, Adv. Polym. Sci., 2005, 174, 1–221. 37 Y. He, T. R. Luz, M. D. Ediger, C. Ayyagari, D. Bedrov and G. D. Smith, Macromolecules, 2004, 37, 5032–5039. 38 R. Auhl, R. Everaers, G. S. Grest, K. Kremer and S. J. Plimpton, J. Chem. Phys., 2003, 119, 12718–12728.
This journal is ª The Royal Society of Chemistry 2009