Predicting Product Adoption in Large-Scale Social Networks Rushi Bhatt
Vineet Chaoji
Rajesh Parekh
Yahoo! Labs Embassy Golf Links Park Bagalore 560071, India
Yahoo! Labs Embassy Golf Links Park Bagalore 560071, India
Yahoo! Labs 4401 Great America Parkway Santa Clara 95054, CA
[email protected]
[email protected]
[email protected]
ABSTRACT
Categories and Subject Descriptors
Online social networks offer opportunities to analyze user behavior and social connectivity and leverage resulting insights for effective online advertising. We study the adoption of a paid product by members of a large and well-connected Instant Messenger (IM) network. This product is important to the business and poses unique challenges to advertising due to its low baseline adoption rate. We find that adoption by highly connected individuals is correlated with their social connections (friends) adopting after them. However, there is little evidence of social influence by these high degree individuals. Further, the spread of adoption remains mostly local to first-adopters and their immediate friends. We observe strong evidence of peer pressure wherein future adoption by an individual is more likely if the product has been widely adopted by the individual’s friends. Social neighborhoods rich in adoptions also continue to add more new adoptions compared to those neighborhoods that are poor in adoption. Using these insights we build predictive models to identify individuals most suited for two types of marketing campaigns - direct marketing where individuals with highest propensity for future adoption are targeted with suitable ads and social neighborhood marketing which involves messaging to members of the social network who are most effective in using the power of their network to convince their friends to adopt. We identify the most desirable features for predicting future adoption of the PC To Phone product which can in turn be leveraged to effectively promote its adoption. Offline analysis shows that building predictive models for direct marketing and social neighborhood marketing outperforms several widely accepted marketing heuristics. Further, these models are able to effectively combine user features and social features to predict adoption better than using either user features or social features in isolation.
J.4 [Computer Applications]: Social and Behavioral Sciences; I.5.1 [Pattern Recognition]: Models—statistics; H.2.8 [Database Management]: Database Applications— data mining
Permission to make digital or hard copies of all or part of this work for personal or classroom use is granted without fee provided that copies are not made or distributed for profit or commercial advantage and that copies bear this notice and the full citation on the first page. To copy otherwise, to republish, to post on servers or to redistribute to lists, requires prior specific permission and/or a fee. CIKM’10, October 26–29, 2010, Toronto, Ontario, Canada. Copyright 2010 ACM 978-1-4503-0099-5/10/10 ...$10.00.
General Terms Computational Advertising, Algorithms, Targeting
Keywords behavioral targeting, online advertising, predictive modeling, social network targeting
1.
INTRODUCTION
The explosive growth in online social networking in the past decade has provided researchers and marketers an opportunity to gain valuable insights into user behavior and preferences. According to Nielsen [3], two-thirds of the online population visits social networking and blogging sites. Users are spending an ever increasing amount of time connecting, communicating, and sharing through these sites and thereby providing latent information on their behavior and preferences. This information can be leveraged to infer interests of individual users from the interests of their social connections based on the premise that socially connected users tend to be similar (homophily [22]). Further, the social connections in the online community are increasingly used1 for viral marketing [25] to spread the adoption of products. Social networks are therefore viewed as strategic resources that can be leveraged for more effective online advertising. In this paper we study the social network induced by a popular Instant Messenger (IM) product. Instant Messaging is a popular form of communication where users who are connected to each other via buddy links can send instant messages to each other’s computers. Users connected to each other on the IM are called friends. A popular feature of many Instant Messenger products is PC to PC calling wherein users can call their friends’ computers and talk in person via VoIP (voice over IP). Users can optionally subscribe to a premium (paid) product we term PC To Phone that enables them to call any traditional phone line (land or mobile) from their computers for a nominal charge. In this paper, we study the adoption of the PC To Phone product and its implications for online advertising. 1 See for example the Levi’s Friends Store with Facebook connections, http://store.levi.com/#store
1.1 Influencers in Social Networks Social Science literature has long studied the role of influencers in social networks [20, 30]. Influencers are typically characterized as thought leaders, critics, industry giants, or just plain interesting personalities who have the ability to influence potential buyers. In practice, these individuals may be identified as highly connected individuals or individuals that bridge two relatively large sub-communities2 . Influencers are key to the success of viral marketing campaigns since they can leverage the power of their network to maximize the diffusion of a marketing message in the social network. We analyze the IM social network and the adoption pattern of the PC To Phone product and attempt to answer the following questions: • Do individuals wield influence over their friends in online social networks? If so, how do they affect future product adoption? • Are highly connected users the same as social influencers? • How far reaching is the influence in the graph? Is it limited to the local social neighborhood or is it global (i.e., network wide)? • Can we predict future product adoptions using a combination of users’ behavior, demographic, social connectivity, and the attributes of their friends? How well does a data-driven approach do, compared to commonsense heuristics? Our analysis shows that influencers if defined by the number of their social connections alone, are rare and ineffective at driving adoption. This is in line with the recent observations made by Watts and Dodds [30] that contradict the conventional wisdom in marketing where the role of the highly connected individuals is emphasized. Treating degree-central users as proxies for influencers, we observe that degree-central users do not have a disproportionately higher fraction of their friends adopting after them compared to other users. Further, the cascades of adoptions triggered by the degree-central users are very short indicating that the influence (if any) is limited to the local neighborhood. However, we observe strong evidence of a peer-pressure effect within the social network wherein adoption of a product by an individual is more likely if the product has been widely adopted in the individual’s social neighborhood. This is evidence of the threshold model [16] which suggests that each individual has a threshold representing the proportion of a user’s friends who must adopt the product before the user decides to do so. We also find that social neighborhoods that are rich in adoptions continue to add new adoptions at a higher rate than neighborhoods that are poor in adoptions.
1.2 Effective Marketing Campaigns We are also interested in using the insights gained from the social adoption analysis for improved targeted marketing campaigns. Traditional marketing approaches involve broadcasting the marketing message to a large audience. This approach of delivering the same message to a large audience might be effective in creating awareness of the PC 2 Gladwell [15] uses the term connectors to depict these influential entities.
To Phone product but can be wasteful in terms of the return of investment of advertising dollars. Audience segmentation is a widely adopted practice in marketing [23]. It allows marketers to identify the right segments of users to market to and customize the advertising to each segment. These segments are typically created based on demographic, geographic, and psychographic attributes [1]. Recent advances in online advertising have popularized the use of behavioral targeting [10, 11, 32] which leverages online user behavior to infer user interests and enables targeting the right ad to each user interest segment. More recently, with the growing popularity of online social networks, the notion of social ad targeting [24] has become very popular. This form of targeting involves either seeding some users in the network with a viral marketing campaign or inferring a user’s interests based on what is known about the user’s social connections (friends). We study two types of marketing campaigns to promote product adoption in the IM network – Direct Marketing and Social Neighborhood Marketing. Direct Marketing campaigns target users with high propensity to adopt in the future. Social neighborhood marketing involves messaging users in the social network who are most effective in leveraging the power of their networks and promote the product among their social connections. The key to success in either marketing strategy is identifying the right set of users to market to. We show that effectively combining user features (e.g., demographic, geographic, or behavioral) and social features derived from the user’s social network, like local network connectivity and user features of friends, can be leveraged to build models that have higher predictive accuracy in terms of identifying future adopters than widely accepted heuristics or even models based on user features or social features in isolation do. The direct marketing and social neighborhood marketing methods are also complementary: the first identifies individual users who are likely to convert while the other finds pockets of social graph that are likely to convert. To summarize, the key contributions of this work are: 1. We empirically show that the spread of product adoption is not due to the presence of influencers but more a result of peer-pressure, or a combined effect from several friends, in the user’s social connections. Cascades of product adoption are also shown to be short and local. 2. We show how effectively combining user and social features can result in models that better predict future adoption than user or social features in isolation. 3. We demonstrate how simple yet effective models can be leveraged in direct marketing and social neighborhood marketing campaigns to promote a niche but important PC To Phone product in the large-scale Instant Messenger online social network The remainder of the paper is organized as follows. Section 2 reviews the related work in the field. Section 3 describes the data used in the analysis. Section 4 analyzes the presence and role of influencers in the IM social network. Section 5 discusses how effective marketing campaigns can be designed to promote future PC To Phone product adoptions. Section 6 concludes with discussion of the key results and presents ideas for further research.
2. RELATED WORK A vast amount of research has been done in both online and offline social networks to understand and quantify social behavior, the role of influencers, viral marketing, and ad targeting. In this section we review a sampling of published literature. A thorough coverage of all related literature merits a survey paper. We focus on the following three sub-topics that are closest to the work in this paper. Influencers and contagion cascades: Adoption of a product in a social network is closely related to the topic of information diffusion in the network. Granovetter’s threshold model [16] is one of the simplest yet widely analyzed diffusion models. It effectively states that each node v in the social network has a threshold θv representing the fraction of v’s friends that must adopt the product before v would adopt the product. We observe strong evidence of this model in the PC To Phone adoptions, in our work. Cascades of information flow within a network are typically attributed to influencers [28]. In other words, it is believed that favorable response from influencers leads to wider-than-average adoption in the social graph. The presence and role of opinion leaders or influencers within networks has been extensively studied in the literature [20, 30]. Kempe et. al [19] go on to show that the general task of identifying such a set of individuals is NP-complete. They propose a greedy approximation for a range of network models (such as the threshold model), that are provably within 63% of the optimal solution. Watts and Dodds [30] argue that over a large range of plausible network parametrizations, long conversion chains are driven more by individuals that can be influenced easily rather than influentials. Our results on the adoption of the PC To Phone product concur with the observations by Watts and Dodds [30]. Moreover, we do not see long cascades resulting from contagion (discussed in Section 4.1). Attributing actions in a social neighborhood to influence (referred to as contagion in [6]) as against homophily is a much debated topic. In [6], the authors analyze the contagion versus homophily effects for a mobile service application – Yahoo! Go – which is inherently not a social product, as opposed to the PC To Phone product studied in this work. Social targeting: Domingos and Richardson [13] propose evaluating a user’s network value in addition to their intrinsic value and its effectiveness in viral marketing. They compare the relative effectiveness of three marketing strategies: Mass marketing, direct marketing, and network-based marketing. Hartline et al [17] proposed an influence-andexploit marketing strategy wherein a carefully chosen set of users is influenced with free distribution of the product and the remaining buyers are exploited for revenue maximization. Hill et al. [18] target audiences that are exposed to customers who have converted (adopted a product or service). They argue, based on the principle of homophily, that audience exposed to converted customers is more likely to sign-up for the product. Their work relies only on targeting the neighborhood of existing adopters and does not explore alternate schemes for audience selection. In contrast, since the work presented in this paper uses social indicators (features) it can identify adopters beyond neighbors of existing adopters. In another recent work [26], the authors analyze a large network resulting from the calls made on a telecommu-
nication service to predict the churn rate of its customers. Notion of local influence with immediate social (call) circle is defined for a customer. The churn probability of a customer is a function of its local influence and the churn probability of the entire social circle as obtained from a predictive model. Provost et al [24] describe a privacy friendly method for extracting quasi-social networks from user generated content sites to identify good audiences for brand advertising. Leveraging co-visitation of user-generated micro-content as a proxy for a true social connection in [24], would presumably result in noisy data. In contrast, our work relies on a real social network. In addition, our work compares social targeting with other targeting methods. Bagherjeiran and Parekh [8] present an ensemble classifier based approach to combining user behavioral features along with social features to boost the probability that a user will click on a display ad. Drawing inspiration from the above studies, which analyzed adoption patterns in social networks, we analyze the effectiveness of different marketing approaches for promoting the PC To Phone product in the IM network. Analysis of large social networks: Many recent efforts have analyzed very large scale social networks. Singla and Richardson [27] analyze the MSN Messenger network along with search results from Windows Live Search to uncover shared interests (captured in terms of common search terms) between people who are neighbors on the messenger network. Their study validates the concept of homophily on a real social network. In another work [4], the authors study the topological properties of three large friend networks (Cyworld, Orkut and MySpace (partial graph)). Contrary to real-life social networks they observe that certain online social networks show a multi-scaling property indicating multiple degree distributions in the network. Few other works such as [6] and [26] validate their results on large real online social networks – Yahoo! Messenger network and a telecommunications operator, respectively. In this work, the task of designing an appropriate marketing campaign to promote PC To Phone adoption in the large IM network studied here is very challenging. The baseline adoption rate of this product is extremely low with only a fraction of a percent of the active users adopting the product in any given month. Our results indicate that carefully selected user and social features can be used to build models that predict future adoptions. These models can be effectively leveraged in marketing campaigns.
3.
DATASET DESCRIPTION
The analysis and experiments in this paper are based on three different data sources: The IM graph, user data, and service payment transaction system. Note that the actual numbers, like the number of nodes and edges of the social network graph, the number of friends of a user, the adoption rate of the product, etc. are re-scaled for confidentiality reasons. The axes of several charts have been normalized while preserving the underlying trends exhibited in the chart. Further, to protect user privacy we only had access to the structure of the social network and not the actual messages that were exchanged between friends. The online social network graph is induced from active users of the IM and their social connections (friends). The snapshot of all active users having at least one friend from summer of 2008 is considered. Users are called active if they
4.1
4. ANALYZING THE SPREAD OF INFLUENCE Quantifying the spread of influence in a social network is a hard problem in general. The IM social network data presents an even bigger challenge since the actual communication between IM users is not tracked to protect user privacy. Watts and Dodds [30] define influentials as individuals with high influence volume which is a function of the user’s degree, personal characteristics, and domain expertise. Explicitly characterizing influence volume was not practical for us given the large scale of the IM social network. In the absence of a concrete way for identifying influentials, we focus on individuals with large number of friends (high degree users) and ask if they may be deemed as influentials in promoting the adoption of the PC To Phone product. Messaging to highly connected individuals is a common heuristic in social network marketing based on the assumption that their adoption followed by subsequent word-of-mouth pro-
3
0%-25% 25%-50% 50%-75% 75%-100%
2
0%-25% 25%-50% 50%-75% 75%-100%
1
For users in the IM graph we obtained their behavioral, demographic, and geographic information from clickstream logs and from the information provided by users at the time of registration. This data together with the social graph was used to derive user and social features described in Table 1. Social features such as conn bdy, reach bdy and adj bdy are motivated from related work by Backstrom et al. [7]. The other features were chosen based on their availability and relevance to the classification problem on hand. Finally, we obtained information about the PC To Phone product adoption from the payment transaction logs. We identified adopters of this product over a two year period from summer 2006 - summer 2008. For each user we extracted only the date of adoption of the product. Analysis of the adoption trend over time and conversation with the business showed that this niche product is very important to Yahoo!
0
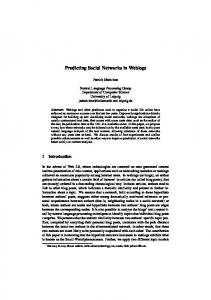
Figure 1: (a) Degree distribution on a log-log scale. (b) Distribution of connected component size on a log-log scale.
4
100x
3
10x
Cluster Size (b)
2
x
1
100x
Avg .#Successors
10 1 10x
Number of friends (a)
High-Degree Users as Influencers
We study the adoption patterns over time of friends of high-degree individuals in the IM network. In Fig. 2(a) we depict the average number of successors (friends who have adopted the product after the individual) as a function of the number of predecessors (friends who adopted the product before the individual). The chart shows 4 different curves by degree quartiles. High-degree individuals have a higher average number of successors compared to lower-degree individuals. This is expected since, by definition, higher-degree individuals have more friends and hence the number of friends adopting just by chance will be higher for higher-degree individuals. Indeed, Fig. 3 shows that the fraction of successors is much lower for high-degree individuals than for lowerdegree users. Comparing Fig. 3 to Fig. 2(a) the trend is completely reversed for all degree quartiles in. This shows that high-degree users do not influence a disproportionately large fraction of their immediate friends to adopt after them and, if anything, it is the lower degree clusters that are most easily influenced into adoption.
0
Count
Count
10 1 x
motion among their friends would lead to a cascade of adoptions [19]. However, this common belief may not hold true in practice, since common sense dictates that social influence should be a function of the user’s domain knowledge as perceived by his/her friends for the specific product or service at hand. Here, we support this notion by showing evidence against degree-centrality as a measure of influence. In Section 5 we show targeting strategies that outperform degree-based targeting and hence demonstrate that degreecentrality is not a good targeting strategy, either.
Avg. #Predecessors
100 100010,000
100 1000 10,000
have logged into the network at least once in the past 6 months. The resulting social graph contains O(100M) users with O(1B) edges. Our analysis of the social network showed that degree distribution resembles the familiar power law distribution (see Fig. 1(a)) and that the network has one giant connected component along with a multitude of smaller connected components (see Fig. 1(b)). This is in line with observations from past studies on large social networks [21].
0
2
4
6
#Predecessors
(a)
8
10
0
2
4
6
#Successors
8
10
(b)
Figure 2: (a) Number of friends who follow an adopting user as a function of premium predecessors (b) Number of friends who precede an adopting user as a function of premium predecessors We also study the reverse of what is presented in Fig. 2(a) where we plot the average number of predecessors as a function of the number of successors. This shows a nearly identical relationship as in Fig. 2(a). If indeed high-degree individuals are influencers, we would not expect users with a high number of successors to also have a high average number of predecessors. A similar study was performed by Anagnostopoulos et al. [5] with a shuffle test where causation influence was dissociated from correlation through a temporal shuffle of adoptions following a user. Our results indicate that adoption is less likely to be due to the influence of high-degree users but is more related to the number of prior adoptions (predecessors) in the user’s social neighborhood.
Feature fringe n friends n friends add n friends del prem bdy pc2pc adj bdy conn bdy reach bdy
Network Features
User-level Features
Description Binary feature indicating if a node has at least one premium neighbor Number of network neighbors Number of network neighbors added during T Number of network neighbors deleted during T Number of network neighbors who have adopted premium product Number of PC to PC calls made during the given time period Number of neighbors that are adjacent to each other Number of neighbors that are within one hop Number of users in the network a user can reach. Essentially the size of the connected component. Number of unique countries to which neighbors belong, based on the IP address Binary feature indicating if the user has adopted the product. (Target variable) Number of logins during a given period Total number of instant messages sent during time a given period Country decoded from IP of user Binary variable indicating whether the user was active during the given period 0 male, 1 female, -1 unknown Categorical feature based on decile based partitioning of age Similar to age cat, accept for years spent using Messenger product Country declared by the user
buddy countries premium n logins total ims sent country active gender age cat ten cat country code i entertainment i music i small business i business i personal finance i travel i computers i shopping i home family i sports i health
Binary variables indicating interest categories optionally declared by the user at the time of registration.
Table 1: User-level and network features gathered from Messenger data
0.5
While it seems obvious that not all of a user’s friends would convert, Figure 3 shows that, proportionately, neighbors of
0%-25% 25%-50% 50%-75%
0.4 0.3 0.2 0.1
Fraction of successor friends
75%-100%
0
2
4
6
8
10
#Predecessors Figure 3: Fraction of friends who follow an adopting user as a function of premium predecessors
high-degree users convert less than those of medium or lowdegree users. In other words, high degree does not guarantee a high effectiveness in neighborhood conversion. Fig. 4 shows a cumulative distribution of the total path length of adoption cascades. An adoption cascade is one where the first adopter has no predecessors, i.e., none of the user’s friends have adopted before the user and continues a sequence of adoptions over time from the first adopter to one of his/her friends, then to one of their friends, and so on until the end of the cascade. We required that successive adoptions should have occurred within six months of eachother. More than 60% of the adoption cascades are of length one, indicating that the original adopter was followed by just one of his/her friends within six months. Similarly, nearly 80% of adoption cascades are of length two or lower. This indicates that most adoption cascades are local. We found that longer cascades were generally triggered by high-degree users (see blue curve with triangles in Fig. 5). However, we also observed that the average degree of the users along the longer cascades (internal nodes) was in fact higher than that of users triggering these cascades (green curve with circles in Fig. 5). This observation indicates that while degree is correlated with longer cascades it is mostly not the cause for these cascades. The longer cascades are created simply by virtue of the individuals in the cascade being better connected. Users at the end of cascades generally have the lowest average degree (red curves with plus sign in Fig. 5).
0
5
10
15
20
25
x
2x
3x
4x
5x
6x
decessor (friend who adopted before them). Further, Fig. 6 shows evidence of peer pressure within the social neighborhood of a user. The plot shows that the probability of adoption of an individual user increases with the number of friends who have adopted prior to them increases. It also demonstrates diminishing returns: the presence of each additional predecessor beyond 5 does not increase the user’s probability of adoption by much. This effect is consistent with the observations made elsewhere on the LiveJournal and DBLP datasets [7].
Probability of adoption (%)
0.6 0.4 0
0.2
Cumulative Density
0.8
1.0
In other words, a long cascade is more a characteristic of the users along the conversion cascade that supports longer cascades and likely not that of the cascade initiators.
1
Path Length
8x
Figure 4: Cumulative distribution of cascade length distribution in premium subgraph
3
4
5
6
7
8
9
10
Figure 6: Probability of a user’s adoption as a function of friends adopting before the user. The spread of adoptions in the IM social network appears to follow the threshold model with each user v having a threshold θv indicating the fraction of the user’s friends who must first adopt for the user to adopt. Fig. 7 shows the probability of adoption as a function of number of friends (degree). Each plot is for a specific number of predecessors (friends adopting before). While users with higher number of predecessors have a higher probability of adoption regardless of degree, the probability of adoption decreases with higher degree.
Triggering Nodes Internal Nodes
5
10
15
Path Length Figure 5: Average degree of nodes that trigger cascades (blue), are in the cascade but neither trigger nor terminate cascades (green), and are last adopters (Terminal) in cascades (red). Also note the difference in the slope of the curves.
4.2 Network Effect and the Threshold Model While the above analysis shows that adoption patterns likely are not caused by degree, we do observe the existence of the network effect in the adoption of the PC To Phone product. Over one-half of all adopters had at least one pre-
2x
3x
1 predecessor 3 predecessors 5 predecessors
x
0
Probability of adoption (%)
x
2x
3x
4x
5x
6x
7x
Terminal Nodes
Average Degree
2
Number of predecessor Friends
0
20
40
60
80
100
Number of Friends Figure 7: Probability of a user’s adoption as a function of number of friends. Each curve is for a specific number of friends adopting before the user’s adoption Fig. 8 shows that the probability of a user adopting the product increases, to an extent, as the fraction of their
5.1
Direct Marketing
Direct marketing involves targeting ads to users who have a high propensity to adopt the product. Identifying the right set of users is a key challenge in direct marketing. We show that rich user and social features can be used to build a classifier to reliably predict future adoptions. The features used in the model are described in Table 1. For training the classifier we construct user features (for users who have not yet adopted the product) from month Mi . Each user record is assigned a binary target indicating whether the user adopted in month Mi+1 or not. Table 2 shows the relative importance score (see Section 7) of the top features. Features with higher importance score are most predictive of the target (adoption). All other features (not shown in the table) have a relative importance score below 1.0.
2x
3x
marketing that improve upon commonly used heuristic approaches for social marketing.
Rank
x
Probability of adoption (%)
4x
friends who adopted before them increases. The reason for decline in adoption rate beyond 20% mark remains to be analyzed further. We found that users with high fraction of neighborhood conversions tend to have a low average degree, and therefore a smaller absolute number of friends available for conversion. These users also tend to have a smaller absolute number of predecessors (cf. Figure 7).
.01
.02
.05
.10
.20
.50
1.0
Fraction of adopted friends Figure 8: Probability of a user’s adoption increases with increasing fraction of adopted friends.
4.3 Rich neighborhoods get richer Local neighborhoods in the social network that are already rich in adoption tend to see further growth in adoptions. Fig. 2(a) conveys this by showing how users with many predecessors also have many successors. This phenomenon may be explained by the local connectedness of small-world graphs [9, 31] as follows. New adoptions in neighborhoods that are already dense are facilitated through peer pressure and the percolating effect due to the local connectedness [29]. We leverage this insight in the social neighborhood marketing strategy in the next section.
5. EVALUATING MARKETING STRATEGIES FOR PROMOTING PRODUCT ADOPTION Different marketing strategies can be leveraged to promote the adoption of the PC To Phone product in the online social network. One simple strategy is mass marketing – broadcasting the same message to all users in the online social network. Mass marketing might be effective in generating awareness of the PC To Phone product. However, given the size of the IM social network (O(100M) active users) and the very low baseline adoption rate of the product, mass marketing might not be cost effective. Further, repeatedly broadcasting the same message to the entire user base can also lead to poor user experience. The other end of the spectrum involves no active marketing and relies on spontaneous adoptions and unaided word-of-mouth effect. In the remainder of this section we study two different marketing strategies – direct marketing and social neighborhood
1 2 3 4 5 6 7 8 9 10 11
Feature country pc2pc prem bdy fringe ten cat gender age cat n logins n friends buddy countries reach bdy
Relative Importance Score 44.76 25.81 6.32 6.03 4.51 2.25 2.20 1.92 1.51 1.27 1.00
Table 2: Relative Feature Importance The most predictive feature of user adoption is the demographic feature - user country. Non-US users are more likely to adopt this product since it offers a lower cost alternative to international calling. The next most important feature is pc2pc (a behavioral feature) which denotes the number of PC to PC calls made by the user. Presumably, users making PC to PC calls already have all the prerequisites in terms of the microphone and PC speakers set up to take the step towards making the online transaction to activate PC To Phone product. The third most predictive feature, unsurprisingly based on the previous section, is the social feature prem bdy which is the number of friends of the user who have already adopted the product. We built classifiers using the C5.0 3 decision tree software. Note that other supervised learning algorithms would have worked just as well. The classifier was evaluated on a test set comprising of users (who had not already adopted the product) whose features were constructed based on their activity from month Mi+1 . A binary target was assigned to each user record in the test set based on whether or not they adopted the product in month Mi+2 . The model assigns a score for the user’s propensity to adopt in the following month. Users can be rank ordered by their model score and the top k% may be targeted with ads where k is determined based on the available marketing campaign budget. A cumulative gains chart is used to calibrate the performance of 3 C5.0 is a commercial version of C4.5. For enhancements in C5.0 see [2].
100
% of adopters
80
60
40
20
User features Social features Combined Premium friends
0 0
20
40 60 80 Users ranked by model score (%)
100
Figure 9: Cumulative gains for adoption based on the model ranking.
5.2 Social Neighborhood Targeting The social neighborhood targeting strategy leverages wordof-mouth marketing in the social network. Product adopters when suitably messaged can leverage the power of their network to promote the product among their friends. The key to effective social neighborhood marketing is identifying the right subset of product adopters who can maximize future adoptions. Domingos and Richardson [13] had posed the following problem: which set of individuals could be convinced to adopt the product so that they would in turn create a cascade of adoptions in future. The optimal solution for this problem is NP-hard [19]. Here, we identify users through their neighborhoods, such that users with the highest predicted number of adopting friends are ranked higher. Such targets for social neighborhood targeting can be identified by a variety of methods beginning from simple heuristics like picking from among the highest degree users, the earliest adopters, or most recent adopters. To evaluate the effectiveness of each method we define a score σ(A) as the number of neighbors of users in set A who adopt within a specified time period after A: σ(A) = | ∪i Np (i)|, i ∈ A
(1)
where Np (i) is the set of premium successors of user i. The more effective methods would identify the set A of adopters with the highest σ(A). A model based approach
for selecting the set A involves training a model to predict for any set A, the value of σ(A). The training and test data were generated using the same approach as described in Section 5.1. In our experiments, we trained a regression model using the stochastic gradient boosted decision trees algorithm [14] though any suitable regression based model can be used. This model used both, the user and the social features shown in Table 1. Figure 10 presents the test set results of the different methods for picking the set A for social neighborhood marketing. The heuristic that selects early adopters performs (the “Time” curve in Fig. 10) worse than random while the heuristic that selects the most recent adopters performs slightly better than random. This is somewhat expected, because users tend to adopt shortly after their friends, with a sharp decline in adoption probability as elapsed time increases from friends’ adoption. The “Reverse Time” curve in Figure 10 ranks users as the latest adopter first, which captures the predictive power of this temporal proximity phenomenon. The heuristic that selects highest degree adopters first performs quite well and provides a significant lift over random. Again, this is also expected since users with high number of friends have better chances of having a larger number of them adopting, and the scoring mechanism prefers users with highest absolute number of premium successors. Finally, Figure 10 (“Learned Ranking” curve) shows that the model using the combination of user and social features for predicting σ(A) performs the best compared to the other heuristic targeting methods and even beats the degree-based targeting selection which has a natural advantage given the definition of scoring function σ(A). Cumulative gains for σ(A) over all adopters in Mi+1
the classifier. It shows the fraction of adopters in the following month within the top-k% users by their score. A higher percentage of adopters for the same k% signifies better predictive performance of the ranking algorithm. Fig. 9 shows cumulative gains charts on the test dataset for user features alone, social features alone, and for a combined set of user and social features. The combination of user and social features was achieved by taking all these available features for training the scoring algorithm. While performance of both the user and social features when used in isolation is very similar, their combination shows a significant improvement, which emphasizes the point that the two types of features are complementary in their prediction. Ranking users by the number of their premium predecessor friends, a powerful predictor of social adoption, does not perform better than learned ranking either (see Fig. 9).
100
80
60
40 Random Reverse Time Time Degree Learned Ranking
20
0 0
20 40 60 80 Ranked ordering of A (as % of adopters in Mi)
100
Figure 10: Relative performance (in terms of cumulative gains for σ(A)) of social neighborhood targeting methods
6.
DISCUSSION AND CONCLUSION
We have analyzed the spread of product adoption in a large online social network. In contrast with previous studies that analyze growth of online communities or where conversion probabilities are assumed to be high [19, 29], we studied the adoption of a niche but important product. Despite very low baseline adoption rates, we found a significant social network effect. We showed that the spread of product adoption is not due to the presence of individual influencers but a result of influence yielded by peer-pressure where users
with more adopter friends were themselves more likely to adopt. We also showed how predictive models trained on a combination of user and social features can predict adoption better than heuristic measures. These models perform better than several commonly used heuristics in off-line evaluations. While the analysis yields several interesting insights on the spread of adoption in social networks, it also identifies several open questions for further research. Quantifying influence in a social network is challenging. It depends on a variety of factors including personal traits, individual’s knowledge of the subject matter, and the ability to convince friends to adopt products they recommend. In this paper we showed that high degree users are not necessarily strong influencers. A formal model of influence that is generally applicable in a wide array of social networks would be valuable. Common sense suggests that influence must be very domain specific. While we show how just the overall user degree is not a predictor of influence, it is not entirely clear which social structural properties characterize influence when one has access to domain specific information. For instance, in our study the number of premium friends of a user – a network structure property – was a good predictor of future adoptions. Essentially, the product domain might define a restricted social subgraph to be considered. One may then be able to reason about influence purely as a structural property within this subgraph. Devising general techniques to define such subgraphs requires more work. Recent work [12] hints at this problem by analyzing social graphs over a variety of edge definitions as opposed to analysis relative to a single static definition. The experiments described in this paper were based on historical data. Splitting the data by time into train and test sets enabled us to evaluate the effectiveness of the models built to predict adoption. While these results identified strong correlation between the user and social features and future adoptions, the ultimate proof of the effectiveness of these models can only be established by running live marketing campaigns in a controlled A/B test setting. We are planning some future work along these lines. Direct marketing and social neighborhood marketing strategies are complementary. An advertiser would like to target users with an appropriate message while simultaneously getting one (or more) of their friends to influence them via word-of-mouth marketing. Determining how much budget to allocate between the two marketing strategies is based on the cost-benefit analysis of each strategy. The cost of the marketing campaign includes the cost of delivering the marketing message to the selected users and the cost of offering the right reward (or incentive) to users to adopt and possibly promote the product as well as the cost of impacting user experience. Some of the incentives might be monetary while others may involve recognition as in the case of reputation scores at Amazon.com or Yahoo! Answers. Selecting the right incentive and its magnitude to motivate users to adopt or to promote products among their friends is an interesting question that merits further research. Return on investment on the campaign depends on the response rate of the targeted users in the case of a direct marketing campaign and the ability of the targeted users to promote the adoption of the product among their friends in the case of social neighborhood marketing campaign. Domingos and Richardson [13] used a tunable payoff parameter in their simulations.
In practice, an accurate estimate of the payoff can only be determined by running the actual campaigns and perhaps generalizing the strategies from them. This relationship between direct marketing and social neighborhood marketing requires in depth investigation.
7.
APPENDIX
The relative importance score concept is obtained while training Stochastic Gradient Boosted Decision Trees [14] (GBDT). A score for splitting attribute ai at node n is obtained using Equation 2. S(Tl , Tr ; n = ai ) =
wl wr (¯ yl − y¯r )2 wl + wr
(2)
where Tl (Tr ) is the left (right) sub-tree at node n with splitting attribute ai and y¯l (¯ yr ) is the mean of the target variable (premium in our case) for all data points in the left (right) sub-tree. wl is the sum of weights assigned (while boosting) to data points in the left sub-tree. The above score is aggregated across the set of trees generated while training GBDT and is presented as the relative importance score.
8.
ACKNOWLEDGMENTS
We thank Duncan Watts, Abraham Bagherjeiran, Sharad Goel, Narayan Bhamidipati, and Sergei Matsuevich for numerous enlightening discussions and their help with the data.
References [1] Nielsen Claritas PRIZM. http://en-us.nielsen.com/ tab/product_families/nielsen_claritas/prizm. [2] RuleQuest Research. Website. http://www.rulequest. com/see5-comparison.html. [3] Nielsen Wire. Website, 2009. http://blog. nielsen.com/nielsenwire/nielsen-news/ social-networking-new-global-footprint/. [4] Y.-Y. Ahn, S. Han, H. Kwak, S. Moon, and H. Jeong. Analysis of topological characteristics of huge online social networking services. In WWW ’07: Proceedings of the 16th international conference on World Wide Web, pages 835–844, New York, NY, USA, 2007. ACM. [5] A. Anagnostopoulos, R. Kumar, and M. Mahdian. Influence and correlation in social networks. In KDD ’08: Proceeding of the 14th ACM SIGKDD international conference on Knowledge discovery and data mining, pages 7–15, New York, NY, USA, 2008. ACM. [6] S. Aral, L. Muchnik, and A. Sundararajan. Distinguishing influence-based contagion from homophily-driven diffusion in dynamic networks. Proceedings of the National Academy of Sciences, 106(51):21544–21549, December 2009. [7] L. Backstrom, D. Huttenlocher, J. Kleinberg, and X. Lan. Group formation in large social networks: membership, growth, and evolution. In KDD ’06: Proceedings of the 12th ACM SIGKDD international conference on Knowledge discovery and data mining, pages 44–54, New York, NY, USA, 2006. ACM.
[8] A. Bagherjeiran and R. Parekh. Combining behavioral and social network data for online advertising. In ICDMW ’08: Proceedings of the 2008 IEEE International Conference on Data Mining Workshops, pages 837–846, Washington, DC, USA, 2008. IEEE Computer Society. [9] A.-L. L. Barab´ asi and Z. N. Oltvai. Network biology: understanding the cell’s functional organization. Nature reviews. Genetics, 5(2):101–113, February 2004. [10] Y. Chen, D. Pavlov, and J. Canny. Large-scale behavioral targeting. In Proceedings of the 15th ACM SIGKDD International Conference on Knowledge Discovery and Data Mining, pages 209–218. ACM, New York, USA, 2009. [11] C. Chung, J. Koran, L.-j. Lin, and H. Yin. Model for generating user profiles in a behavioral targeting system. U. S. Patent Application, (11/394,374), 2006. [12] M. De Choudhury, W. A. Mason, J. M. Hofman, and D. J. Watts. Inferring relevant social networks from interpersonal communication. In WWW 2010: Proceedings of the 19th international conference on World Wide Web, 2010. [13] P. Domingos and M. Richardson. Mining the network value of customers. In KDD ’01: Proceedings of the seventh ACM SIGKDD international conference on Knowledge discovery and data mining, pages 57–66, New York, NY, USA, 2001. ACM. [14] J. H. Friedman. Greedy function approximation: A gradient boosting machine. Annals of Statistics, 29:1189– 1232, 1999. [15] M. Gladwell. The tipping point: how little things can make a big difference. Little Brown, Boston, 1st edition, 2000. [16] M. Granovetter. Threshold models of collective behavior. American Journal of Sociology, (83):1420–1443, 1978. [17] J. Hartline, V. Mirrokni, and M. Sundararajan. Optimal marketing strategies over social networks. In WWW ’08: Proceeding of the 17th international conference on World Wide Web, pages 189–198, New York, NY, USA, 2008. ACM. [18] S. Hill, F. Provost, and C. Volinsky. Network-based marketing: Identifying likely adopters via consumer networks. Statistical Science, 22(2):256–275, 2006. [19] D. Kempe, J. Kleinberg, and E. Tardos. Maximizing the spread of influence through a social network. In KDD ’03: Proceedings of the ninth ACM SIGKDD international conference on Knowledge discovery and data mining, pages 137–146, New York, NY, USA, 2003. ACM. [20] D. Kempe, J. Kleinberg, and E. Tardos. Influential nodes in a diffusion model for social networks. In ICALP, 2005.
[21] J. Leskovec and E. Horvitz. Planetary-scale views on a large instant-messaging network. In WWW ’08: Proceeding of the 17th international conference on World Wide Web, pages 915–924, New York, NY, USA, 2008. ACM. [22] M. Mcpherson, L. S. Lovin, and J. M. Cook. Birds of a feather: Homophily in social networks. Annual Review of Sociology, 27(1):415–444, 2001. [23] J. Pine. Mass customizing products and services. Planning Review, July-August, 1993. [24] F. Provost, B. Dalessandro, R. Hook, X. Zhang, and A. Murray. Audience selection for on-line brand advertising: privacy-friendly social network targeting. In KDD ’09: Proceedings of the 15th ACM SIGKDD international conference on Knowledge discovery and data mining, pages 707–716, New York, NY, USA, 2009. ACM. [25] M. Richardson and P. Domingos. Mining knowledgesharing sites for viral marketing. In KDD ’02: Proceedings of the seventh ACM SIGKDD international conference on Knowledge discovery and data mining, pages 51–70, New York, NY, USA, 2002. ACM. [26] Y. Richter, E. Yom-Tov, and N. Slonim. Predicting customer churn in mobile networks through analysis of social groups. In SDM, pages 732–741, 2010. [27] P. Singla and M. Richardson. Yes, there is a correlation: - from social networks to personal behavior on the web. In WWW ’08: Proceeding of the 17th international conference on World Wide Web, pages 655–664, New York, NY, USA, 2008. ACM. [28] R. Walkeri. The hidden (in plain sight) persuaders. The New York Times Magazine, pages 69–75, Dec. 5, 2004. [29] D. J. Watts. A simple model of global cascades on random networks. Proceedings of the National Academy of Sciences of the United States of America, 99(9):5766– 5771, April 2002. [30] D. J. Watts and P. S. Dodds. Influentials, networks, and public opinion formation. Journal of Consumer Research, 34(4):441–458, 2007. [31] D. J. Watts and S. H. Strogatz. Collective dynamics of ‘small-world’ networks. Nature, 393:440–442, June 1998. [32] J. Yan, N. Liu, G. Wang, W. Zhang, Y. Jiang, and Z. Chen. How much can behavioral targeting help online advertising? In Proceedings of the 18th International World Wide Web Conference (WWW 2009), pages 261–270, 2009.