Prediction of neurotoxins based on their function and source
04/17/2007 09:37 PM
In Silico Biology 7, 0025 (2007); ©2007, Bioinformation Systems e.V.
Prediction of neurotoxins based on their function and source Sudipto Saha and Gajendra P. S. Raghava*
Bioinformatics Centre, Institute of Microbial Technology Sector-39A, Chandigarh, India URL: http://www.imtech.res.in/raghava/
* Corresponding author Email:
[email protected] Phone: +91-172-2690557 Fax: +91-172-2690632
Edited by E. Wingender; received December 14, 2006; revised February 22, 2007, and March 23, 2007; accepted March 25, 2007; published April 06, 2007
Abstract We have developed a method NTXpred for predicting neurotoxins and classifying them based on their function and origin. The dataset used in this study consists of 582 non-redundant, experimentally annotated neurotoxins obtained from Swiss-Prot. A number of modules have been developed for predicting neurotoxins using residue composition based on feed-forwarded neural network (FNN), recurrent neural network (RNN), support vector machine (SVM) and achieved maximum accuracy of 84.19%, 92.75%, 97.72% respectively. In addition, SVM modules have been developed for classifying neurotoxins based on their source (e.g., eubacteria, cnidarians, molluscs, arthropods have been and chordate) using amino acid composition and dipeptide composition and achieved maximum overall accuracy of 78.94% and 88.07% respectively. The overall accuracy increased to 92.10%, when the evolutionary information obtained from PSI-BLAST was combined with SVM module of source classification. We have also developed SVM modules for classifying neurotoxins based on functions using amino acid, dipeptide composition and achieved overall accuracy of 83.11%, 91.10% respectively. The overall accuracy of function classification improved to 95.11%, when PSI-BLAST output was combined with SVM module. All the modules developed in this study were evaluated using five-fold cross-validation technique. The NTXpred is available at www.imtech.res.in/raghava/ntxpred/ and mirror site at http://bioinformatics.uams.edu/mirror/ntxpred. Keywords: NTXpred, prediction of neurotoxins, Webserver, blockers of ion channels
Introduction Neurotoxins act on nerve terminal and block nerve impulses. The major source of neurotoxins are (i) eubacteria (produced by genus Clostridium), (ii) cnidarians (where cnidoblast organelles store and deliver toxins), (iii) molluscans (cone), (iv) arthropoda (mainly scorpion and spider), (v) chordates (snake) [Stockman and Heurtault, 1995; Goonetilleke and Harris, 2004]. The neurotoxins can be divided into the following categories based on their function or mechanism of action: (i) blockers of ion channels [Rauer et al., 1999; Escoubas et al., 2000; Gasparini et al., 2004]; (ii) blockers of acetylcholine receptors [Tsetlin and Hucho, 2004]; (iii) inhibitors of neurotransmitter release via matalloproteolytic activity [Rossetto et al., 2004]; (iv) inhibitors of acetylcholine release with phospholipase A2 activity [Rossetto et al., 2004]; (v) facilitators of acetylcholine release [Rash et al., 2000]. The Swiss-Prot protein knowledgebase is maintaining Tox-Prot, the toxin protein annotation program that provides a wealth of information including the description of function, subcellular location, tissue specificity of toxins [Jungo and Bairoch 2005]. There are few organism specific databases such as snake neurotoxin database [Siew et al., 2004] and scorpion toxins [Srinivasan et al., 2002], where information regarding neurotoxin is available. In order to understand the evolutionary history, there is an urgent need to classify the neurotoxins based on their sources, mechanism of actions or target/s on which they work. Such knowledge about the neurotoxins is very important for the development of drugs against pain and epilepsy. Indeed a number of pharmaceuticals companies are working on neurotoxins towards the development of potent drugs [McIntosh and Jones, 2001; Alonso et al., 2003]. http://www.bioinfo.de/isb/2007/07/0025/main.html
Page 1 of 14
Prediction of neurotoxins based on their function and source
04/17/2007 09:37 PM
companies are working on neurotoxins towards the development of potent drugs [McIntosh and Jones, 2001; Alonso et al., 2003]. In this study, a systematic attempt was made to collect, compile and analyze the neurotoxins obtained from literature and public databases. It was observed that the amino acids in neurotoxins are more conserved than non-toxin proteins. In order to understand neurotoxins, analyses were carried on neurotoxins from different sources and based on it a method was developed. It was observed that neurotoxins coming from same source are more conserved in terms of their amino acid compositions. Based on this observation, methods were developed to classify the neurotoxins based on their source. During our analysis, it was observed that proteins coming from the same source varied in their function or target of action, thus enabling us to classify such proteins based on their functions as well.
Methods Collection and compilation of neurotoxin and non-toxin proteins The Swiss-Prot knowledgebase provides the current knowledge on protein toxins and each toxin is annotated according to the quality standards of Swiss-Prot [Jungo and Bairoch, 2005]. Searching was done for neurotoxins in Swiss-Prot database (http://au.expasy.org/sprot/) using neurotoxin as keyword. Each protein that was obtained from our query search, was examined manually to eliminate non-neurotoxins and thereby obtained 932 proteins. The full text entry (Swiss-Prot) of these neurotoxins was examined and they were classified based on their source and function (Tab. 1). Non-toxin protein sequences were obtained from Swiss-Prot by combined search using SRS (http://www.expasy.org/srs5/. The query was performed by searching for the term "function" in the "Comment" field but excluding entries with the term "toxin" in the same field by the 'BUTNOT' option of SRS. The retrieved protein sequences were checked in order to eliminate toxin proteins.
Table 1: Distribution of neurotoxins showing source and functions obtained from Swiss-Prot. Source
Function IAR 1
IAR 2
FAR
BIC Na
Eubacteria (13) (Clostridium sp.)
K
Cl
Total
L
S
K
W
OTH Total
10
3
Cnidaria (31) (Sea Anemone)
2
Mollusca (111) (Cone) Arthropoda (479)
Ca
BAR
Scorpion (314) Spider (165)
Chordata (295) Snake
13 46
22
0
6
0
28
16
34
3
0
55
179
1
103
11
293
27
43
11
0
81
1
25
7
0
33
1 27
22 10
37
63
5
16
7
54
171
21
IAR 1 =Inhibitors of acetylcholine release by metalloproteolytic activity; IAR 2 = Inhibitors of acetylcholine release by phospholipase A 2 activity; FAR= Facilitators of acetylcholine release; BIC= Blockers ion channels; BAR= Blockers of acetylcholine receptors; L=long; S=Short, K=Kappa; W=Weak; OTH=Others, include myotoxic, anticoagulant, hemorraghic, hypotensive, bactericidal activity and excitatory symptoms.
Data set The PROSET software [Brendel, 1992] was used to to prune the data so that the final dataset consisted of 582 non-redundant protein sequences where no two proteins had more than 90% sequence identity. The data set is available at http://www.imtech.res.in/raghava/ntxpred/dataset.html. These 582 non-redundant neurotoxin sequences were classified based on source into (i) eubacteria (13); (ii) cnidaria (23); (iii) mollusca (95); (iv) arthropoda (313); (v) chordata (138); and these nonredundant neurotoxin sequences were further classified into five sub-classes based on their target of action as (i) ion channels blockers (332); (ii) blockers of acetylcholine receptors (89); (iii) inhibitors of neurotransmitter release via matalloproteolytic activity (8); (iv) inhibitors of acetylcholine release with phospholipase A2 activity (21); (v) facilitators of acetylcholine release (10). Subsequently, the ion channel blockers sequences were sub-classified into specific ion channel blockers as (i) calcium (81); (ii) chloride (8); (iii) potassium (91); (iv) sodium (150) ion channel blockers.
Analysis of data
http://www.bioinfo.de/isb/2007/07/0025/main.html
Page 2 of 14
Prediction of neurotoxins based on their function and source
04/17/2007 09:37 PM
The amino acid composition of each class based on the source and the functions were analyzed. The mean, median, and standard deviation of each amino acid residues in a particular class and the length of the neurotoxin sequences were calculated.
Performance measures The performance of the modules constructed in this study was evaluated using a 5-fold cross-validation technique. For five-fold cross-validation, the relevant dataset was randomly divided into five sub-sets. The training and testing was carried out five times, each time using one distinct set for testing and the remaining four sets for training. Four threshold-dependent parameters – sensitivity, specificity, accuracy and Matthew's correlation coefficient (MCC) – were used for discriminating neurotoxins and nontoxin sequences [Baldi et al., 2000]. The threshold independent parameters, receiving operating characteristics (ROC), area under curve (AUC) were also measured. For evaluating the performance of various modules for classification of neurotoxin sequences based on source and function, accuracy and Matthew's correlation coefficient (MCC) were calculated using the following equations:
Here x can be any functional class (eubacteria, cnidaria, molusca, arthropoda and chordata source), p ( x) is the number of correctly predicted sequences of function x, Exp ( x) is the number of sequences observed in location x, n ( x) is the number of correctly predicted sequences not of function x, u ( x) is the number of under-predicted sequences and o ( x) is the number of overpredicted sequences.
Support vector machine (SVM) The SVM was implemented using freely downloadable software package SVM_light [Joachims, 1999]. The software enables the user to define a number of parameters as well as to select from a choice of inbuilt kernel functions, including a radial basis function (RBF) and a polynomial kernel. The preliminary tests showed that the radial basis function (RBF) kernel gave better results than other kernels. Therefore, in this work the RBF kernel was used for all the experiments. The prediction of functions is a multi-class classification problem. A series of binary classifiers was developed to handle the multi-classification problem and constructed N SVMs for N -class classification using 1 vs r (one against rest) strategy. Here, the class number was equal to five for neurotoxin source and function. The i th SVM was trained with all samples in the ith class with positive labels and the rest of the samples with negative labels. In this way, five SVM modules were constructed for classification of neurotoxin based on source into eubacteria, cnidaria, mollusca, arthropoda and chordata; and also five SVM modules were constructed for classification of neurotoxin based on function as to block ion channels, block acetylcholine receptors, inhibit acetylcholine release by metalloproteolytic activity and phospholipase A2 and to facilitate acetylcholine release.
Artificial neural network In this study, feed-forwarded neural networks (FNN) and partial recurrent neural network (RNN) with a single hidden layer have been used to classify neurotoxins and non-toxins. The publicly available free simulation packages SNNS, version 4.2, from Stuttgart University has been used to implement the neural networks [Zell and Mamier, 1997]. It allows incorporation of the resulting network into an ANSI C function for use in the stand-alone code. At the start of each simulation, the weights were initialized with random values. The training was carried out by using error back-propagation, with a sum of square error function [Rumelhart et al., 1986]. The magnitude of the error sum in the test and training set was monitored in each cycle of the training. The ultimate number of cycles was determined when the network converges. During testing, a cut-off value was set for each network, and the output produced by the network was compared with the cut-off value. If the output value was greater than the threshold value, then that sequence was predicted as neurotoxins, otherwise considered as a non-toxin. For each network, the cut-off value was adjusted so that it yielded the highest accuracy for that network. In this study we have used uniform/same parameters for learning of five networks on different training sets during the five-fold cross validation. The best result was achieved by maintaining uniform parameters over the five sub-sets.
Protein features Amino acid composition and length
http://www.bioinfo.de/isb/2007/07/0025/main.html
Page 3 of 14
Prediction of neurotoxins based on their function and source
04/17/2007 09:37 PM
The amino acid composition is the fraction of each amino acid in a protein. The fraction of all 20 natural amino acids was calculated using the following equation:
where i can be any amino acid. We added the length of protein sequence as an additional dimension to the amino acid composition, final vector having dimension 21 (20 for amino acid composition + 1 for length of the sequence). Dipeptide composition and length The dipeptide composition was used to encapsulate the global information about each protein sequence, which would give a fixed pattern length of 400 (20 × 20). This representation encompassed the information about the amino acid composition along local order of amino acid. The fraction of each dipeptide was calculated using the following equation:
where dipep ( i ) is one out of 400 dipeptides. The information of length has also been included along with dipeptide composition. PSI-BLAST A module of PSI-BLAST [Altschul et al., 1997] was designed in which the query sequences in the test dataset were searched against the proteins sequences in the training dataset using PSI-BLAST. Three iterations of PSI-BLAST were carried out at a cutoff E -value of 0.001. The module could predict neurotoxins, any of the five sources (eubacteria, cnidaria, mollusca, arthropoda and chordata) and functions (blockers of ion channels, blockers of acetylcholine receptors, inhibitors of acetylcholine release by metalloproteolytic activity and phospholipase A2 and facilitators of acetylcholine release) and sub-classification of blockers of ion channels (sodium, potassium, calcium and chloride) depending upon the similarity of the query protein sequence to the protein sequences in the dataset. MEME/MAST MEME/MAST [Bailey and Elkan, 1994; Bailey and Gribskov, 1998]: version 3.0.4, obtained from http://meme.sdsc.edu/meme/ website. MEME (Multiple Em for Motif Elicitation) is a tool for discovering motifs in a group of related protein sequences. A motif is a sequence pattern that occurs repeatedly in a group of related protein sequences. MEME represents motifs as positiondependent letter-probability matrices, which describe the probability of each possible letter at each position in the pattern. MEME takes as input a group of protein sequences (the training set) and output as many motif as requested. MEME uses the statistical modeling techniques to automatically choose the best width, number of occurrences, and description for each motif. MAST (Motif Alignment and Search Tool) is a tool for searching biological sequence databases for sequences that contain one or more of a group of known motifs. MAST takes as input a file containing the descriptions of one or more motifs and searches the sequence databases that have been created by matching the motifs. Hybrid approach The objective of this approach is to improve the sensitivity as well as the specificity of the prediction method. Each approach has its own limitations, as some provides high sensitivity but low specificity and vice versa. In order to get high sensitivity without loosing much specificity or high specificity with reasonable percent coverage, we have combined the two approaches. First, SVM and PSI-BLAST results were combined, where there was hit by PSI-BLAST, preference was given and in case of no hits, SVM results were used. Similarly, SVM and MEME/MAST results were used in the hybrid study. Genome annotation of by NTX server Presently, the genome sequence of an organism producing neurotoxins is not publicly available. So, all the proteins of a particular species was obtained from NCBI (http://www.ncbi.nlm.nih.gov/entrez/query.fcgi?CMD=Index&DB=protein) and Swiss-Prot (http://www.expasy.org/srs5/) by using the specific organism name in the query field. For example, it was observed that there are 95 entries in NCBI by using "Naja naja" in the query field; where as the same species has 35 protein entries in Swiss-Prot. In a similar way, protein sequences of seven different species were obtained: (i) Naja naja, (ii) Bungarus multicintus, (iii) Crotalus durissus terrificus, (iv) Mesobuthus martensii, (v) Anthopleura elegantissima, (vi) Conus striatus, and (viii) Clostridium botulinum. NTXpred server was used for validation of these protein sequences. The SVM module based on amino acid composition with default threshold (0.00) was used for prediction of these protein sequences. Description of server
http://www.bioinfo.de/isb/2007/07/0025/main.html
Page 4 of 14
Prediction of neurotoxins based on their function and source
04/17/2007 09:37 PM
Based on our study, the NTXpred server was developed that allows predicting neurotoxins and further classifying neurotoxins based on function and source. The server accepts the protein sequences in any standard format like EMBL, GCG, and FASTA or in plain text format. The server uses the readseq program (http://iubio.bio.indiana.edu/soft/molbio/readseq/) to read the input sequences. The server allows users to predict neurotoxins, its source, probable function and further sub-classification of ion channels blockers. The server provides the option of prediction either on the basis of amino acid or amino acid and length or dipeptide composition or dipeptide composition and length or PSI-BLAST. The server links to Bcepred server [Saha and Raghava, 2004]) for prediction of B-cell epitope in the neurotoxins protein. This will help the users interested in generating antibodies against the toxin. The results provide summarized information about the query sequence and prediction. The server and related information is available from www.imtech.res.in/raghava/ntxpred and mirror site at http://bioinformatics.uams.edu/mirror/ntxpred/.
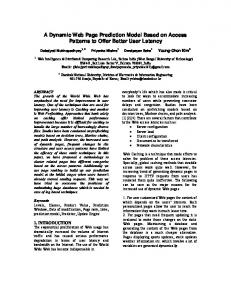
Results Analysis of data Sequence features of neurotoxins and non-toxins The amino acid composition of proteins belonging to neurotoxins and non-toxins were calculated and comparison was done on the average amino acid composition for these two groups of protein sequences (Fig. 1). It was observed that the frequency of cysteine residue (polar, uncharged) in the neurotoxin sequences was significantly higher than in the non-toxin sequences. The composition of neurotoxins was significantly different from non-toxins at 0.01 level for the residues alanine, cysteine, glutamic acid, isoleucine, lysine, leucine, asparagines, glutamine, methionine, valine and tyrosine (Tab. 2). It is interesting to note that the average composition of cysteine was much higher than other amino acids in case of neurotoxin sequences.
Figure 1: The average amino acid composition of neurotoxin and non-toxin proteins.
Table 2: The P -value of amino acid residues of the compositional analysis of neurotoxins and nontoxin protein sequences. Residues
Average composition of neurotoxin
Average composition of nontoxin
P -value
Alanine (A)
5.12
7.45
3.18E-5
Cysteine (C)
13.69
1.95
1.91E-10
Aspartic acid (D)
4.95
5.18
0.48
Glutamic acid (E)
3.81
6.54
9.81E-5
Phenylalanine (F)
2.90
3.98
0.00421
Glycine (G)
8.84
6.56
2.75E-4
Histidine (H)
1.62
2.21
0.01754
Isoleucine (I)
3.91
5.37
5.48E-4
Lysine (K)
8.41
6.03
6.50E-4
Leucine (L)
5.53
10.17
2.49E-6
Methionine (M)
1.98
2.49
5.91E-4
Asparagine (N)
5.05
3.98
1.02E-5
http://www.bioinfo.de/isb/2007/07/0025/main.html
Page 5 of 14
Prediction of neurotoxins based on their function and source
04/17/2007 09:37 PM
Proline (P)
4.61
5.05
0.29
Glutamine (Q)
2.35
4.16
4.86E-5
Arginine (R)
4.82
5.25
0.17
Serine (S)
5.96
7.22
0.00
Threonine (T)
5.48
5.29
0.62
Valine (V)
4.41
6.86
6.37E-4
Trytophan (W)
1.87
1.22
0.03
Tyrosine (Y)
4.61
3.01
3.13E-5
Bold residues are significantly different in both classes in terms of P -value.
Sequence features of different sources of neurotoxins It was observed that amino acid compositions of neurotoxin sequences obtained from different sources have biased composition. The average amino acid composition of neurotoxins obtained from various sources was computed and a graph for each amino acid for various sources was plotted (Fig. 2). The eubacterial neurotoxins contained higher amount of isoleucine, leucine (nonpolar), asparagines (polar, uncharged) and lower amount of cysteine and histidine residues. Neurotoxins from the phylum cnidaria have higher amount of glycine (non-polar) and lower amount of leucine (non-polar) and glutamine (polar, uncharged) whereas the neurotoxins produced by the phylum mollusca showed higher amount of cysteine, proline (non-polar) and arginine (positively charged) and lower amount of tyrosine (aromatic). The neurotoxins from the phylum arthropoda have higher amount of lysine (positively charged) and lower amount of threonine (polar, uncharged). Higher amount of glutamine and theonine (polar, uncharged) was present in the neurotoxins produced by the phylum chordata (snake). These observations indicated that the neurotoxin sequences belonging to different sources have specific amino acid composition.
Figure 2: The average amino acid composition of neurotoxin proteins based on source: Bac, bacteria; Cni, cnidaria; Mol, mollusca; Art, arthropoda; Cho, chordata.
Sequence features of functional neurotoxins It has been shown in the past that the target and mechanism of action of all neurotoxins is not same [Rash et al., 2000; Gasparini et al., 2004; Rossetto et al., 2004; Tsetlin and Hucho, 2004], thus the neurotoxin sequences were categorized based on their target of action or function in five categories. The average composition of each type of amino acid for all five categories including each type block ion channels (BIC) has been shown in Fig. 3. The ion channel blocker protein sequences have high amount of cysteine and glycine (non-polar); sodium ion channel inhibitors have high tyrosine (aromatic) and low amounts of glutamine (polar, uncharged); potassium ion channels inhibitor sequences have higher amount of lysine (positively charged); calcium ion channel inhibitor sequences have higher amount of serine (polar, uncharged); whereas chloride ion channel inhibitor sequences have higher amount of phenylalanine (non-polar, aromatic), proline (non-polar) and significantly lower amounts of serine (polar,uncharged) and tryptophan (non-polar, aromatic). The blockers of acetylcholine receptor sequences have higher amount of proline (non-polar) and threonine (polar, uncharged) and lower amount of alanine (non-polar). Alanine (non-polar) and tyrosine (non-polar, aromatic) were present in higher amounts in the functional protein sequences that inhibited the release of acetylcholine by phospholipase A2 activity. Similarly, isoleucine (non-polar) and asparagine (polar, uncharged) were present in higher number and cystein in low amount in the neurotoxin protein sequences that inhibited acetylcholine release by matalloproteolytic activity. The protein sequences, which facilitate acetylcholine release, had significantly lower amount of threonine (polar, uncharged).
http://www.bioinfo.de/isb/2007/07/0025/main.html
Page 6 of 14
Prediction of neurotoxins based on their function and source
04/17/2007 09:37 PM
Figure 3: The average amino acid composition of neurotoxin proteins based on functions: BIC, blockers ion channels; BIC_Na, blockers of sodium channels; BIC_K, blockers of potassium channels; BIC_Ca, blockers of calcium channels; BIC_Cl, blockers of chloride channels; BAR, blockers of acetylcholine receptors; IAR2 , inhibitors of acetylcholine release by phospholipase A2 activity; IAR1 , inhibitors of acetylcholine release by matalloproteolytic activity; FAR, facilitators of acetylcholine release.
Analysis of length The average length of all neurotoxin protein sequences is 89.96, whereas that of an average non-toxin protein sequence is 491.83 amino acid residues. Though the average length of neurotoxin sequences is comparatively lower than that of non-toxin protein sequences, the bacterial neurotoxin sequences showed large variations in the length from 1162 to 1314, and the average length is more than 1257 amino acid residues. In case of arthropodas, maximum length of neurotoxin sequences was around 1400 amino acid residues but mean and median was small, indicating that most neurotoxin sequences belonging to arthropodas are small proteins. Besides the toxins from bacterial origin, the neurotoxins sequences belonging to chordata have average length more than other classes of neurotoxins (cnidaria, mollusca, arthropoda). As shown in Fig. 4a, the average lengths of neurotoxin sequences produced by five different sources have variations in the average length of proteins. The neurotoxin sequences based on their function were grouped and the minimum, mean, median and maximum length for each group of neurotoxins were computed. As shown in Fig. 4b, IAR1 (Inhibitors of acetylcholine release by metalloproteolytic activity) neurotoxins have the highest average length followed by FAR (Facilitators of acetylcholine release) and IAR2 (Inhibitors of acetylcholine release by phospholipase A2 activity). Higher average length of IAR1 was expected, as they are mostly bacterial proteins.
Figure 4: Minimum, mean, median and maximum of length of neurotoxins (A) obtained from bacteria, cnidaria, mollusca, arthropoda, and chordata; (B) whose target of action are BIC, blockers ion channels; BIC_Na, blockers of sodium channels; BIC_K, blockers of potassium channels; BIC_Ca, blockers of calcium channels; BIC_Cl, blockers of chloride channels; BAR, blockers of acetylcholine receptors; IAR2 , inhibitors of acetylcholine release by phospholipase A2 activity; IAR1 , inhibitors of acetylcholine release by matalloproteolytic activity; FAR, facilitators of acetylcholine release.
Prediction and classification of neurotoxins Having the analyses of neurotoxin sequence features, an attempt was made to predict and classify neurotoxin protein sequences based on their source and functions. Furthermore, the ion channel blockers were sub-classified into four specific categories – sodium, potassium, calcium and chloride ion blockers. The input features, used for ANN and SVMs, was a fixed-length vector using the amino acid and dipeptide composition from the primary amino acid sequence and protein length. The performance of the methods based on ANN, SVM,PSI-BLAST and MEME/MAST were validated using five fold cross-validation. Subsequently hybrid study was also performed to improve the performance of different SVM modules further.
Prediction of neurotoxins ANN based method The feed-forward neural network (FNN) and recurrent neural network (RNN) were used in the study to classify the neurotoxins and non-toxins at different hidden nodes with a single layer. It was observed that at 35 hidden nodes and at 0.5 threshold it http://www.bioinfo.de/isb/2007/07/0025/main.html
Page 7 of 14
Prediction of neurotoxins based on their function and source
04/17/2007 09:37 PM
and non-toxins at different hidden nodes with a single layer. It was observed that at 35 hidden nodes and at 0.5 threshold it showed maximum accuracy of 84.19%, where as RNN showed maximum accuracy of 92.75% at 60 hidden nodes as presented in Supplementary Tables S1 and S2. PSI-BLAST Different E-value was used as a cut off to evaluate the PSI-BLAST method in predicting the neurotoxins. The performance of PSI-BLAST for the prediction of neurotoxins at different E -values has been shown in Supplementary Table S3. The maximum sensitivity of 68.60% with specificity of 95.09% was achieved (Tab. 3).
Table 3: The performance of various approaches used in prediction of neurotoxins and nontoxins. Approach
Sensitivity
Specificity
PPV
Accuracy
MCC
FNN (0.5 threshold)
89.65%
78.78%
88.39%
84.19%
0.6890
RNN (0.45 threshold)
89.12%
96.35%
96.03%
92.75%
.8572
SVM Comp (C)
96.32%
97.22%
97.72%
97.72%
0.9416
SVM Dipep
93.68%
98.42%
98.41%
96.05%
0.9247
C + length
97.54%
97.19%
97.25%
97.37%
0.9485
SVM Dipep + length
96.67%
95.09%
95.28%
95.88%
0.9195
PSI-BLAST ( E -value 10 -2 )
68.60%
95.09%
MEME/MAST ( E -value 10 -1 )
35.96%
99.13%
C + MEME/MAST ( E -value 10 -1 )
96.84%
96.84%
96.84%
96.84%
0.9368
SVM based method A SVM module was developed to discriminate the neurotoxins from the non-toxin protein sequences. The performance of various modules, developed for discriminating neurotoxins from non-toxins sequences, have been shown in Tab. 3. The results indicated that the method has the capability to differentiate the neurotoxins from the non-toxin proteins with high accuracy of 97.72% and MCC of 0.94 based on amino acid composition as input feature, when evaluated through 5-fold cross-validation. The best results were obtained using RBF kernel with γ = 10, c = 10, j = 1. The performance of SVM module obtained with the dipeptide composition as input feature was similar to that obtained with the amino acid composition. These results indicated that the neurotoxin sequences could be predicted with high level of accuracy, from their primary amino acid sequence (Tab. 3). Since our analysis showed that the average length of neurotoxins was much lower than non-toxins, therefore the length as an additional feature along with amino acid composition was used and the number of features increased to 21 (20 for composition and 1 for length). The incorporation of length as an additional feature did not improve the performance of SVM module, due to the exceptionally longer amino acid length sequences of toxins from bacterial origin. MEME/MAST The performances of MAST at different E -values were carried out on MEME matrix formed on neurotoxins sequences based on five fold cross validation. Five MEME matrices have been created corresponding to five learning sets, one matrix for one learning set (four sets). Then each matrix was used as input file for searching motifs in the remaining set (testing set) using program MAST. It was observed that the sensitivity increases from 28.95% to 69.29% on increase in E -value from 10 -4 to 100 (Supplementary Table S4). SVM module based on the composition was combined with MEM/MAST as shown in Tab. 2 (More information is shown in Supplementary Table S5).
Classification based on source To classify neurotoxin sequences based on their source, another SVM module was developed. Artificial neural network based on the composition was tried, but it failed in multi-class classification. The performance of various modules based on source has been shown in Tab. 4. The overall accuracy of PSI-BLAST (state of the art similarity based technique) was found to be 71.40% and MEME/MAST based on motif was found to be 58.59% (different E -value as shown in Supplementary Table S6), which was lower than the all SVM modules used in this study. As shown in Tab. 4, the SVM modules based on the amino acid composition could classify neurotoxin sequences with an accuracy of 78.94% and 88.07%, respectively. These results indicated that SVM module based on dipeptide composition as input feature was more accurate than that obtained with amino acid composition in classification of the neurotoxins based on their source. It was interesting that the inclusion of the length feature along with the http://www.bioinfo.de/isb/2007/07/0025/main.html
Page 8 of 14
Prediction of neurotoxins based on their function and source
04/17/2007 09:37 PM
amino acid composition improved the accuracy from 78.94% to 84.91%. The addition of length feature in the dipeptide composition did not affect the accuracy. The overall accuracy of composition, dipeptide, composition and length, dipeptide and length SVM modules were 78.94%, 88.07%, 84.91% and 87.72%, respectively. The results were obtained using RBF kernel and γ , c and j values used for developing SVM modules using various features are available in the supplementary material (http://www.imtech.res.in/raghava/ntxpred/supplementary.html/). In classifying the neurotoxins based on their source, lower accuracy was achieved for cnidaria (30-55%) class, whereas 100% accuracy (amino and dipeptide composition) was achieved in eubacteria, 95% accuracy in arthropoda (amino composition with length) and 90.37% in chordata (dipeptide composition). In order to utilize the power of SVM technique and PSI-Blast (state of the art technique of sequence similarity), both were combined. In this hybrid module, the prediction was done using PSI-BLAST if the query sequence in testing dataset showed significant similarity with the training dataset, otherwise SVM module was used for the prediction. The hybrid module that had combined PSIBLAST and SVM module with composition and length, had achieved maximum accuracy of 92.10%, whereas the hybrid module that had combined MEME/MAST and SVM module with composition and length, had achieved maximum accuracy of 92.53%. Various MAST E -values were used with SVM modules to get the maximum accuracy as shown in Supplementary Table S9.
Table 4: The performance of various approaches used in classification of neurotoxins based on source. Approach
Eubacteria
Cnidaria
Mollusca
Arthropoda
Chordata
Overall
ACC
MCC
ACC
MCC
ACC
MCC
ACC
MCC
ACC
MCC
Composition (A)
100
0.9134
30.00
0.4441
63.16
0.5804
86.45
0.6426
78.52
0.7495
78.94
Dipeptide (B)
100
0.8671
50.00
0.6776
76.84
0.7426
92.58
0.8069
90.37
0.8911
88.07
A + length (C)
90
0.8656
50.00
0.5893
70.53
0.7433
95.16
0.7385
76.30
0.7854
84.91
B + length (D)
90
0.8656
55.00
0.6169
83.16
0.7998
94.19
0.8075
80.74
0.8079
87.72
PSI-BLAST (E)
90
70.00
54.74
67.74
90.37
71.40
-
60.00
49.47
53.54
80.74
58.59
MEME/MAST* (F)
ACC
Hybrid1 (E+A)
100
0.8421
70.00
0.7757
78.95
0.7527
92.58
0.8409
97.04
0.9518
90.70
Hybrid2 (E+B)
100
0.8128
70.00
0.8321
81.05
0.7726
93.87
0.8692
96.30
0.9421
91.58
Hybrid3 (E+C)
90
0.8182
70.00
0.8025
80.00
0.8361
97.74
0.8611
91.11
0.9314
92.10
Hybrid4 (E+D)
90
0.8182
70.00
0.8026
85.26
0.8176
95.48
0.8762
90.37
0.8970
91.58
Hybrid5 (F+A)
100
0.8421
65.00
0.7430
77.89
0.7145
90.97
0.8128
95.56
0.9418
89.12
Hybrid6 (F+B)
100
0.7863
65.00
0.8011
82.11
0.7799
93.23
0.8515
93.33
0.9126
90.53
Hybrid7 (F+C)
90
0.8182
60.00
0.7373
77.89
0.7968
96.13
0.8053
84.44
0.8713
88.95
Hybrid8 (F+D)
90
0.8182
60.00
0.7373
85.26
0.8068
94.19
0.8269
83.70
0.8365
88.94
ACC: Accuracy; MCC: Matthew's correlation coefficient. * E -value 0.1
Classification based on function and sub-classification ion channels inhibitors The functional annotation is an important feature and of major interest to the experimental biologists. So, an attempt has been made to predict the functions of the neurotoxins from primary amino acids based on composition and sequence analysis. The performance of various the SVM modules based on various features, PSI-BLAST, MEME/MAST (different E -value shown in Supplementary Table S7) and hybrid approach has been summarized in Tab. 5 (more information is available in Supplementary Table S10). The SVM module based on dipeptide composition with length had achieved maximum overall accuracy of 94.88% and the hybrid approach of SVM module (Dipeptide composition + length) with PSI-BLAST and MEME/MAST showed an overall accuracy of 95.11% and 96% respectively. The prediction accuracy was 100% for neurotoxin proteins that inhibited acetylcholine release by phospholipase or matalloproteolytic activity were achieved. The functional classes that blocked acetylcholine receptors and that inhibited ion-channels were predicted with the accuracy of 97.65% and 95.45% respectively. The lowest accuracy was achieved in neurotoxins that facilitated achtylcholine release (30-70%). All the SVM modules showed higher accuracy than PSIBLAST and MEME/MAST. The hybrid approach increased the overall accuracy as compared to the individual modules. The subclassification of ion-channel blockers was also studied, since these are of particular interest to the pharmaceutical companies. The maximum overall accuracy of ion-channel blockers was 70.77%, when dipeptide and length information was used as input vector and MEME/MAST (different E -value shown in Supplementary Table S8) achieved accuracy of 52.31%.
Table 5: The performance of various approaches used on classification of neurotoxins based on function. Approach
BIC
http://www.bioinfo.de/isb/2007/07/0025/main.html
BAR
IAR 1
IAR 2
FAR
Overall Page 9 of 14
Prediction of neurotoxins based on their function and source
ACC
MCC
04/17/2007 09:37 PM
ACC
MCC
ACC
MCC
ACC
MCC
ACC
MCC
ACC
Composition(A)
87.58 0.6255
75.29 0.6902
100.00
1.000
65.00
0.5860
30.00
0.2209
83.11
Dipeptide (B)
94.24 0.7664
85.88 0.8318
100.00
0.9406
90.00
0.9199
30.00
0.3406
91.10
A+length (C)
94.24 0.6857
69.41 0.6737
100.00
1.000
85.00
0.8752
50.00
0.6219
88.22
B+length(D)
95.45 0.8805
97.65 0.9660
100.00
1.000
90.00
0.8035
60.00
0.7625
94.88
PSI-BLAST (E)
52.73
84.71
100.00
100.00
70.00
61.78
MEME/MAST* (F)
26.97
78.82
100.00
95.00
60.00
41.33
Hybrid1 (E+A)
90.61 0.7843
85.88 0.7715
100.00
1.00
100.00 0.8536
70.00
0.5598
89.83
Hybrid2 (E+B)
93.33 0.8130
88.24 0.8232
100.00
0.9118
100.00 0.9512
70.00
0.6300
92.22
Hybrid3 (E+C)
95.45 0.8418
85.88 0.8259
100.00
1.00
100.00 0.9292
80.00
0.8399
93.55
Hybrid4 (E+D)
94.85 0.8869
97.65 0.9501
100.00
1.00
100.00 0.7666
70.00
0.8338
95.11
Hybrid5 (F+A)
90.91 0.7631
82.35 0.7640
100.00
1.00
95.00
0.8247
80.00
0.6027
89.33
Hybrid6 (F+B)
94.24 0.8277
88.24 0.8420
100.00
0.9118
100.00 0.9748
80.00
0.6940
93.11
Hybrid7 (F+C)
95.15 0.8058
81.18 0.7870
100.00
1.00
100.00 0.9512
80.00
0.8399
92.44
Hybrid8 (F+D)
95.45 0.9029
98.82 0.9714
100.00
1.00
100.00 0.7795
80.00
0.8924
96.00
BIC= Blocks ion channels;BAR= Blocks acetylcholine receptors; IAR 1 =Inhibits Ach release by metalloproteolytic activity; IAR 2 = Inhibits Ach release by phospholipase A 2 activity; FAR= Facilitates acetylcholine release; ACC: Accuracy; MCC: Matthew's correlation coefficient. *
E -value 0.1
The hybrid approach of using PSI-BLAST and MEME/MAST increased the overall accuracy of this feature by 5%. The performance of various SVM modules based on various features, PSI-BLAST and MEME/MAST has been summarized in Tab. 6 (more information is shown in Supplementary Table S11).
Table 6: The performance of various modules including SVM modules on classification of ion channel inhibitors. Approach
Sodium
Potassium
Calcium
Chloride ACC
MCC
Overall
ACC
MCC
ACC
MCC
ACC
MCC
ACC
Composition (A)
72.00
0.5369
68.89
0.5219
35.00
0.1605
100.00
0.8379
62.46
Dipeptide (B)
75.33
0.3635
70.00
0.6908
50.00
0.3502
100.00
1.000
68.00
A + length (C)
63.33
0.4782
73.33
0.5481
48.75
0.3211
60.00
0.5403
62.46
B + length (D)
78.00
0.5508
73.33
0.7082
55.00
0.4234
60.00
0.6000
70.77
PSI-BLAST (E)
62.67
62.22
55.00
100.00
61.23
MEME/MAST (F)
56.00
58.88
35.00
100.00
52.31
Hybrid1 (E+A)
74.00
0.6228
73.33
0.6248
65.00
0.4600
100.00
0.7868
72.00
Hybrid2 (E+B)
73.33
0.6038
74.44
0.7386
71.25
0.4564
100.00
1.000
73.54
Hybrid3 (E+C)
66.67
0.5637
75.56
0.5890
63.75
0.4285
100.00
0.9111
68.92
Hybrid4 (E+D)
75.33
0.6284
78.89
0.7498
68.75
0.4702
100.00
1.000
75.08
Hybrid5 (F+A)
74.00
0.5719
81.11
0.6515
48.75
0.3721
100.00
0.7407
70.03
Hybrid6 (F+B)
75.33
0.5479
76.67
0.7478
57.50
0.3754
100.00
1.00
71.69
Hybrid7 (F+C)
66.67
0.5502
80.00
0.6200
60.00
0.4179
100.00
0.91114
69.23
Hybrid8 (F+D)
78.00
0.5795
77.78
0.7637
65.00
0.4877
100.00
1.00
75.08
ACC: Accuracy; MCC: Matthew's correlation coefficient.
Genome annotation results The proteins of seven different species obtained from NCBI and Swiss-Prot were predicted as neurotoxins and non-toxins using SVM module based on amino acid composition is shown in Tab. 7. Most of the predicted neurotoxins were found to be really neurotoxins and chances of 'false positive prediction' (i. e., predicted neurotoxins, but they are not neurotoxins) were few. In case of snake species, the cytotoxins, cardiotoxins and myotoxins were predicted as neurotoxins. http://www.bioinfo.de/isb/2007/07/0025/main.html
Page 10 of 14
Prediction of neurotoxins based on their function and source
04/17/2007 09:37 PM
Table 7: The performance of the amino acid composition based SVM modules at default threshold (0.0) on proteins obtained from NCBI and Swiss-Prot of seven different species. NCBI Real
Swiss-Prot
Predicted
Real
NT
NNT
ACC
Predicted NT
NNT
ACC
i) Naja naja Non-toxin
24
6
18
75.0%
17
3
14
82.3%
Neurotoxin
50
50
0
100%
14
14
0
100%
Other toxin (cytotoxin)
21
21*
4
4*
Non-toxin
8
2
6
75.0%
6
0
6
100%
Neurotoxin
155
152
3
98.0%
43
41
2
95.3%
Cytotoxin
6
5*
5
5*
Synthesized peptide
13
13*
Unnamed
3
3*
Non-toxin
75
5
70
93.4%
49
0
49
100%
Neurotoxin
6
6
0
100%
3
3
0
100%
Myotoxin
24
24*
10
10*
Un-identified
1
1*
Non-toxin
9
2
7
77.8%
10
2
8
80%
Neurotoxin
149
147
2
98.7%
84
80
4
95.2%
Putative neurotoxin
3
2
Unknown
22
17*
Venom peptide
6
4*
Anti-peptide (tumor,epilepsy)
3
3*
Non-toxin
51
11
40
78.4%
21
5
16
76.2%
Neurotoxin
13
13
0
100%
7
7
0
100%
Non-toxin
5
3
2
40.0%
3
1
2
66.7%
Neurotoxin
76
76
0
100%
38
38
0
100%
Non-toxin
-
ND
ND
7
3
4
57.1%
Neurotoxin
127
104
23
10
7
3
70%
ii) Bungarus multincintus
iii) Crotalus durissus terrificus
iv) Mesobuthus martensii
v) Anthopleura elegantissima
vi) Conus striatus
vii) Clostridium botulinum 81.2%
NT=predicted neurotoxin; NNT=predicted not neurotoxin; AAC=CP*100%/TNP; where CP=correctly predicted; TNP=Total number of protein; ND=Not done * denotes that these are predicted as neurotoxin All the NCBI (gi number) and Swiss-Prot numbers used are available in the supplementary material.
Discussion One of the major challenges in the functional proteomics is to predict the functions of the proteins. Presently, genomes of more than 1428 organisms are either completely sequenced or are in an advanced stage of sequencing. Though the complete set of proteins from a number of organisms is known but the functional annotation is very limited. In the past, a number of attempts have been made to predict the function of proteins directly or indirectly from its amino acid sequences. The neurotoxins are used in the studies of ion channels and receptor, drug discovery and formulation of insecticides. These toxin data is scattered across http://www.bioinfo.de/isb/2007/07/0025/main.html
Page 11 of 14
Prediction of neurotoxins based on their function and source
04/17/2007 09:37 PM
public databases, which provide sequence and structural descriptions, but very limited functional annotation. In this study, emphasis has been given on the toxin specially the neurotoxins and attempt has been made to develop methods for prediction/classification of the neurotoxins. The toxin entries in the public DNA and protein databases represent only a small fraction of