Andrew Kusiak e-mail:
[email protected]
Anoop Verma e-mail:
[email protected] Department of Mechanical and Industrial Engineering, University of Iowa, 3131 Seamans Center, Iowa City, IA 52242-1527
Prediction of Status Patterns of Wind Turbines: A Data-Mining Approach This paper presents the application of data-mining techniques for identification and prediction of status patterns in wind turbines. Early prediction of status patterns benefits turbine maintenance by indicating the deterioration of components. An association rule mining algorithm is used to identify frequent status patterns of turbine components and systems that are in turn predicted using historical wind turbine data. The status patterns are predicted at six time periods spaced at 10 min intervals. The prediction models are generated by five data-mining algorithms. The random forest algorithm has produced the best prediction results. The prediction results are used to develop a component performance monitoring scheme. 关DOI: 10.1115/1.4003188兴 Keywords: wind turbine, status pattern, data mining, fault prediction, association rule mining, faults, component failure
1
Introduction
The developments in wind energy have materialized in the form of large-scale wind farms, wind energy cooperatives, wind turbines owned by individual investors, and multinational exploration of remote sites and offshore locations. Despite the increasing rated capacity of wind turbines, operations and maintenance 共O&M兲 costs remain high due to failures of wind turbine components such as gearboxes and blades. To remain competitive, the O&M costs of wind turbines need to be reduced 关1–5兴. The maintenance cost is largely determined by the number and severity of faults. Therefore, the early prediction of faults, leading to their reduction in severity and quantity, is of interest to the wind industry. Some faults may rarely occur, yet the adverse impact on the operational status of the system may be significant 关6,7兴. As certain faults are relatively rare, the imbalance between the fault and normal turbine state data makes the prediction task difficult. One way to mitigate this data imbalance is by merging data sets across various turbines or systems 关8兴. Data-mining algorithms have been successfully used to identify useful models based on data in domains such as semiconductor manufacturing 关9,10兴, prognosis and diagnosis 关11兴, and information retrieval 关12兴. Applications of data-mining algorithms in renewable energy have been reported in the literature, e.g., wind power forecasting 关13–16兴 and vibration monitoring of blades 关17兴. The models used for fault diagnosis of wind turbines can be broadly categorized into two classes: reliability-based models 关18–24兴 and condition monitoring 关2,25–35兴. The reliability-based models determine the performance of the turbine components for different operating conditions, whereas condition monitoring techniques analyze the operating behavior of the equipment and generate early warnings before the system or individual component fails. Autonomous online monitoring systems coupled with integrated fault detection algorithms can detect emerging faults and, therefore, they may prevent major failures from happening. Effective identification of faulty conditions requires condition monitoring systems that can be costly and not necessarily effective. The cost effective option of condition monitoring is to use data-mining Contributed by the Solar Energy Division of ASME for publication in the JOURSOLAR ENERGY ENGINEERING. Manuscript received February 14, 2010; final manuscript received November 10, 2010; published online January 28, 2011. Assoc. Editor: Spyros Voutsinas.
NAL OF
Journal of Solar Energy Engineering
algorithms to identify fault patterns. In the past, data-mining algorithms have been used to monitor equipment performance in domains such as power systems 关36,37兴, automotive industry 关38,39兴, and defense applications 关40兴. The research reported in this paper utilizes data-mining algorithms to predict status patterns of a wind turbine. The background of the problem studied in this research is presented in Sec. 2. A framework for the identification and prediction of the status patterns is described in Sec. 3. The analysis results are presented in Sec. 4. Section 5 concludes the research and presents the future research directions.
2
Problem Background and Dataset Description
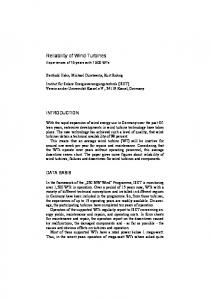
2.1 Data Set Description. The data used in this research was collected from the supervisory control and data acquisition 共SCADA兲 system of a wind farm. A typical SCADA system records data on more than 100 parameters averaged over 10 min intervals 共10 min data兲. The data used in this research consist of two different data sets, e.g., operational data and status data. The operational data include 10 min data of parameters such as power, wind speed, rotor speed, and generator speed recorded. The status data include the status codes, status description, wind speed, and power and are recorded at the time the system undergoes a status change. In total, 12 months of status data and 4 months of operational data are used for this research. 2.2 Background. A wind turbine includes assemblies, systems, and components that may fail. A component failure usually develops in stages over a period of time 共see Fig. 1兲. Changes in the values of turbine parameters are reported as status codes. For a typical large-scale turbine, over 400 different status codes can be generated. A status indicates a potentially emerging fault. The factors contributing to a fault can be internal 共e.g., operational parameters, temperature, and vibrations兲 and external 共e.g., extreme weather conditions兲. Depending on the severity of the problem, a status code may trigger three types of alarms: information, warning, and failure. The status code data are grouped in four categories, categories 1–4, with category 1 being the most severe one. Examples of status codes are provided in Fig. 2. A category 4 status usually represents an inconsequential event during the normal operations of a wind turbine 共Fig. 2兲. In the analysis performed in this paper, status codes corresponding to categories 1–3 are considered.
Copyright © 2011 by ASME
FEBRUARY 2011, Vol. 133 / 011008-1
Downloaded 28 Jan 2011 to 128.255.19.134. Redistribution subject to ASME license or copyright; see http://www.asme.org/terms/Terms_Use.cfm
Table 1 Distribution statistic of all category statuses Status category
Distribution
No. of data points
1 2 3 4
Poisson 共 = 10.98兲 Poisson 共 = 31.61兲 Poisson 共 = 4.77兲 Poisson 共 = 40.48兲
100 100 100 100
Fig. 1 Component degradation curve
3 In this research, the status data from 100 wind turbines has been analyzed. Figure 3共a兲 provides four discrete distribution functions, e.g., negative binomial, geometric, logarithmic, and the Poisson of category 1 status data. The probability-probability plot in Fig. 3共b兲 indicates that the category 1 status closely follows the Poisson distribution. The distribution statistics of all four statuses is summarized in Table 1. The status frequency varies for each status category, with category 4 being the most frequent and category 1 status being the least frequent. Accurate prediction of patterns involving category 1 statuses is most desirable. In general, individual statuses do not provide much information regarding the system/component health; rather, the sequence of the statuses 共called here a status pattern兲 occurring over time may lead to the component failure. Thus, early prediction of status patterns is needed for effective condition monitoring and maintenance.
Solution Approach
This section presents a new approach to fault prediction 共see Fig. 4兲. The status data from 100 turbines are used to identify frequent status patterns, whereas the data obtained from the 10 representative turbines are merged with the SCADA operational data to generate a data set for the prediction of status patterns. The details of the framework of Fig. 4 are presented next. 3.1 Frequency Analysis. The aim of this step is to identify status patterns using data from 100 wind turbines. To accomplish this task, only fault informative statuses 共e.g., categories 1–3兲 are considered. The status data of 100 turbines are analyzed to determine patterns consisting of two of more statuses 共see Fig. 5兲. The limit on the time delay 共⌬兲 is set to 60 s, e.g., the statuses recorded within 60 s are considered as a possible status pattern. In total, 16 frequent status patterns have been identified 共see Fig. 6兲. The identified status patterns along with their distribution statistics are summarized in Table 2. Among the identified status patterns, the rotor and turbine blade based status patterns are the most frequent. The histogram of all 100 turbines corresponding to the status patterns is shown in Fig. 7. Status patterns closely follow a negative binomial distribution 共n = 2 , p = 0.02018兲. Ten most fault affected turbines, e.g., 05, 17, 22, 25, 46, 64, 70, 73, and 84, and 87, were considered for mining with association rule algorithms and fault prediction. 3.2 Association Rule Mining. Association rule mining 共ARM兲 is used to determine interesting relations among parameters in a large data set 关41兴. ARM has been used in web usage mining 关42兴, intrusion detection 关43兴, and bioinformatics 关44兴. In this paper, frequent patterns are determined with the apriori algorithm 关41,45兴. The following metrics are used by the apriori algorithm to determine the goodness of a rule 共e.g., status pattern兲. supporti =
FPi TFP
共1兲
Fig. 2 Example status descriptions of four categories
Fig. 3 Category 1 status data for 100 turbines: „a… histogram and five probability density functions and „b… probability-probability „P-P… plot
011008-2 / Vol. 133, FEBRUARY 2011
Transactions of the ASME
Downloaded 28 Jan 2011 to 128.255.19.134. Redistribution subject to ASME license or copyright; see http://www.asme.org/terms/Terms_Use.cfm
3.4 Data Preprocessing. The data collected from a wind farm contain some noise due to sensor errors and malfunctions. Inconsistent data, e.g., abnormal wind speed, is deleted. After filtering the raw data, the final data set for ten turbines over a period of 4 months 共e.g., from 1/1/2008 to 4/30/2008兲 was produced. The approach described in the previous steps is used to determine the frequent status patterns where status data are used. However, for an early prediction of status patterns, the status data are merged with the operational data 共recorded at 10 min intervals兲. The following decision variable is used to label the output of the prediction data set. ⌶i = Fig. 4 Framework for the prediction of status patterns
conf共A → B兲 =
support共A 艛 B兲 ⫻ 100 support共A兲
共2兲
In expression 共1兲, supporti is the support of the ith status pattern, FPi is the number of times the ith status pattern is found in a yearly status data, and TFP is the total number of status patterns found. Conf共A → B兲 in Eq. 共2兲 represents the confidence of the status pattern AB consisting of statuses A and B. The minimum support was set equal to 10 共which signify that a status pattern appearing less than 10 times in a year is discarded兲. The support value of 10 was selected as per the average frequency of the individual status patterns. Confidence was set equal to 80% 共signifies at least 80% of the time the statuses form a unique pattern兲. The association rule mining is performed on the data from ten selected turbines and the common and frequent status patterns are selected for prediction at different time stamps. 3.3 Identification of Frequent Status Patterns. The association rule mining algorithm is applied on the status data obtained from the ten most fault prone wind turbines. More than 25 different rules 共status patterns兲 were found for each turbine. The pitch thyristor, the pitch malfunction, and the blade pitch angle related status patterns were the most frequent patterns with the corresponding support greater than 100 at 100% confidence level. These status patterns are listed in Table 3 and are used for level 2 predictions discussed in Sec. 4.
Fig. 5 Flow chat for identification of status patterns
Journal of Solar Energy Engineering
再
status pattern normal
if
t o ⱕ t s ⱕ t + i o,
i 苸 兵10,20,30, . . . ,60其
otherwise 共3兲
冎
In Eq. 共3兲, i is the index of time stamps, ⌶ is a decision variable labeling output as status pattern in the prediction data set at time to, if the status pattern occurs 共ts兲 in between the to and next time stamp t + io, otherwise, the output label will be normal. The generation of the data set is illustrated in Fig. 8, where para 1, para 2,…, para n represent the input parameters such as wind speed, power, generator speed, and so on, which are obtained from operational data. Overall, six different data sets 共e.g., for six time stamps兲 are generated for prediction. Status patterns are rare compared with the normal operations of a wind turbine. Merging the data across ten wind turbine increases the number of status pattern instances; however, it also increases the number of normal cases, resulting in a highly imbalanced data set. Sampling techniques, such as cost sensitive classification, undersampling, and oversampling, are widely used in the literature to improve the prediction accuracy of imbalanced data sets. Cost sensitive classification assigns a penalty to the false prediction of a minority class in order to minimize misclassification errors 关46兴. In undersampling, only a subset of data from the majority class is selected for the analysis. Oversampling augments the size of the data set by generating duplicate samples of the minority class. Doe to the highly imbalanced data set, a combination of oversampling and undersampling techniques, namely, 共1兲 spread subsamples 共to reduce the size of normal instances兲 and synthetic minority over-sampling technique 共SMOTE兲 共to generate more status pattern instances兲, are used in this research. The SMOTEbased sampling technique resamples the data set by applying a synthetic oversampling technique to the minority class 共e.g., class status patterns in the present case兲 关47兴. First, a subsample of 3000 from majority class data set 共e.g., data set with output label normal兲 is extracted and then SMOTE is repeatedly applied to the monitory class data 共e.g., data with output label status pattern兲 until the number of instances satisfies the predefined limit. It was assumed that the ratio of 60:40 共normal:status pattern兲 will be sufficient for mining. Figure 9 illustrates the data sampling approach used in this paper. The same approach is used to sample the data set at all time stamps. 3.5 Parameter Selection. For accurate predictions, the dimensionality of the data set needs to be reduced as not all the parameters are significant for the prediction. The removal of the unnecessary parameters improves prediction accuracy of the model and at reduced computational cost. Knowledge of the process is helpful in the elimination of parameters that are not significant. The SCADA system usually records more than 100 parameters of a wind turbine. The recorded parameters can be grouped into three categories: 共1兲 system related data, 共2兲 control parameters, and 共3兲 performance parameters. System related data, e.g., turbine number and index, time offset, are turbine specific and, therefore, it can be excluded from building a prediction model. Control parameters represent the desired values, such as FEBRUARY 2011, Vol. 133 / 011008-3
Downloaded 28 Jan 2011 to 128.255.19.134. Redistribution subject to ASME license or copyright; see http://www.asme.org/terms/Terms_Use.cfm
Fig. 6 Frequency distribution of identified status patterns: Turbines „a… 1–20, „b… 21–40, „c… 41–60, „d… 60–80, and „e… 81–100
set points of blade 1–3, torque set values, etc., whereas the performance parameters indicate the performance of a wind turbine necessary for the prediction of status patterns. Usually the parameters directly collected by SCADA are used for status pattern predictions. In some cases they are transformed, e.g., absolute deviation might be used. They are referred to as derived parameters, 011008-4 / Vol. 133, FEBRUARY 2011
e.g., blade 1–3 deviations 共Fig. 10兲. Further reduction in the data dimensionality can be accomplished with data analysis. Algorithms such as the boosting tree algorithm 关48兴, the principal component analysis 共PCA兲 关49兴, and the wrapper approach integrated with the genetic or the best-first search algorithms 关10,50兴 are widely used for parameter selection. Transactions of the ASME
Downloaded 28 Jan 2011 to 128.255.19.134. Redistribution subject to ASME license or copyright; see http://www.asme.org/terms/Terms_Use.cfm
Table 2 Identified status patterns No.
Status pattern 共category兲
Description
Distribution
1 2 3 4 5 6
141共1兲, 142共2兲 45共2兲, 52共2兲 105共2兲, 113共2兲 63共1兲, 118共1兲 292共3兲, 296共3兲 106共2兲, 114共2兲
Neg. binomial 共n = 2 , p = 0.10072兲 Poisson 共 = 1.09兲 Geometric 共p = 0.139兲 Poisson 共 = 3.47兲 Geometric 共p = 0.118兲 Neg. binomial 共n = 4 , p = 0.442兲
7 8 9
343共2兲, 344共1兲 296共3兲, 285共3兲 122共2兲, 296共3兲
10
122共2兲, 285共3兲
11
274共1兲, 275共1兲, 276共1兲
12
223共2兲, 342共2兲, 343共2兲
13
212共1兲, 213共1兲, 214共1兲
14
141共2兲, 142共2兲, 208共2兲
15
106共2兲, 114共2兲, 141共2兲, 142共2兲
16
106共2兲, 114共2兲,141共2兲, 142共2兲, 208共2兲
Rotor CCU collective faults, line CCU collective faults Hydraulic pump time too high, gearbox oil pressure too low Rotor CCU fault voltage, line CCU fault voltage Safety chain, emergency stop nacelle /hub Malfunction cabinet heaters, malfunction diverter Rotor CCU fault current, line CCU fault current Blade angle not plausible axis 3, pitch malfunction 2 or 3 blades Malfunction diverter, timeout CAN communication to hub Collective fault pitch controller, malfunction of diverter Collective fault pitch controller, timeout CAN communication to hub Pitch thyristor 1 fault, pitch thyristor 2 fault, pitch thyristor 3 fault Blade angle not plausible axis 1, blade angle not plausible axis 2, blade angle not plausible axis 3 Battery voltage not OK axis 1, battery voltage not OK axis 2, battery voltage not OK axis 3 Rotor CCU collective faults, line CCU collective faults, no activity CAN-bus CCU Rotor CCU fault current, line CCU fault current, rotor CCU collective faults, line CCU collective faults Rotor CCU fault current, line CCU fault current, rotor CCU collective faults, line CCU collective faults, no activity CAN-bus CCU
Geometric 共p = 0.066兲 Poison 共 = 0.5兲 Poisson 共 = 1.23兲 Poisson 共 = 0.28兲 Geometric 共p = 0.0658兲 Geometric 共p = 0.067兲 Poisson 共 = 0.9兲 Poisson 共 = 1.46兲 Poisson 共 = 1.23兲 Poisson 共 = 1.23兲
Fig. 7 Frequency plot of all status patterns identified in 100 turbines Table 3 Frequent status patterns „support >100 and confidence= 100%… No.
Status pattern 共category兲
Description
1 2 3
343共2兲 = ⬎ 344共1兲 274共1兲 = ⬎ 275共1兲 = ⬎ 276共1兲 223共2兲 = ⬎ 342共2兲 = ⬎ 343共2兲
Blade angle not plausible axis 3 = ⬎ pitch malfunction 2 or 3 blades Pitch thyristor 1 fault= ⬎ pitch thyristor 2 fault= ⬎ pitch thyristor 3 fault Blade angle not plausible axis 1 = ⬎ blade angle not plausible axis 2 = ⬎ blade angle not plausible axis 3
PCA is an unsupervised learning approach for dimensionality reduction that uses correlation coefficients of the parameters to combine and transform them into a reduced dimensional space 关51兴. It employs a ranker-based search algorithm to select the principal components. In this research, PCA was applied on 15 parameters. Table 4 displays the correlation matrix for 15 parameters of the data set t + 30 共obtained after merging data from ten turbines兲 used also for algorithm selection. Table 5 presents the eigenvalues of the principal components. The parameters, T_GEN1, T_GEN2, and GEN_S, and ROT_S, are found to be highly correlated. The six principal components shown in Table 5 explain 96.11% of the total variance; therefore, they are selected to build the prediction model. The dimensionality of the data set is reduced from 15 to 6 dimensions. The same principal components are used to reduce the dimensionality of all time stamped data sets. 3.6
Metrics for Prediction Accuracy. The selection of pre-
Journal of Solar Energy Engineering
Fig. 8 Description of the data set generation
FEBRUARY 2011, Vol. 133 / 011008-5
Downloaded 28 Jan 2011 to 128.255.19.134. Redistribution subject to ASME license or copyright; see http://www.asme.org/terms/Terms_Use.cfm
Table 5 Eigenvalues of six principal components determined by the PCA Principal component PC1 PC2 PC3 PC4 PC5 PC6
Eigenvalue
Variance 共%兲
Cumulative variance 共%兲
8.2865 2.03399 1.5629 0.99603 0.89348 0.64344
55.24 13.56 10.42 6.64 5.96 4.29
55.24 68.80 79.22 85.86 91.82 96.11
TFP + TNP TFP + TFM + TNM + TNP
共4兲
senstivity =
TFP TFP + TFM
共5兲
specificity =
TNP TNM + TNP
共6兲
accuracy =
Fig. 9 Data sampling steps
diction algorithms is evaluated on a test data set. The metrics used in the analysis are based on the widely used confusion matrix illustrated in Fig. 11. The metrics used to evaluate accuracy of the prediction model are listed in Eqs. 共4兲–共7兲.
⌿=
共w1 ⫻ accuracy兲 + 共w1 ⫻ sensitivity兲 + 共w1 ⫻ specificity兲 w1 + w2 + w3 共7兲
The algorithm producing the best results based on the weighted prediction accuracy 共兲 defined in Eq. 共7兲 is used for further analysis, where w1, w2, and w3 are the weights associated with accuracy, sensitivity, and specificity, respectively. 3.7 Algorithm Selection. Five data-mining algorithms, bagging 关52兴, ripper 关53兴, rotation forest 关54兴, random forest 关55兴, and k-nearest neighbor 共k-NN, k = 10兲 关56兴, are used to construct the prediction model. Bagging is an ensemble meta-algorithm combining different classifiers. The ripper algorithm reduces classification errors by incremental pruning of an inductive rule algorithm to predict output classes. Rotation forest uses parameter selection to construct a classifier using a base learner and a projection filter. Random forest involves numerous decision trees and can be used for both classification and regression. The k-NN classifies objects based on the training examples in parameter space, whereby, objects are classified by the majority of votes from their neighbors. The performance of the five data-mining algorithms for the prediction of frequent status patterns was examined at t + 30 time stamps using the metrics 共4兲–共7兲. The best performing algorithm was used to build the prediction models at all six time stamps. Fig. 10 Parameters selected for prediction of status patterns Table 4 Correlation matrix of 15 parameters Parameter
ACT_P VWIN BL1DEV BL2DEV BL3DEV GEN_S ROT_S NAC_REV GEAR_S T_GEN1 T_GEN2 T_BEARA T_BEARB T_GEAR DT_ACC
ACT_P 1 0.72 VWIN 0.72 1 BL1DEV ⫺0.22 ⫺0.11 BL2DEV ⫺0.21 ⫺0.11 BL3DEV 0.06 0.02 GEN_S 0.86 0.54 ROT_S 0.86 0.54 NAC_REV 0.05 0.17 GEAR_S 0.86 0.54 T_GEN1 0.71 0.65 T_GEN2 0.71 0.65 T_BEARA 0.45 0.48 T_BEARB 0.58 0.54 T_GEAR 0.56 0.54 DT_ACC 0.81 0.74
⫺0.2 ⫺0.1 1 1 0.24 ⫺0.3 ⫺0.3 ⫺0.1 ⫺0.3 ⫺0.2 ⫺0.2 ⫺0.1 ⫺0.2 ⫺0.2 ⫺0.2
⫺0.21 ⫺0.11 1 1 0.24 ⫺0.27 ⫺0.27 ⫺0.11 ⫺0.27 ⫺0.15 ⫺0.15 ⫺0.11 ⫺0.17 ⫺0.2 ⫺0.22
0.06 0.02 0.24 0.24 1 0.05 0.05 0 0.05 0 0 ⫺0.1 ⫺0.1 0 ⫺0.1
011008-6 / Vol. 133, FEBRUARY 2011
0.9 0.5 ⫺0.3 ⫺0.3 0.1 1 1 0 1 0.7 0.7 0.5 0.6 0.7 0.7
0.86 0.54 ⫺0.28 ⫺0.27 0.05 1 1 0.04 1 0.71 0.71 0.5 0.64 0.66 0.71
0.05 0.17 ⫺0.1 ⫺0.1 0 0.04 0.04 1 0.04 0.15 0.15 0.16 0.15 0.1 0.07
0.86 0.54 ⫺0.3 ⫺0.3 0.05 1 1 0.04 1 0.71 0.71 0.5 0.64 0.66 0.71
0.71 0.65 ⫺0.16 ⫺0.15 ⫺0.03 0.71 0.71 0.15 0.71 1 1 0.87 0.96 0.89 0.63
0.71 0.65 ⫺0.16 ⫺0.15 ⫺0.03 0.71 0.71 0.15 0.71 1 1 0.87 0.96 0.89 0.63
0.45 0.48 ⫺0.1 ⫺0.1 ⫺0.1 0.5 0.5 0.16 0.5 0.87 0.87 1 0.93 0.89 0.43
0.58 0.54 ⫺0.19 ⫺0.17 ⫺0.06 0.64 0.64 0.15 0.64 0.96 0.96 0.93 1 0.92 0.5
0.56 0.54 ⫺0.21 ⫺0.2 ⫺0.01 0.66 0.66 0.1 0.66 0.89 0.89 0.89 0.92 1 0.5
0.81 0.74 ⫺0.2 ⫺0.2 ⫺0.1 0.71 0.71 0.07 0.71 0.63 0.63 0.43 0.5 0.5 1
Transactions of the ASME
Downloaded 28 Jan 2011 to 128.255.19.134. Redistribution subject to ASME license or copyright; see http://www.asme.org/terms/Terms_Use.cfm
Table 7 Accuracy of data-mining algorithms predicting all frequent status patterns at time stamp t + 30 Algorithm Bagging Random forest Ripper k-NN Rotation forest
Accuracy 共%兲
Sensitivity 共%兲
Specificity 共%兲
93.88 94.88 88.58 88.31 94.32
94.3 96.8 88.4 99.2 95.5
93.6 93.4 88.8 80.2 93.5
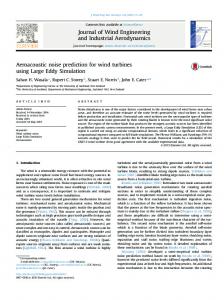
Figure 13 compares the prediction output obtained by the random forest algorithm at time stamp t + 30 with the actual output. The dense clusters along the normal-normal 共predicted-actual兲 and status pattern-status pattern 共predicted-actual兲 axis depict that both normal and status pattern instances are well classified, whereas the sparse clusters along the normal-status pattern 共predicted-actual兲 and the status pattern-normal 共predicted-actual兲 axis indicate few misclassified cases.
4 Fig. 11 The confusion matrix for performance evaluation of algorithms
Sampling of the large imbalanced data set resulted in 5326 instances 共see Table 6兲. Table 7 summarizes the prediction accuracy of the five data-mining algorithms. Different weight values w1, w2, and w3, in the range 共0–1兲, were assigned to accuracy, sensitivity, and specificity, respectively, to identify the best performing algorithm. The random forest algorithm outperformed the remaining data-mining algorithms 共see Fig. 12兲. The weights assigned to the evaluation metric display the preference toward a particular output class. The performance of the four algorithms namely Bagging, Random Forest, Rotation Forest, and RIPPER was found to be consistent for various weight values, however, RIPPER was less accurate, whereas the k-NN algorithm was found to be more sensitive to weight values. Therefore, the random forest algorithm is selected to build the prediction model at various time stamps.
Computational Results
In this section, various experiments are considered to analyze accuracy and robustness of the proposed approach. 4.1 Level 1 Prediction. Level 1 prediction corresponds to the prediction of all three frequent status patterns obtained with association rule algorithm 共see Table 3兲. The random forest algorithm is used to build the prediction model at six time stamps. A total of 6 predictive models were built, and the results obtained are shown in Table 8. The results indicate that the algorithm is consistent in accuracy and sensitivity at all time stamps. 4.2 Level 2 Prediction. Level 2 prediction corresponds to the prediction of the individual status patterns. Here, 18 prediction models were built with the random forest algorithm. Tables 9–11 summarize the prediction accuracy of the models built for different horizons. The prediction accuracy for the random forest algorithm is in the range 84.36–96.08% with accuracy of predicting status patterns in the range 85.4–96.4%. Figure 14 illustrates the comparison between actual output and predicted output of one such status pattern, e.g., 274= ⬎ 275= ⬎ 276, predicted at time
Table 6 Data set description for algorithm selection Data set t + 30_overall t + 30_training t + 30_test
Start time stamp
End time stamp
Description
1/1/2008 12:00 a.m. 1/1/2008 12:00 a.m. 3/21/2008 09:60 p.m.
4/30/2008 11:30 p.m. 3/21/2008 09:30 p.m. 4/30/2008 11:30 p.m.
5326 observations 3512 observations 1814 observations
Fig. 12 Prediction accuracy of five data-mining algorithms for different weight values
Journal of Solar Energy Engineering
FEBRUARY 2011, Vol. 133 / 011008-7
Downloaded 28 Jan 2011 to 128.255.19.134. Redistribution subject to ASME license or copyright; see http://www.asme.org/terms/Terms_Use.cfm
Table 10 Prediction accuracy of the status pattern 343= > 344 with the random forest algorithm Time stamp t + 10 t + 20 t + 30 t + 40 t + 50 t + 60
Accuracy 共%兲
Sensitivity 共%兲
Specificity 共%兲
86.1 86.2 85.2 85.4 85.5 84.6
88.2 89.8 90.1 86.1 88.6 85.4
84.2 83.3 81.0 85.0 82.8 84.1
Table 11 Prediction accuracy of the status pattern 223= > 342 = > 343 with the random forest algorithm Fig. 13 Comparison of the actual values and the values predicted by the random forest algorithm at time period t + 30 Table 8 Prediction accuracy of all status patterns with the random forest algorithm Time stamp t + 10 t + 20 t + 30 t + 40 t + 50 t + 60
Accuracy 共%兲
Sensitivity 共%兲
Specificity 共%兲
80.4 80.5 76.6 79.3 78.6 76.5
87.1 83.9 79.1 85.0 80.5 77.6
73.4 77.7 74.5 73.1 77.1 75.7
Time stamp t + 10 t + 20 t + 30 t + 40 t + 50 t + 60
Accuracy 共%兲
Sensitivity 共%兲
Specificity 共%兲
86.7 87.5 86.5 84.3 86.9 84.6
88.4 90.5 90.6 87.8 89.2 87.8
85.3 85.1 83.1 81.4 85.1 85.7
Table 9 Prediction accuracy of the status pattern 274= > 275 = > 276 with the random forest algorithm Time stamp t + 10 t + 20 t + 30 t + 40 t + 50 t + 60
Accuracy 共%兲
Sensitivity 共%兲
Specificity 共%兲
95.6 95.3 94.8 94.1 96.0 93.7
96.8 97.1 96.8 96.3 97.4 95.0
94.7 94.0 93.4 92.4 95.1 92.9
stamps t + 10 and t + 60. The relatively dense distributions of data points along the normal-normal 共actual-predicted兲 and the status pattern-status pattern 共actual-predicted兲 axis indicate that classification errors are much less.
Fig. 15 Distribution of alarm signals of the status pattern 274= > 275= > 276
4.3 Component Performance Monitoring. The monitoring scheme uses the predicted output to generate an alarm signal. At this time the alarm signal can be displayed up to 60 min ahead of the adverse event. A voting approach using the predicted output at all six time stamps is adopted to develop the performance monitoring system. Let be the frequency of prediction output status pattern at six time stamps and Єi be the possible output at time stamp i, 共i 苸 兵t + 10, t + 20, . . . , t + 60 min其兲. Є can be predicted as normal or status pattern depending on the input data. If ⬎ = 3 and Єi = Єi−1 = Єi−2 = status pattern, the monitoring system will gen-
Fig. 14 The actual and the predicted status pattern 274= > 275= > 276: „a… t + 10 and „b… t + 60
011008-8 / Vol. 133, FEBRUARY 2011
Transactions of the ASME
Downloaded 28 Jan 2011 to 128.255.19.134. Redistribution subject to ASME license or copyright; see http://www.asme.org/terms/Terms_Use.cfm
Table 12 Alarm signals for status pattern 274= > 275= > 276 of turbine 73 Date
Time
Time stamp
Prediction output
Alarm signal
Time interval considered
1/11/2008 1/11/2008 1/11/2008 1/11/2008 1/11/2008 1/11/2008 1/11/2008 1/11/2008 1/11/2008 1/11/2008
12:00:00 a.m. 12:10:00 a.m. 12:20:00 a.m. 12:30:00 a.m. 12:40:00 a.m. 12:50:00 a.m. 1:00:00 a.m. 3:30:00 a.m. 4:00:00 a.m. 4:30:00 a.m.
t − 30 t − 20 t − 10 ta t + 10 t + 20 t + 30 t + 40 t + 50 t + 60
Status pattern Status pattern Normal Normal Normal Normal Status pattern Status pattern Status pattern Status pattern
Warning Warning Warning Warning Warning Error
兵t − 40, t − 30, . . . , t + 10其 兵t − 30, t − 20, . . . , t + 20其 兵t − 20, t − 10, . . . , t + 30其 兵t − 10, t , . . . , t + 40其 兵t , t + 10, . . . , t + 50其 兵t + 10, t + 20, . . . , t + 60其
a
Time for displaying alarm signals.
erate any alarm signal as error. However, if 2 ⬍ = ⬍ = 3 and Єi = Єi-1 = status pattern, the alarm signal will be warning, and for 1 ⬍ = ⬍ = 2 the alarm signal will be information. Otherwise, if = 0, the alarm signal will be just a system update. Considering six time periods, there can be 64 共e.g., 26兲 possible prediction outcomes. It is important to mention that displaying alarm signals requires the prediction output at six consecutive time stamps. For displaying signals 60 min ahead, data-mining algorithm will be used to get output at all six time stamps, whereas for displaying alarm signals 50 min ahead or earlier, both past output information and data-mining algorithm based prediction will be used. 4.4 Experiments. Status patterns occurring at only one time stamp only appear to be as critical as their repeated sequence that might be an indication of a system or a component failure. In this section, analysis of the component monitoring approach is performed. 1000 共out of more than 2000兲 cases are selected to form three different data sets. The distribution of the alarm signals for an example status pattern 274= ⬎ 275= ⬎ 276 is shown in Fig. 15. Figure 15 indicates that alarm signals such as error and warning are more frequent than the system update or information signals in all three status patterns. Similar distribution was found for two other status patterns. Table 12 illustrates component monitoring scheme for status pattern 274= ⬎ 275= ⬎ 276 on turbine 73. The component monitoring scheme will use both past and future output values to generate alarm signal at time t. The monitoring system will use different colors codes for signaling abnormalities 共e.g., red for severe faults, orange for warning, and yellow for minor errors兲. It will also display information about the turbine component concerned along with the possible actions that might be needed by maintenance operators.
5
Conclusions and Future Research
A data-mining approach was applied to identify and predict status patterns of wind turbines. The identification of status patterns is important as the system or component may not fail instantly, yet its health may gradually deteriorate. An early prediction of status patterns allows for predictive maintenance actions and possible avoidance of some faults. A prediction model was built using operational and status data collected at wind turbines. An a priori algorithm identified frequent status patterns. The principal component analysis transformed the 15 dimension data sets into 6 dimension data sets. Of the five data-mining algorithms tested, the random forest algorithm was selected for building a prediction model. A component performance monitoring scheme was developed to generate alarm signals based upon the outputs predicted at different time intervals. Due to the current data sharing practices of the wind energy industry, only 4 month long data were available for testing. In the future, the proposed model will be tested on more extensive data sets. The impact of more frequent data on the prediction accuracy at longer time horizons will be also investigated. Journal of Solar Energy Engineering
Acknowledgment This research has been supported by the Iowa Energy Center, Grant No. 07-01.
References 关1兴 Nelson, D. B., Nehrir, M. H., and Wang, C., 2006, “Unit Sizing and Cost Analysis of Stand-Alone Hybrid Wind/PV/Fuel Cell Power Generation Systems,” Renewable Energy, 31共10兲, pp. 1641–1656. 关2兴 Walford, C. A., 2006, “Wind Turbine Reliability: Understanding and Minimizing Wind Turbine Operation and Maintenance Costs,” Sandia National Laboratory Report No. SAND2006-1100. 关3兴 Herbert, G. M. J., Iniyan, S., Sreevalsan, E., and Rajapandian, S., 2007, “A Review of Wind Energy Technologies,” Renewable Sustainable Energy Rev., 11共6兲, pp. 1117–1145. 关4兴 Kusiak, A., Li, W., and Song, Z., 2010, “Dynamic Control of Wind Turbines,” Renewable Energy, 35共2兲, pp. 456–463. 关5兴 Huyer, S. A., Simms, D., and Robinson, M. C., 1996, “Unsteady Aerodynamics Associated With a Horizontal-Axis Wind Turbine,” American Association for Artificial Intelligence Journal, 34共7兲, pp. 1410–1419. 关6兴 Narayanswamy, R., Metz, J. L., and Johnson, K. M., 1998, “Intelligent Data Elimination for a Rare Event Application,” Proc. SPIE, 3460, pp. 906–917. 关7兴 Tsumoto, S., 2003, “Chance Discovery in Medicine—Detection of Rare Risky Events in Chronic Diseases,” New Generation Computing, 21共2兲, pp. 135– 147. 关8兴 Kusiak, A., and Shah, S., 2006, “A Data-Mining-Based System for Prediction of Water Chemistry Faults,” IEEE Trans. Ind. Electron., 53共2兲, pp. 593–603. 关9兴 Kusiak, A., 2000, “Decomposition in Data Mining: An Industrial Case Study,” IEEE Trans. Electron. Packag. Manuf., 23共4兲, pp. 345–353. 关10兴 Tan, P. N., Steinbach, M., and Kumar, V., 2006, Introduction to Data Mining, Pearson Education/Addison Wesley, Boston, MA. 关11兴 Bae, H., Kim, S., Kim, Y., Lee, M. H., and Woo, K. B., 2003, “E-Prognosis and Diagnosis for Process Management Using Data Mining and Artificial Intelligence,” Proceedings of the Industrial Electronics Conference, Roanoke, VA, Vol. 3, pp. 2537–2542. 关12兴 Seo, H., Yang, J., and Choi, J., 2001, “Building Intelligent Systems for Mining Information Extraction Rules From Web Pages by Using Domain Knowledge,” Proceedings of the IEEE International Symposium on Industrial Electronics, Pusan, South Korea, Vol. 1, pp. 322–327. 关13兴 Landberg, L., 1999, “Short-Term Prediction of the Power Production From Wind Farms,” J. Wind. Eng. Ind. Aerodyn., 80共1–2兲, pp. 207–220. 关14兴 Mohandes, M. A., Reham, S., and Halawani, T. O., 1998, “A Neural Networks Approach for Wind Speed Prediction,” Renewable Energy, 13共3兲, pp. 345– 354. 关15兴 Lange, M., and Focken, U., 2006, Physical Approach to Short-Term Wind Power Prediction, Springer-Verlag, Berlin, Heidelberg, Germany. 关16兴 Barbounis, T. G., Theocharis, J. B., Alexiadis, M. C., and Dokopoulos, P. S., 2006, “Long-Term Wind Speed and Power Forecasting Using Local Recurrent Neural Network Models,” IEEE Trans. Energy Convers., 21共1兲, pp. 273–284. 关17兴 Cambell, P. R. J., and Adamson, K., 2003, “Identification of Blade Vibration Causes in Wind Turbine Generators,” The Fourth International Conference on Data Mining Including Building Applications for CRM and Competitive Intelligence, Rio de Janeiro, Brazil, Dec. 1–3, Vol. 29, pp. 149–158. 关18兴 Andrawus, J. A., Watson, J., Kishk, M., and Adam, A., 2006, “The Selection of a Suitable Maintenance Strategy for Wind Turbines,” Wind Eng., 30共6兲, pp. 471–486. 关19兴 Rademakers, L. W. M. M., Braam, H., Zaaijer, M. B., and Bussel, G. J. W. V., 2003, “Assessment and Optimization of Operation and Maintenance of Offshore Wind Turbines,” Proceedings of the European Wind Energy Conference, EWEA, Madrid, Spain, Jun. 16–19, pp. 1–5. 关20兴 Ribrant, J., 2005, “Reliability Performance and Maintenance—A Survey of Failures in Wind Power Systems,” MS thesis, KTH School of Electrical Engineering, Sweden. 关21兴 Milborrow, D. J., 2002, “Will Downward Trends in Wind Prices Continue?,”
FEBRUARY 2011, Vol. 133 / 011008-9
Downloaded 28 Jan 2011 to 128.255.19.134. Redistribution subject to ASME license or copyright; see http://www.asme.org/terms/Terms_Use.cfm
Windstats Newsletter, 15共3兲, pp. 1–3. 关22兴 Ding, Y., Byon, E., Park, C., Tang, J., Lu, Y., and Wang, X., 2007, “Dynamic Data-Driven Fault Diagnosis of Wind Turbine Systems,” Proceedings of the Seventh International Conference on Computational Science, Part I: ICCS, Vol. 4487, pp. 1197–1204. 关23兴 Tavner, P. J., Xiang, J., and Spinato, F., 2007, “Reliability Analysis for Wind Turbines,” Wind Energy, 10共1兲, pp. 1–18. 关24兴 Chen, H., 2000, “Generating System Reliability Optimization,” Ph.D. thesis, University of Saskatchewan, Saskatoon, Saskatchewan, Canada. 关25兴 Chandler, H., 2003, Wind Energy—The Facts, European Wind Energy Association, Brussels, Belgium. 关26兴 Wilkinson, M. R., and Tavner, P. J., 2005, “Extracting Condition Monitoring Information From a Wind Turbine Drive Train,” The 39th Universities Power Engineering Conference, Bristol. 关27兴 Xiang, D., Ran, L., Tavner, P. J., and Yang, S., 2006, “Control of a Doubly Fed Induction Generator in a Wind Turbine during Grid Fault Ride-Through,” IEEE Trans. Energy Convers., 21共3兲, pp. 652–662. 关28兴 Davies, A., 1998, Handbook of Condition Monitoring, Chapman & Hall, London. 关29兴 Hameed, Z., Hong, Y. S., Cho, Y. M., Ahn, S. H., and Song, C. K., 2009, “Condition Monitoring and Fault Detection of Wind Turbines and Related Algorithms: A Review,” Renewable Sustainable Energy Rev., 13共1兲, pp. 1–39. 关30兴 Rao, B. K. N., 1996, Handbook of Condition Monitoring, Elsevier, Oxford. 关31兴 Pedersen, K. O. H., and Havemann, H., 2000, “An Alternative Approach to Power Engineering,” Power Engineering Society Summer Meeting, IEEE, Vol. 4, pp. 2085–2090. 关32兴 Orsagh, R. F., Lee, H., Watson, M., Byington, C. S., and Powers, J., 2006, “Advanced Vibration Monitoring for Wind Turbine Health Management,” Impact Technologies, http://www.impact-tek.com 关33兴 Mobley, R. K., 2002, An Introduction to Predictive Maintenance, ButterworthHeinemann, New York. 关34兴 Caselitz, P., Giebhardt, J., and Mevenkamp, M., 1997, “Application of Condition Monitoring Systems in Wind Energy Convertors,” Proceedings of the EWEC, Dublin, pp. 1–4. 关35兴 Caselitz, P., Giebhardt, J., and Mevenkamp, M., 1996, “Development of a Fault Detection System for Wind Energy Convertors,” Proceedings of the EUWEC, Goteborg, pp. 1004–1007. 关36兴 McGrail, A. J., Gulski, E., Groot, E. R. S., Allan, D., Birthwhistle, D., and Blackburn, T. R., 2002, “Data Mining Techniques to Asses the Condition of High Voltage Electrical Plant,” CIGRE Paris WG15.11 Paper. 关37兴 Smit, J. J., 1998, “Decision Making Experience With Maintenance Diagnosis of High Voltage Equipment,” The 37th CIGRE Session, Paris, pp. 10–15. 关38兴 Jardine, K. S., Ralston, P., Reid, N., and Stafford, J., 1989, “Proportional Hazards Analysis of Diesel Engine Failure Data,” Qual. Reliab. Eng. Int, 5共3兲, pp. 207–216.
011008-10 / Vol. 133, FEBRUARY 2011
关39兴 Romanowski, C. J., and Nagi, R., 2001, “Analyzing Maintenance Data Using Data Mining Methods,” Data Mining for Design and Manufacturing: Methods and Applications, D. Braha, ed., Kluwer Academic, Dordrecht, pp. 235–254. 关40兴 Raheja, D., Llinas, J., Nagi, R., and Romanowski, C., 2006, “Data Fusion/Data Mining-Based Architecture for Condition-Based Maintenance,” Int. J. Prod. Res., 44共14兲, pp. 2869–2887. 关41兴 Agrawal, R., and Srikant, R., 1994, “Fast Algorithms for Mining Association Rules in Large Databases,” The 20th International Conference on Very Large Databases, Santiago, Chile, pp. 478–499. 关42兴 Cho, Y. H., Kim, J. K., and Kim, S. H., 2002, “A Personalized Recommender System Based on Web Usage Mining and Decision Tree Induction,” Expert Sys. Applic., 23共3兲, pp. 329–342. 关43兴 Luo, J., and Bridges, S. M., 2000, “Mining Fuzzy Association Rules and Fuzzy Frequency Episodes for Intrusion Detection,” Int. J. Intell. Syst., 15共1兲, pp. 1–36. 关44兴 Besemann, C., Denton, A., Yekkirala, A., Hutchison, R., and Anderson, M., 2004, “Differential Association Rule Mining for the Study of Protein-Protein Interaction Networks,” Proceedings of the Fourth Workshop on Data Mining in Bioinformatics at SIGKDD, pp. 72–80. 关45兴 Agrawal, R., Imielinski, T., and Swami, A. N., 1993, “Mining Association Rules Between Sets of Items in Large Databases,” SIGMOD, 22共2兲, pp. 207– 216. 关46兴 Margineantu, D., 2000, “On Class Probability Estimates and Cost-Sensitive Evaluation of Classifiers,” Workshop on Cost-Sensitive Learning at the 17th International Conference on Machine Learning. 关47兴 Chawla, N. V., Bowyer, K. W., Hall, L. O., and Kegelmeyer, W. P., 2002, “SMOTE: Synthetic Minority Over-Sampling Technique,” J. Artif. Intell. Res., 16, pp. 321–357. 关48兴 Smola, A. J., and Scholkopf, B., 2004, “A Tutorial on Support Vector Regression,” Stat. Comput., 14共3兲, pp. 199–222. 关49兴 Jollife, I. T., 1986, Principal Component Analysis, Springer-Verlag, New York. 关50兴 Espinosa, J., Vandewalle, J., and Wertz, V., 2005, Fuzzy Logic, Identification and Predictive Control, Springer-Verlag, London. 关51兴 Miranda, A. A., Borgne, Y. A. L., and Bontempi, G., 2008, “New Routes From Minimal Approximation Error to Principal Components,” Neural Processing Letters, Springer, 27共3兲, pp. 197–207. 关52兴 Breiman, L., 1996, “Bagging Predictors,” Mach. Learn., 24共2兲, pp. 123–140. 关53兴 Cohen, W., 1996, “Learning Trees and Rules With Set-Valued Features,” Proceedings of the 13th Artificial Intelligence Conference, pp. 1–8. 关54兴 Rodriguez, J. J., Kuncheva, L. I., and Alonso, C. J., 2006, “Rotation Forest: A New Classifier Ensemble Method,” IEEE Trans. Pattern Anal. Mach. Intell., 28共10兲, pp. 1619–1630. 关55兴 Breiman, L., 2001, “Random Forests,” Mach. Learn., 45共1兲, pp. 5–32. 关56兴 Aha, D., and Kibler, D., 1991, “Instance-Based Learning Algorithms,” Mach. Learn., 6共1兲, pp. 37–66.
Transactions of the ASME
Downloaded 28 Jan 2011 to 128.255.19.134. Redistribution subject to ASME license or copyright; see http://www.asme.org/terms/Terms_Use.cfm


![Cost of wind turbines [PDF]](https://m.moam.info/img/260x300/cost-of-wind-turbines-pdf_647d40d2098a9edb6d8b4576.jpg)