[ 33
Prediction of the Static Modulus of Elasticity Using Four non Destructive Testing Predicción del Módulo de Elasticidad Estático Usando Cuatro Pruebas no Destructivas Hugo Luis Chávez-García Universidad Michoacana de San Nicolás de Hidalgo
[email protected] Gral. Francisco J. Múgica s/n, Felicitas del Río, 58030 Morelia, Michoacán, México / +52 443 322 3500
Elia Mercedes Alonso-Guzmán Universidad Michoacana de San Nicolás de Hidalgo
[email protected] Wilfrido Martínez-Molina Universidad Michoacana de San Nicolás de Hidalgo y Universidad Autónoma de Querétaro
[email protected]
Mario Graff Universidad Michoacana de San Nicolás de Hidalgo
[email protected] J. C. Arteaga-Arcos Universidad Autónoma del Estado de México
[email protected] Código: 0208 Fecha de Recepción: 01.01.2014. Fecha de Aceptación: 01.04.2014.
Abstract The static modulus of elasticity (Es) is an important parameter in the analysis of hydraulic concrete structures, changes have been made to the regulation of construction; these changes require minimum values for the E s, so now, in addition to concrete compressive strength (f´c) also E s values should be ensured. A methodology to predict Es is proposed, specifically, the Es were modeled by testing: ultrasonic pulse velocity (UPV), electrical resistivity test (ERT), resonance frequency test (RFT), the Hammer Test Rebound (HTR) and f´c. In order to generate models multiple linear regression technique was used. Cylindrical specimens were prepared in two stages, in the first stage was simulated laboratory conditions in the second stage was simulated conditions of concrete made in situ. All cylinders were subjected to non-destructive and destructive tests at different ages. The research objective is to predict Es from the results of destructive tests (traditionally employed to obtain E s) and nondestructive testing. It was possible to obtain a model whose correlation coefficient indicates the good approximation in the generated predictions.
Keywords: Hydraulic Concrete; Static Modulus of Elasticity, Dynamic Modulus of Elasticity; Nondestructive Tests, Compressive Strength. Resumen El módulo estático de elasticidad (Es) es un parámetro importante en el análisis de las estructuras de concreto hidráulico, se han realizado cambios en la regulación de la construcción; estos cambios requieren valores mínimos de los E s, por lo que ahora, además de la resistencia a la compresión del concreto (f'c) también deben garantizarse valores de Es. Se propone una metodología para predecir Es, específicamente, los Es fueron modelados con las pruebas: velocidad de pulso ultrasónico (UPV), prueba de resistividad eléctrica (ERT), prueba de frecuencia de resonancia (RFT), prueba de rebote de martillo (HTR) y f'c. Se utilizó la técnica de regresión lineal múltiple para generar los modelos. Se elaboraron especímenes cilíndricos en dos etapas, la primera simulando condiciones de laboratorio y en la segunda simulando condiciones de concreto hecho en campo. Todos los cilindros se sometieron a pruebas no destructivas y destructivas a diferentes edades. El objetivo de la investigación es predecir Es con los resultados obtenidos de pruebas destructivas (empleadas tradicionalmente para obtener Es) y pruebas no destructivas. Fue posible obtener un modelo cuyo coeficiente de correlación indica la buena aproximación en las predicciones generadas. Palabras clave: Concreto hidráulico, Modulo de Elasticidad Estático, Modulo de Elasticidad Dinámico, Prueba no Destructivas, Resistencia a la compresión.
INTRODUCTION For an existing structure, it is also possible to estimate Es using the theoretical relationships between the ultrasonic pulse velocity and Es. Cores taken out from existing structures indicate that the prediction models proposed in building codes work out different results when compared against the experimentally obtained values (Akcay, 2004; Ozkul, Tasdemir, & Atahan, 1999). However, there are various non-destructive techniques for determining certain mechanical properties of hydraulic concrete, such as the dynamic modulus of elasticity (Ed) and aspects that indicate the durability of concrete e.g., the durability factor (with or without additions). Furthermore, these methods are able to detect, localize and characterize damages 2014, 13(1), 33 - 40
[
as cracks (their width and depth); recommendations regarding the combination of non-destructive tests for real structures assessment are reported somewhere else (ASTM C 666, 2003; Ozerkan & Yaman, 2013; Zheng, Sharon, & Yuan, 2008; Goueygou, Abraham, & Lataste, 2008; Aggelis, Kordatos, D.V., & Matikas, 2010; A.M.T. & S.W., 2012; Giner, Ivorra, Baeza, Zornoza, & Ferrer, 2011; Aggelis, Leonidou, & Matikas, 2012). The non-destructive tests (NDTs) are based on the measurement of material properties, and in the case of ultrasonic methods they seek to establish relationships between the different parameters of the constants of propagation and the existence of possible defects in a material (Aggelis, Kordatos, Strantza, Soulioti, & Matikas, 2011). The properties measured are of different kinds and their range from the echogenicity (ability to produce echoes) to form images to determine elastic constants, sometimes by studying of complex
Chavez, L. – Alonso, E. – Martínez, W. – Graff, M. – Artega, J.
]
Revista de la Construcción Journal of Construction
[ 34 propagation modes (Toutanji, 2000). However, to study the mechanical properties of hydraulic concrete by using the nondestructive techniques, it has been tried to employ two or more parameters in order to improve the accuracy of the estimation of concrete strength (Mohammad, 2012), some even suggest the prediction of the concrete strength on base of data of weight and pulse velocity of the specimens using multiple regression and artificial neural networks (Kewalramani & Gupta, 2005).
the mechanical properties of concrete and rocks, e.g., Chaki et al (Chaki, Takarli, & Agbodjan, 2008) found a linear correlation between spectra amplitude of UPV signals and the amount of heat-induced damage to granites; meanwhile Wu & Lin, and Selleck et al (Wu & T.F., 1998; Selleck, Landis, Peterson, Shah, & Achenbach, 1998) investigated the behavior of UPV associated with the damage of concrete, the results showed that the wave velocity of mortar specimens at the stress-free state decreases with the decreasing of w/c ratios.
On other hand, dynamic techniques used for measuring modulus of concrete specimens have not been used widely because of perceived differences between modulus measured statically and dynamically. As the accuracy of the static measurements improves, the perceived difference continues to decrease. Furthermore, the perceived difference between static and dynamic modulus is becoming smaller due to the improvement of accuracy in the static measurement, and static modulus can be converted from the dynamic modulus using developed correlation (Kwang-Myong, Dong-Soo, & Jee-Sang, 1997; Tatsuoka & Shibuya, 1992; Kim & Stokoe II, 1994). The differences between dynamic and static modulus can be explained by the differences in strain levels used in testing, as well as a loading rate effect. The modulus measured dynamically was found to be about 10% greater than the value measured in the conventional static test which is based on stress and strain at 40% of the failure stress (Kwang-Myong, Dong-Soo, & Jee-Sang, 1997).
The Schmidt Hammer Rebound test (HTR) is performed through the device called sclerometer; the test is based on the principle that the compressive strength of an elastic mass depends on the hardness of the surface against which sclerometer hits; there is a relationship of proportionality between the f´c and the number of rebound of the hammer.
But it is not an easy task to determine the mechanical characteristics of the materials using only NDTs. This problem is more evident because, generally, the models are obtained within laboratory settings and under strict controlled conditions, in addition the materials may be affected by contaminants in the air and that can affect its mechanical properties (Alonso, 2007). As a consequence, it is necessary to evaluate the applicability of these models in uncontrolled environments and using different conditions from those used in the construction of the model (Beutel, et al., 2007). The Ed of concrete can be determined nondestructively using Resonance Frequency Tests (RFT) as prescribed in ASTM C215 (ASTM C 215-02, 2003). Such tests are based on measuring the fundamental transverse, longitudinal, and torsional frequencies of concrete specimens. It is generally perceived that the dynamic modulus will be considerably higher than the static modulus of elasticity. This is because the dynamic modulus is approximately equal to the initial tangent modulus while the static modulus is equal to the cord modulus (Mindess & Young, 1981). This can be also attributed to the presence of applied stress in determining the Es, which results in micro cracking and creep in concrete (Neville, 1998). Liu et al (Liu, Du, & Han, 2008) conducted a study in soilcement, used to improve the behavior of soft soils in road construction engineering; they built a model to verify the quality control of soil-cement in the field. The model predicted the Electrical Resistivity (ER) of soil-cement, under certain conditions of curing time and the Water/Cement ratio (w/c); it was found that the ER and the values of the compressive strength (f’c) of the material in study are closely correlated. Numerous investigations have been conducted in order to use the Ultra Sound Pulse Velocity technique(UPV) for predicting 2014, 13(1), 33 - 40
[
Table 1.-Nondestructive and destructive testing applied to the specimens. Source: Self Elaboration.
Specimen STAGE I Type I
Type II
STAGE II Type I Type II
w/c ratio
NDTs ERT
UPV
RNT
RFT
DT f´c
Es
0.55 0.57 0.61 0.76 0.55 0.57 0.61 0.76
X X X X X X X X
X X X X X X X X
X X X X X X X X
X X X X X X X X
X X X X X X X X
X X X X X X X X
0.50 0.65 0.50 0.65
X X X X
X X X X
X X X X
X X X X
X X X X
The method of using the hammer is explained below. With the hammer pushed hard against the concrete, the body is allowed to move away from the concrete until the latch connects the hammer mass to the plunger. The plunger is then held perpendicular to the concrete surface and the body pushed towards the concrete. This movement extends the spring holding the mass to the body. When the maximum extension of the spring is reached, the latch releases and the mass is pulled towards the surface by the spring. The mass hits the shoulder of the plunger rod and rebounds because the rod is pushed hard against the concrete. During rebound the slide indicator travels with the hammer mass and stops at the maximum distance the mass reaches after rebounding. A button on the side of the body is pushed to lock the plunger into the retracted position and the rebound number is read from a scale on the body (Malhotra V. M. and Carino N. J, 2004). Within certain limits, it has been established empirical correlations between the properties of the strength of concrete and the HTR (Malhotra, 1976). The HTR provides information about the strength of the material near the surface where the test is performed; the rebound number (RN) is an indicator of the mechanical properties of the material. In spite of a high number of rebound represents a concrete with a higher compressive strength than a concrete with a low rebound, the test is only useful if it can be established a relationship between
Chavez, L. – Alonso, E. – Martínez, W. – Graff, M. – Artega, J.
]
Revista de la Construcción Journal of Construction
[ 35 the rebound number and the analyzed resistance of the concrete, assuming that concrete samples have been made with the same type of stone aggregates (IAEA, 2002). One particular characteristic of the majority of the NDTs is that they can be conducted at the work-place and can be used to determine certain properties of already built structures. This process is known as: in-place testing (Stephen & Chair, 2003). When these tests first appear, it was common to predict the concrete strength using only one of the above tests; however, as found by many researchers (Qindan, Paolo, & Stefan, 2011; Samarin & Meynink, 1981; Miretti, Carrasco, Grether, & Passerino, 2004; Hola & Schabowicz, 2005), the combination of a number of NDTs can lead to more accurate and reliable models. In order to approximate the estimations of indicators (response variables), e.g., Ploix et al (Ploix, Garnier, Breysse, & Moysan, 2011) performed a combination or fusion of NDTs data as radar test, electrical resistivity and electrical capacity, infrared thermography, impact echo and ultrasounds to predict the simultaneous estimation of water saturation and porosity rate in concrete, for undamaged concretes measured in laboratory conditions; they measured different NDTs parameters, such as frequencies, velocities, attenuations, etc., that conducted to an statistical analysis with the purpose of identify empirical correlations linking each experimental parameter to both searched indicators; water saturation and porosity rate. There were identified correlations based on bilinear regressions, as a first approach, but since some different NDTs measurements are extremely sensitive to material heterogeneity, variability and experimental noise, relative disagreement or conflict between sources of information (i.e. measurements) can happen, and the prediction models can rapidly become ill-conditioned; therefore it was decided to combine several (at least three) NDTs techniques providing more suitable information. Kaftandjian et al (Kaftandjian, Min, Dupuis, & D., 2005) utilized a data fusion approach to improving weld inspection by NDTs, combining the use of evidence theory and fuzzy logic; in their framework, X-ray and ultrasonic inspection were modeled in order to generate 3D images from both NDTs, for evaluating defect detection and defect sizing of welded joints for industrial purposes, showing that the fusion of data significantly enhances the reliability of the defect detection. Maierhofer et al (Maierhofer, Zacher, Khol, & Wöstmann, 2008) used radar, ultrasonic, impact-echo and thermography data fusion for predicting deterioration of concrete vehicular bridges, it was established that the data fusion technique increases the reliability, and improved the accuracy of the quantitative results, exploiting the different and sometimes complementary physical effects provided by different NDTs. Lui et al (Liu, Forsyth, & Komorowski, 2007) provide a very wide state-of-the-art regarding NDTs data fusion techniques, they established that the usage of multiple NDTs methods is employed in order to increase the reliability and reduce the uncertainty of testing and evaluation. Nonetheless, there are cases in which the use of all available tests creates a model that only works in the samples used to instantiate it, i.e., the model does not generalize. In order to deal with this problem, it is necessary an automatic method of variable selection (here variables are the NDTs) to establish a simple model that achieves the prediction/explanation of the response variable, together with an efficient estimation of the coefficients. In this investigation, it was decided to use as a variable selection algorithm the Least Angle Regression (LARS) 2014, 13(1), 33 - 40
[
(Efron, 2004). LARS is a new algorithm that is useful and less greedy version of the traditional forward selection methods (Bradley, Trevor, Iain, & Robert, 2003). In this study, some models to predict the Es of hydraulic concrete were constructed based on readings of ER, UPV, RFT, HTR and f’c, obtained in cylindrical specimens. Two conditions of hydraulic concrete mixtures were created (field and laboratory) to predict the value of the Es, based on data from ERT, UPV, RFT and HTR, obtained from cylindrical specimens. Additionally these four techniques of NDTs were used to generate highly reliable solid models, as demonstrated herein. The information retrieved from LARS methodology can be used in order to understand the importance of each of the different variables involved in the determination of Es.
EXPERIMENTAL STUDY As aforementioned, this research was conducted in two stages: the first was to control the workability of concrete (concrete made in situ), and the second was to control water/cement (w/c), (concrete made in laboratory). Before the preparation of the specimens the quality tests required for stony aggregates were conducted (ASTM C 33 – 03, 2003; ASTM C 136 – 04, 2004). The mixing was performed in a concrete mixer leaving an excess of 10%. The concrete was mixed for 10 minutes after all ingredients have been loaded, capped mouth of the mixer with a damp cloth during the slump test to prevent evaporation. The investigation was done in two stages as mentioned above, in the first stage the concrete’s workability was the parameter controlled and the concrete was considered as made on the field. In the second stage, water/cement ratio (w/c) was the controlled parameter; two series of samples with w/c = 0.5 and 0.65 were developed. For the field-made concrete two types of samples were developed; 70 cylinders with dimensions of 3.94 in (100 mm) diameter and 7.87 in (200 mm) height (type I), and 70 cylinders with dimensions of 5.90 in (150 mm) diameter and 11.81 in (300 mm) height (type II). The w/c ratio varied from 0.55 to 0.76, these samples will be further referred as concrete made in situ. In the second stage, a strict quality control was achieved in order to elaborate concrete made into the laboratory, it was developed other two types of specimens with the same dimensions that in the first stage fabricated with different w/c ratios: type I, 70 cylinders, type II, 70 cylinders. One half of each specimens type were made with w/c = 0.65 and the rest with w/c = 0.50 ratios. These samples were denoted as concrete made in laboratory. All samples were prepared per ASTM requirements (ASTM C 143/C 143M – 03, 2003). Afterwards, according to the specified age of curing, the specimens were extracted from the pile of curing, covered with a damp cloth to prevent loss of moisture in order to conduct the NDTs on each specimen, and finally the Destructive Test (DTs); Table 1 shows the collected data from such kind of test. Five cylinders of each type were tested at the required ages of testing from the concrete made in situ batch; in the other hand, only tree cylinders of each type were tested at each age of testing from the concrete made in laboratory batch. Several models to predict the static Modulus of Elasticity under certain
Chavez, L. – Alonso, E. – Martínez, W. – Graff, M. – Artega, J.
]
Revista de la Construcción Journal of Construction
[ 36
Figure 1. Electrical resistivity vs age of the cylinders type I of the first stage with ratio w/c = 0.57 and 0.76, for ages from 3 days to 28 days. Source: Self Elaboration.
RESISTIVITY VS AGE 80
Resistivity. (Ohm-m)
70 60 50 40
Figure 3. Resonance frequency in the longitudinal mode vs age in cylinders a) type I of the first stage, with ratio w/c = 0.55 and 0.61, b) type II of the second stage with ratio w/c = 0.50, for ages from 3 days to 28 days. Source: Self Elaboration.
RESONANT FREQUENCY VS AGE CYLYNDERS TYPE I
3400
Resonant frequency (Hz)
kind of conditions were calculated using the information provided by both NDTs and DTs.
2900 2400 1900 1400 900 0
30
15
20
25
0.55, 0.61 - 3d 0.55, 0.61 - 14d 0.55, 0.61 - 28d
Age (days)
30
0.55, 0.61 - 7d 0.55, 0.61 - 21d
10 5
10
Age (days)
15
20
25
RESONANT FREQUENCY VS AGE CYLYNDERS TYPE II
0.57, 0.76 - 3d 0.57, 0.76 - 14d 0.57, 0.76 - 28d
30
3400
0.57, 0.76 - 7d 0.57, 0.76 - 21d
Figure 2. Compressive strength vs. electrical resistivity of cylinders type I, a) with ratio w/c = 0.50, for ages from 3 days to 28 days b) with ratio w/c = 0.65, for ages from 3 days to 28 days. Source: Self Elaboration.
COMPRESSIVE STRENGTH VS RESISTIVITY
40 35
Resonant frequency (Hz)
0
2900
2400
1900
1400
900 0
5
10
15
20
25
0.5- 14d
0.5- 21d
30
30 0.5- 3d
Age (days)
25
0.5- 14d
0.5- 28d
20
COMPRESSIVE STRENGTH VS ULTRASONIC PULSE VELOCITY
15 10
40
5
35
0 0
20
40
Resistivity (Ohm-m)
60
0.5 - 3d 0.5 - 21d
0.5 - 7d 0.5 - 28d
80 0.5 - 14d
COMPRESSIVE STRENGTH VS RESISTIVITY
40 35 30
Compressive strength (MPa)
Compressive strength (MPa)
10
20
0
Compressive strength (MPa)
5
30 25 20 15 10 5 0 3,4
3,6
VPU (km/seg)
25
3,8
0.57, 0.76 - 3d 0.57, 0.76 - 14d 0.57, 0.76 - 28d
4
4,2
0.57, 0.76 - 7d 0.57, 0.76 - 21d
20 15 10 5 0 0
10
20
Resistivity (Ohm-m)
2014, 13(1), 33 - 40
30
40
50
0.65 - 3d 0.65 - 21d
[
60 0.65 - 7d 0.65 - 28d
70
80
0.65 - 14d
Chavez, L. – Alonso, E. – Martínez, W. – Graff, M. – Artega, J.
]
Revista de la Construcción Journal of Construction
[ 37
Figure 1 shows typical results obtained from the electrical resistivity as a function of the age of the type I cylinders from the first stage. The electrical properties are closely related to the water cement ratio of hydraulic concrete, electrical resistivity increases with increasing age of the concrete; because of the cement hydration increase with time reduces the porosity of concrete. In these specimens there is a dispersion in the readings taken; this is because of the W/C ratio was not controlled in the mixtures of the first stage. Figure 2 shows typical results of compressive strength against the electrical resistivity of the type I cylinders from the second stage of research; it can be observed that the dispersion showed in their counterparts from stage one is not presented in this batch probably due to all these mixtures were prepared with strict quality control. Concrete made with W/C = 0.5 presented less porosity and greater compressive strength at early ages up to 28 days. The results of fundamental resonance frequency obtained in the cylinders presented dispersion in the mixtures of both stages, no trends were identified for this NDT, Figure 3 shows typical results of resonance frequency of cylinder type I of the first stage and cylinders type II of the second stage. Figure 4 shows the results of compressive strength vs ultrasonic pulse velocity in cylinders type I and type II of the two stages. Figure 4a describes a trend that indicates the increase of ultrasonic pulse velocity and the compressive strength with the increase of the age; however, the higher readings were taken at ages 14 or 21 days than those obtained at 28 days, this could be due to the variations in the W/C which the samples were prepared. Figure 4b shows an increase of the pulse velocity and the compressive strength as a function of the increase of the age; there is a small dispersion due to the quality control and the low W/C ratio. For all the studied samples higher readings were obtained at higher curing ages.
COMPRESSIVE STRENGTH VS ULTRASONIC PULSE VELOCITY 40
35
Compressive strength (MPa)
EXPERIMENTAL RESULTS AND DISCUSSION
Figure 4. Compressive strength vs. ultrasonic pulse velocity of cylinders type I of two stage, a) with ratio w/c = 0.57 and 0.76, b) with ratio w/c= 0.50 and 0.65, for ages from 3 days to 28 days. Source: Self Elaboration.
30 25 20 15 10 5 0 3,4
3,6
[
4 0.5 - 7d 0.65-3d 0.65-28d
4,2
0.5 - 14d 0.65-7d
0.5 - 21d 0.65-14d
STATIC MODULUS OF ELASTICITY VS. DYNAMIC
40000 35000 30000
25000 20000
15000 10000 5000 0 0 0.50-3d 0.65-3d
10000
20000
Ed (MPa)
0.50-7d 0.65-7d
0.50-14d 0.65-14d
30000 0.50-21d 0.65-21d
0.50-28d 0.65-28d
STATIC MODULUS OF ELASTICITY VS. DYNAMIC
40000 35000 30000 25000 20000 15000 10000 5000
0 0 0.50-3d 0.65-3d
2014, 13(1), 33 - 40
3,8 0.5 - 3d 0.5 - 28d 0.65-21d
VPU (km/seg)
Figure 5. Static Modulus of Elasticity vs. Dynamic obtained from the ultrasonic pulse velocity in cylinders of the second stage with ratio w/c = 0.50 and 0.65, a) type I, b) type II, from 3 to 28 days of age. Source: Self Elaboration.
Es (MPa)
The design of concrete was performed according to procedure established by the ACI (ACI 318, 2005). Commercial available Mexican cement denomination CPC 30R RS was used for the experimentation; the mixes were designed in order to obtain a concrete f'c = 24.52MPa (3.56Ksi) and f'c = 16.67 MPa (2.42Ksi). The stony aggregates were volcanic type from a local bank placed on the outskirts of the Morelia city.
From non-destructive testing, it is possible to determine a dynamic modulus of elasticity and compare it with the static modulus, however, due to that the resonance frequency results did not show tendency, therefore the dynamic modulus of elasticity obtained from the resonance frequency does not tend, however, because the ultrasonic pulse velocity has a upward trend with respect to time, the dynamic modulus of elasticity obtained from this velocity shows correlation with static modulus of elasticity.
Es (MPa)
The f’c and Es values of the hydraulic concrete cylinders were calculated in accordance with ASTM (ASTM C 39/C 39M – 03, 2003; ASTM C 469 - 02, 2002); all the test specimens were performed under dry superficially saturated conditions; it is worth emphasizing at this point that for in-situ structures it is needed the utilization of special equipment for locating the presence of the reinforcing steel in order to perform the readings of NDTs on sites away from steel rebars to avoid possible errors due to the presence of materials different than concrete (Millard, Harrison, & Edwards, 1989; Red Durar, 1998). The tests were performed by means of a Forney universal testing machine with a capacity of 1471 KN and 0.10 KN of approximation.
10000
Chavez, L. – Alonso, E. – Martínez, W. – Graff, M. – Artega, J.
20000
Ed (MPa)
0.50-7d 0.65-7d
0.50-14d 0.65-14d
]
30000 0.50-21d 0.65-21d
0.50-28d 0.65-28d
Revista de la Construcción Journal of Construction
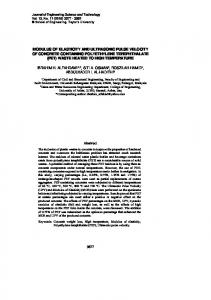
[ 38 Figure 5 shows the dynamic modulus of elasticity obtained from ultrasonic pulse velocity vs. the static modulus obtained from cylinders type I and II of the second stage, there is no dispersion and a growing trend is observed. Table 2. Summarizes the models developed to predict the Static Modulus of Elasticity from the non-destructive tests data studied in this work. This table shows the correlation factor and the average error for each model. The model E2 is the one with the highest correlation factor, therefore it could be considered as the one most suitable for predicting the static modulus of elasticity; this model includes the following variables: concrete compressive strength, electrical resistivity, ultrasonic pulse velocity, frequency of resonance, the dynamic modulus calculated from ultrasonic pulse velocity and the dynamic modulus calculated from the resonance frequency of the concrete. Figure 6 shows the predictions of static modulus of elasticity with the model E2. This figure presents a comparison of the actual readings vs readings that were predicted with the model E2, if a line would be presented we would be in the case of a correlation factor equals 1, which is not possible, however, with our correlation factor is possible to get a linear trend as shown in figure 6.
Figure 6. Predictions of Static Modulus of elasticity obtained with the model E2. Source: Self Elaboration.
The dynamic modulus of elasticity calculated from the ultrasonic pulse velocity (Ev) show an upward trend respect to the age and they are less than the static modulus of elasticity but show a linear correlation. The best model to predict the static modulus of elasticity is the E2, because this model has a correlation factor of 0.9454, being the highest of all the models obtained, to the extent that the correlation factor approaches one his prediction will be more accurate. This model considers a variable obtained destructively (compressive strength) and five variables obtained nondestructively (electrical resistivity, ultrasonic pulse velocity, resonant frequency in longitudinal mode, the dynamic modulus of elasticity calculated from ultrasonic pulse velocity and the dynamic modulus of elasticity calculated from the resonance frequency in the longitudinal mode).
ACKNOWLEDGEMENTS The authors acknowledge the Coordination of Scientific Research of the UMSNH for their support with the projects 12.4 and 12.5. We also acknowledge the support of the Thematic Networks Project of Promep.
READINGS TAKEN VS READINGS PREDICTED
REFERENCES
Readings predicted
300000
Alonso, E., Martínez, W., Rubio, J. C., Velasco, F., Chávez, H. L., Ávalos, M., Lara, C. y Cervantes, E. (2007), Calidad del Aire en cuatro ciudades de Michoacán, México: su efecto sobre materiales de construcción. Revista de la Construcción, ISBN 0717-7925, 2(6), Santiago de Chile, Chile, pp 66-74.
225000
150000 150000
225000
300000
Readings taken
CONCLUSIONS The results presented here should lead us to further exploiting the complementarities of the techniques. With the use of nondestructive techniques is possible to create predictive models of elastic modulus and not suppose it for structural calculations required in construction. As seen in the graphs, with increasing age of the concrete reduces the porosity by the hydration of cement, which is reflected in nondestructive testing, since the value of the readings of these tests increases with increasing age, and also the concrete strength increases with age. Nondestructive testing are affected by the porosity of the concrete, ie for a porous concrete, smaller readings are obtained with nondestructive testing, especially in the ultrasonic pulse velocity, electrical resistivity and the number of rebound, but not only by the porosity due to the water in the concrete, also by defects in concrete caused by a poorly executed construction procedure or because the concrete is already damaged.
2014, 13(1), 33 - 40
[
A.M.T., H., & S.W., J. (2012). Non-destructive testing of ultra high performance fibre reinforced concrete (UHPFRC): A feasibility study for using ultrasonic and resonant frequency testing techniques. Construction and Building Materials (35), 361–367. ACI 318. (2005). Requisitos de Reglamento para Concreto Estructural (ACI 318S-05) y Comentario (ACI 318SR-05). American Concrete Institute. Aggelis, D., Kordatos, E., D.V., S., & Matikas, T. (2010). Combined use of thermography and ultrasound for the characterization of subsurface cracks in concrete. Construction and Building Materials(24), 1888–1897. Aggelis, D., Kordatos, E., Strantza, M., Soulioti, D., & Matikas, T. (2011). NDT approach for characterization of subsurface cracks in concrete. Construction and Building Materials(25), 3089– 3097. Aggelis, D., Leonidou, E., & Matikas, T. (2012). Subsurface crack determination by one-sided ultrasonic measurements. Cement & Concrete Composites(34), 140–146. Akcay, B. (2004). Variation of in-place concrete core strength in structures from. J Mater Civil Eng., 16(5), 507–10. ASTM C 136 – 04. (2004). Standard Test Method for Sieve Analysis of Fine and Coarse Aggregates. In Annual Book of ASTM Standards. West Conshohocken, PA: ASTM.
Chavez, L. – Alonso, E. – Martínez, W. – Graff, M. – Artega, J.
]
Revista de la Construcción Journal of Construction
[ 39 ASTM C 143/C 143M – 03. (2003). Standard Test Method for Slump of Hydraulic-Cement Concrete. In Annual Book of ASTM Standards (Vol. 04.02). West Conshohocken, PA: ASTM.
Kwang-Myong, L., Dong-Soo, K., & Jee-Sang, K. (1997). Determination of Dynamic Young's Modulus of Concrete at Early Ages by Impact Resonance Test. Journal of Civil Engineering, 1(1), 1118.
ASTM C 215-02. (2003). Standard test method for fundamental transverse, longitudinal, and torsional resonant frequencies of concrete specimens. In Annual Book of ASTM Standards (Vol. 04.02). West Conshohocken, PA.: ASTM.
Liu, S. Y., Du, J. Y., & Han, L. H. (2008). Experimental study on the electrical resistivity of soil–cement admixtures. Environmental Geology, 54, 1227-1233.
ASTM C 33 – 03. (2003). Standard Specification for Concrete Aggregates. In Annual Book of ASTM Standards. West Conshohocken, PA.: ASTM.
Liu, Z., Forsyth, D. S., & Komorowski, J. P. (2007). State of the Art in NDE Data Fusion Techniques. IEEE Transactions on Instrumentation and Measurements, 56(6), 2435-2451.
ASTM C 39/C 39M – 03. (2003). Standard Test Method for Compressive Strength of Cylindrical Concrete Specimens. In Annual Book of ASTM Standards. West Conshohocken, PA: ASTM.
Maierhofer, C., Zacher, G., Khol, C., & Wöstmann, J. (2008). Evaluation of Radar and Complementary Echo Methods for NDT of Concrete Elements. Journal of Nondestructive Evaluation, 27, 47-57.
ASTM C 469-02. (2002). Standard Test Method for Static Modulus of Elasticity and Poisson’s Ratio of Concrete in Compression. In Annual Book of ASTM Standards (Vol. 04.02). West Conshohocken, PA: ASTM.
Malhotra V. M. and Carino N. J. (2004). Handbook on nondestructive testing of concrete. Boca Raton: CRC.
ASTM C 666. (2003). Standard Test Method for Resistance of Concrete to Rapid Freezing and Thawing. In Annual Book of ASTM Standards. West Conshohocken, PA: ASTM.
Malhotra, V. M. (1976). Testing of Hardened Concrete: Nondestructive Methods, ACI Monograph N.9. Detroit, MI.: American Concrete Institute.
Beutel, R., Reinhardt, H.-W., Grosse, C., Krause, M., Algernon, D., Streicher, D., Glaubitt, A. (2007). Quantitativer Verfahrensvergleich. In: Bergmeister. Ernst & Sohn, 567-573.
Millard, S., Harrison, J. A., & Edwards, A. (1989). Measurements of Electrical Resistivity of Reinforced Concrete Structures for the Assesment of Corrosion Risk. British Journal of NDT, 31, 617-621.
Bradley, E., Trevor, H., Iain, J., & Robert, T. (2003). Least Angle Regression. Statistics Department, Stanford University, 1-10.
Mindess, S., & Young, J. (1981). Concrete. Englewood Cliffs, N.J.: Prentice-Hall.
Chaki, S., Takarli, M., & Agbodjan, W. (2008). Influence of thermal damage on physical properties of granite rock: Porosity permeability and ultrsonic wave evolutions. Construction and Building Materials, 22, 1456-1461.
Miretti, R., Carrasco, M. F., Grether, R. O., & Passerino, C. R. (2004). Combined Non-Destructive Methods Applied to NormalWeight and Lightweight Concrete. Insight, 46(12), 748-753.
Efron, B. e. (2004). Least Angle Regression. The Annals of Statistics, 32(2), 407-451.
Mohammad, I. K. (2012). Evaluation of non-destructive testing of high strength concrete incorporating supplementary cementitious composites. Resources, Conservation and Recycling(61), 125– 129.
Giner, V., Ivorra, S., Baeza, F., Zornoza, E., & Ferrer, B. (2011). Silica fume admixture effect on the dynamic properties of concrete. Construction and Building Materials(25), 3272– 3277.
Neville, A. M. (1998). Properties of Concrete (Fourth ed.). Addison Wesley Longman Limited.
Goueygou, M., Abraham, O., & Lataste, J.-F. (2008). A comparative study of two non-destructive testing methods to assess nearsurface mechanical damage in concrete structures. NDT&E International(41), 448– 456. Hola, J., & Schabowicz, K. (2005). New Technique of Nondestructive Assessment of Concrete Strength Using Artificial Intelligence. NDT&E International, 38, 251-259.
Ozerkan, N., & Yaman, I. (2013). Use of Dynamic Modulus of Elasticity to Assess the Durability of Self Consolidating Concrete. In Nondestructive Testing of Materials and Structures (pp. 303308). O. Büyüköztürk et al. Ozkul, M., Tasdemir, M., & Atahan, H. (1999). Recent earthquakes in Turkey and concrete. 2nd national symposium on infrastructure of city, Adana, Turkey (pp. 9-20).
IAEA. (2002). Guidebook on non-destructive testing of concrete structures. Vienna, Austria: International Atomic Energy Agency.
Ploix, M. A., Garnier, V., Breysse, D., & Moysan, J. (2011). NDT Data fusion for evaluating concrete structures. American Institute of Physics (AIP) Conference Proceedings, doi:10.1063/1.3592084, 1335, 1307-1314.
Kaftandjian, V., Min, Z. Y., Dupuis, O., & D., B. (2005). The combined Use of the Evidence Theory and Fuzzy Logic for Improving Multimodal Nondestructive Testing Systems. IEEE Transactions on Instrumental and Measurements, 54(5), 1968-1977.
Qindan, H., Paolo, G., & Stefan, H. (2011). Predicting concrete compressive strength using ultrasonic pulse velocity and rebound number. ACI Materials Journal, 108(4), 403-412.
Kewalramani, M. A., & Gupta, R. (2005). Concrete compressive strength prediction using ultrasonic pulse velocity through artificial neural networks. Automat Construction, 15(3), 374-379. Kim, D.-S., & Stokoe II, K. H. (1994). Torsional Motion Monitoring System for Small-Strain Soil Testing. Geotechnical Testing Journal, GTJODJ, 17(1), 17-26. 2014, 13(1), 33 - 40
[
Red Durar. (1998). Manual de inspección, evaluación y diagnóstico de corrosión en estructuras de hormigón armado. 2a. Río de Janeiro, Brasil: CYTED. Samarin, A., & Meynink, P. (1981 ??? March). Use of Combined Ultrasonic and Rebound Hammer Method for Determining Strength of Concrete Structural Members. Concrete International, 3(3), 25-29.
Chavez, L. – Alonso, E. – Martínez, W. – Graff, M. – Artega, J.
]
Revista de la Construcción Journal of Construction
[ 40
Selleck, S., Landis, E., Peterson, M., Shah, S., & Achenbach, J. (1998). Ultrasonic investigation of concrete with distributed damage. ACI Materials Journal, 95(1), 27-36.
Wu, T., & T.F., L. (1998). The stress effect on the ultrasonic velocity variations of concrete under repeated loading. ACI Materials Journal, 95(5), 519-524.
Stephen, P. P., & Chair. (2003). ACI 228.1R-03. In-Place Methods to Estimate Concrete Strength. In American Concrete Institute. Farmington Hills, MI, USA: American Concrete Institute.
Zheng, L., Sharon, H. X., & Yuan, Y. (2008). Experimental investigation on dynamic properties. Construction and Building Materials 5(22), 939-947.
Tatsuoka, F., & Shibuya, S. (1992). Deformation Characteristics of Soils and Rocks from Field and Laboratory Measurements. II, 101170. Bangkok. Toutanji, H. (2000). Ultrasonic wave velocity signal interpretation of simulated concrete bridge decks. Materials and Structures/MaMriaux et Constructions, 33(3), 207-215.
Table 2. -Comparison of models obtained to predict the static modulus of elasticity. Source: Self Elaboration.
Samples
Models
Cyl. of 1st stage
Es= - 450.4348*age + 57084.0307*W/C + 4156.2526*UPV + 24.6272*RFT + 8388.2788* RNT - 2.5191*Ef Es= 3950.7938*ERT + 43852.9146* UPV + 2.4359*RFT - 4556.7676*W/C 0.3795*DENSITY + 5.1664*Ev Es= 0.0817*f´c + 17.4690*ERT + 74736.8525*UPV - 179.5659*RFT + 0.2817*Ev + 10.2927*Ef
Cyl. of 2nd stage Cyl. of 1st y 2nd stage Validation of E2
2014, 13(1), 33 - 40
[
Chavez, L. – Alonso, E. – Martínez, W. – Graff, M. – Artega, J.
]
Average error (%) 10.61
Correl. factor 0.7580
Nam.
7.11
0.9094
E1
6.79
0.9454
E2
6.82
0.947
E0
Revista de la Construcción Journal of Construction