Artificial Intelligence in Civil Engineering. Proc. 2nd Joint Workshop, March 2000, Cottbus, Germany. ISBN 3-934934-00-5
Predictive Data Mining: Practical Examples Slavco Velickov and Dimitri Solomatine International Institute for Infrastructural, Hydraulic, and Environmental Engineering, P.O. Box 3015, 2601 DA Delft, The Netherlands, e-mail:
[email protected],
[email protected]
Abstract:
The paper addresses some theoretical and practical aspects of data mining, focusing on predictive data mining, where two central types of prediction problems are discussed: classification and regression. Further accent is made on predictive data mining, where the time-stamped data greatly increase the dimensions and complexity of problem solving. The main goal is through processing of data (records from the past) to describe the underlying dynamics of the complex systems and predict its future. Second part of the paper briefly highlights the methodologies for predictive data mining used in this paper, namely: Bayesian classifier, decision tree induction algorithm (C4.5) and 'local' modelling using chaos theory. Last part of the paper presents application of the predictive data mining techniques to hydro-meteorological data.
1. Introduction Solution of the problems concerning water resources and environment today depends on large number of data sources and knowledge corpuses. Many relevant sources of data, structured observations and scientific information related to water resources and environmental processes currently exist, varying in both size and scope. The large potentials in the existing data banks need to be explored in order to transform these data/observables into valuable engineering information and knowledge. The key to these potentials can be found in data mining as a new emergent filed in hydroinformatics. Data mining as an interdisciplinary field draws from statistical analysis, database systems, machine learning, pattern recognition, neural networks, fuzzy systems and other 'soft computing' techniques. Although data mining is young interdisciplinary filed, its methods are quite developed and many of them are practically applicable. The question is: how data mining techniques can help in engineering practice? There are many examples where data mining techniques are successfully being used in data-driven modelling and decision making (Berson and Smith, 1998), where large organisations and companies (business, marketing, medical companies, telecommunications, banks, infrastructural companies etc.) already benefit from data mining (Adriaans & Zantinge, 1996; Fayyad et al., 1996). However, we argue that applications of data mining to water and environment - related problems are clearly lacking. Introducing these techniques to engineering working practices and communities raises a number of important problems and questions that need to be addressed, such as general data mining problem-solving framework and applicability and suitability of particular data mining techniques and algorithms for various types of waterrelated datasets. This work addresses some of the mentioned issues.
1
2. Data Mining – theoretical and practical aspects This section reviews general theoretical aspects of Data Mining (DM) and Knowledge Discovery in Databases (KDD), making a projection through their practical aspects for possible engineering problem-solving tasks. 2.1 Background Data mining and KDD are ‘hot’ topics in many research communities (Adriaan & Zantige, 1996), including water-related problem solving and decision-making. The sudden rise of interest in data mining can partially be explained by the following factors: q
in the 1980s, with the development of database management technologies, many waterrelated organizations and institutions built databases, containing data, information and observations about different physical processes and events, which contains large amounts of ‘hidden’ information that cannot be easily traced and extracted using traditional data analysis. Data mining with its discovery-driven nature utilises learning algorithms that can search and find clusters, patterns, associations and interesting regularities in these databases. Their ability to represent the extracted information / knowledge in a humanunderstandable form (such as decision trees, rules, data models and, concept and knowledge maps) gives them useful descriptive and predictive capabilities.
q
as the use of the communication networks (such as intranets, Internet and extranets) continues to grow, it becomes increasingly easy to connect the existing databases. Thus, for example, connecting the user/hydrologists with a database that contains information about the agricultural, demographic and administrative use of the modelled catchment, may lead do the discovery of unexpected patterns, associations and correlations. The communication networks, as giant client/server architectures, give the individual users and engineers access to central information systems, simulation modelling systems and data-driven models in a new transparent way.
q
the widespread use of Internet in the last few years and the emergent of the development of network-based distributed decision support systems (DDSS) in water - and environment related fields is constantly increasing the awareness of the sociotechnical aspects of these processes (Yan et al., 1999; Abbott and Jonoski, 1998). This dual nature of the problem-solving and decision-making processes in the water related fields demands a new class of tools – distributed judgement engines, which are able to model the social and technical impacts of the decisions taken. It is thus accepted that people, whether coming from the side of hydraulics, hydrology, and water resources or from the side of the social sciences, and who are directly influenced by any proposed changes in the aquatic environment, must be provided with the means to access the data and to generate relevant knowledge regarding their own qualities of life and economic interests. These distributed judgement engines in most of the cases require on-line search through a large amount of quantitative and qualitative data, on-line classification and clustering and online generation of knowledge. The data mining algorithms can efficiently and effectively perform such tasks.
q
over the last decade, machine-learning techniques have expanded their use into practical applications. Neural networks, genetic algorithms, fuzzy logic and other generally applicable learning techniques often make it easier to find interesting patterns into databases. These data mining and data-driven modelling techniques together with the hydraulic simulation models, which were particularly developed for specific modelling 2
purposes, may give a new dimension in water-related problem solving and decision making. q
the so-called 4th generation of physically-based hydraulic simulation modelling software (Abbott, 1996; Price, 1997) that are applied to solve different water and environmental related problems, usually produce large amounts of simulated data that are difficult to analyze using classical verification-driven techniques. Therefore, data mining offers the means for automated analysis of the simulated results and generation of new knowledge from these data.
Data mining can be defined as a process of discovering new, interesting knowledge, such as patterns, associations, rules, changes, anomalies and significant structures from large amounts of data stored in data banks and other information repositories. It is currently regarded as the key element of a much more elaborate process called Knowledge Discovery in Databases (KDD). In general, a knowledge discovery process consists of an iterative sequence of the following steps (see Figure 1): 1. data selection, where data relevant to analysis task are retrieved from database; 2. data cleaning, which handles noisy, erogenous, missing or irrelevant data; 3. data integration (enrichment), where multiple heterogeneous data may be integrated into one; 4. data transformation (coding), where data are transformed or consolidated into forms appropriate for different mining algorithms; 5. data mining, which is an essential process where intelligent methods are applied in order to extract hidden and valuable knowledge from data; 6. knowledge representation, where visualisation and knowledge representation techniques are used to present the mined knowledge to the user. Data selection
Data cleaning
Enrichment
Coding
Data mining
Reporting
•clustering •segmentation •classification •associations •prediction
•domain consistency •de-duplication •disambiguation
Information requirement
100 90 80 70 60 50 40
Action
30 20 10 0 1st Qtr
2nd Qtr
3rd Qtr
4th Qtr
1st Qtr
2nd Qtr
3rd Qtr
4th Qtr
100 90 80 70 60 50 40 30 20 10 0
Operational data
External data
Feedback
Figure 1. Position of Data Mining in the Knowledge Discovery process Data mining is based on the results achieved in database systems, statistics, machine learning, statistical learning theory, chaos theory, pattern recognition, neural networks, probabilistic graph theory, fuzzy logic and genetic algorithms. A large set of data analysis methods have been developed in statistics over many years of studies. Machine learning and statistical learning theory have contributed significantly to classification and induction problems. Neural networks have shown their effectiveness in classification, prediction, and clustering analysis tasks. One can say that there is no one specific technique that 3
characterizes data mining. Any technique that helps to extract more out of the data sets in an autonomous and intelligent way may be classified as a data mining technique. Therefore data mining techniques form a quite heterogeneous group. 2.2 Data mining goals, operations and techniques In general, data mining tasks can be classified into two categories: q q
Description: finding human-interpretable patterns, associations or correlations describing the data. Prediction: constructing one or more sets of data models (rule set, decision tree, neural nets, support vectors), performing inference on the available set of data, and attempting to predict the behaviour of new data sets.
The distinction between description and prediction is not very sharp. Predictive models can also be descriptive (to the degree that they are understandable), and descriptive models can be used for prediction. To achieve these goals, the categories of prediction as well as description are associated with the five basic operations, as presented in Figure 2.
Data mining goals Prediction
Classification
Regression
Description
Dependency modelling
Segmentation
Change and deviation detection
Data mining operations Figure 2. The connection between data mining goals and operations While there are only a couple of basic data mining operations there is a wide variety of data mining techniques which make these operations possible. Data mining systems normally do not include each of these techniques, but they often combine two or more different techniques between which the user/engineer can choose – depending on the specific problem. Therefore, potential users should survey the most common techniques, in order to decide which one will fit their engineering needs best. Figure 3 presents some common techniques assigned to the basic data mining operations, emphasising the classification and regression problems.
4
Classification &
Classification Data Mining Regression operations Support Vector Machines Decision Decision trees Trees Neural Nets Neural Data Mining Chaos theory Networks techniques
Dependency modelling/ link analysis
Segmentation
Change and deviation detection
Clustering approaches
Statistical techniques
(K-NN, SOFM, neural gas, fuzzy c-means)
(ANOVA, trend, autoregression, Fourie, wavelets)
Association Rules Sequence Discovery
Rule Rule and dataInduction models induction
Visualisation: semantic networks, graphs, decision trees, Visualisation concept and knowledge maps
Figure 3. Data mining operations and techniques The two central types of engineering prediction problems are classification and regression. Samples/observables of past experience with known attributes (features) are examined and generalized to future cases. Classification is closely coupled with clustering which is to identify clusters embedded in the multi-dimensional data space, where a cluster is a collection of data objects (groups of data) that are "similar" to one another. Similarity usually is expressed as different distance functions. Various approaches have been proposed in the literature for developing classifiers by means of clustering, which can be summarised as: (i) Iterative clustering, (ii) Agglomerative hierarchical clustering and (iii) Divisive hierarchical clustering. From a perspective of data mining, classification and clustering algorithms that employ unsupervised learning receive greater attention, such as: self-organizing feature maps (SOFM) (Kohonen, 1995), Bayesian classifiers (Stutz and Cheeseman, 1994), neural gas (Fritzke, 1995) can be mentioned. The reason for this lies in the fact that in most of engineering classification problems the set of possible classes is not known a priori. The goal is to find the classes themselves from a given set of "unclassified" objects/observalbles which may lead to discovery of previously unknown structure, because in natural systems (such as water and environment-related systems) there are usually many relevant attributes describing each object - large number of dimensions. However, we wish to emphasise that unsupervised classification task should usually come together with the background knowledge provided form the domain experts. The problem of regression is very similar to the problem of classification. It is usually described as a process of induction of the data model of the system (using some machine learning algorithm) that will be capable of predicting responses of the system that have yet to be observed. For regression the response of the system is usually a real value, while for classification is the class label(s). Time series prediction is a specialized type of regression (or occasionally classification) problem, where measurements/observables are taken over time for the same features. From a predictive data-mining perspective, the time-stamped data greatly increase the dimensions of problem solving in a completely different direction. Instead of cases with one measured value for each feature, cases have the same feature measured at different time. To overcome this problem, raw time-dependent data are usually
5
transformed for predictive data mining into lesser dimensional data space using transformations such as Vector Quantization and state-space methods (Tsonis, 1992) or simple averaging and re-sampling methods are applied. The main goal of this work is to demonstrate the applicability of some predictive data mining techniques for classification and regression engineering problems.
3. Methodology In this section we briefly describe data mining algorithms used to carry out the classification and regression case studies. More detailed inside of the employed algorithms can be found in the literature referred in the text. 3.1 Bayesian classification Bayesian classification is an approach to unsupervised classification based upon the classical mixture model (Everitt & Hand, 1981), supplemented by a Bayesian method for determining the optimal classes. In the Bayesian approach to unsupervised classification, the goal is to find the most probable set of class description (a classifier) given the data and prior expectations. The introduction of priors automatically enforces a trade-off between the fit to the data and the complexity of the class descriptions. There is no generally accepted way to rate the relative quality of alternate classifications. The methods of setting up models and searching the sets of descriptive classes have been the subject of statistical research for many years. Most of the Bayesian classifiers utilise model that gives the probability of the data conditioned on the hypothesised model: P(X H, p ) , known as likelihood function. Maximum Likelihood Estimation (MLE) deals with finding the set of models and parameters that maximises this probability. However, MLE usually fails to provide convincing way to compare alternate classifications that differ in class models and/or the number of classes. MLE usually increases with both model complexity and number of classes (until the class number equals the number of cases). The alternative approach is to find out the probability of different hypothesised models (probabilistic models) given the data, P(H X ) and then to compare the models, which in this case have different number of classes. This strategy is employed in the AutoClass Bayesian classification algorithm (Stutz and Cheeseman, 1994). Given a set of data X the algorithm search for two things: for any classification probabilistic model T it searches for the maximum posterior parameter values V , and irrespective of any V it seeks the most probable T. Thus there are two levels of search: parameter level search and model level search. For any fixed T specifying the number of classes and their class models, the algorithm searches the real-valued space of allowed parameter values for the maximally probable V using exhaustive search, which is computationally expensive process. The model level search involves the number of classes J and alternate class models Tj . There are several levels of complexity in the model level search. The basic level involves a single class model Tj common to all classes, with search over the number of classes. The other search level allows the individual Tj to vary from class to class. The result of the AutoClass Bayesian classification algorithm is one or more of the best classifications found. A classification consists of the class model(s) and a set of classes, each with the class probability and
6
parameters. Classifications are rated in terms of log of the relative marginal probability of the hypothesised model given the data. Details about the AutoClass mathematical model and implementation can be found in Stutz and Cheeseman (1994). Berger (1999) gives excellent overview of the state-of-the-art in Bayesian analysis. 3.2 Inducting decision trees from data Machine learning methods that represent their mined knowledge as decision trees and classification rule sets form family of classifiers that can be effectively used in predictive data mining for solving classification problems. In most of these algorithms the target of mining (set of class labels) has to be pre-determined. There are basically three groups of algorithms that derive decision trees, which differ in the feature selection criterion for partitioning the training data set. The most well known algorithm of the first group is called ID3 (Interactive Dichotomizer 3), while in the second group the CART (Classification and Regression Trees) algorithm is the most prominent. The third group uses statistically based feature selection criteria. In this work we used the enhanced version of the ID3 algorithm know as C4.5 (Quinlan 1992). The learning algorithm is presented with a set of examples relevant to the classification task. The aim of the learning method is to produce a tree that correctly classifies all examples in a subset of the training set. All other examples in the training set are then classified using the tree. If the tree gives the correct answer for all of these examples then it is correct for the entire training set, and the iterative process terminates. If not, a selection of the incorrectly classified examples is added to the initial subset and the process starts again. A divide-andconquer strategy is used to construct the decision tree (Quinlan, 1986). The choice of the test to partition the training set is crucial for the complexity of the inducted tree. The test is to select an attribute for the root tree and subsequent subtrees. The C4.5 algorithm adopts an information-based method that relies on two assumptions. If set S represent the training set and x,y and z are number of examples of classes X, Y and Z respectively, than the assumptions are: q any correct decision tree for S will classify examples in the same proportion as their representation in S. Thus an arbitrary example belongs to class X, Y and Z with probability: x y z , or respectively and (1) ( x + y + z) ( x + y + z) ( x + y + z) q when a decision tree is used to classify an example, it returns a class. A decision tree can thus be regarded as a source of a message X, Y, or Z, with the expected information needed to generate this message given by: x x y x − I(X, Y, Z) = − log 2 log 2 ( x + y + z) ( x + y + z) ( x + y + z ) ( x + y + z) (2) z z − log 2 (x + y + z ) ( x + y + z) From these assumptions, the expected information required for the tree with attribute A as its root is given by: x + yi + zi ⋅ I( x i + y i + z i ) E ( A) = ∑ i (3) x+ y+z
7
where x i , y i , and z i are number of examples of classes X, Y and Z respectively with value A i of the attribute A. The summation gives the total expected information for attribute A. The information gained by branching the tree on A is: GAIN(A) = I(X, Y, Z) − E(A)
(4)
At each non-leaf node of the decision tree, the gain of each untested attribute is determined. This gain in turn depends on the value of x i , y i , and z i for each value A i of the attribute A. Every example is examined to determine its class and its value of A. Thus, the total computational requirement per iteration is proportional to the product of size of the training set, the number of attributes, and the number of non-leaf nodes in the decision tree. The training stage of the algorithm results is a classifier in a form of decision tree, which can be used to classify an unseen set of testing samples. Furthermore a set of classification rules can be extracted form the decision tree by tracing the path from the root to each leaf (corresponding class). This set of rules can be consequently plugged into propitiate knowledge-based system. 3.3 Local modelling based on chaos theory The problem of time-series prediction is of high practical importance for engineering practice. A traditional way to approach the problem is to estimate the underlying function globally, that is for the whole range of possible inputs. In this kind of approach methods like neural network became popular and have proven their practical applicability. In the last decade, however, so-called local models (separately applied to certain range of input data) have been a source of much interest because of their ability to simplify modelling of highly dimensional and non-linear systems and in many cases ability to give better results than the global models (Tsonis, 1992; Froyland, 1992; Singer et al, 1992; Kapitaniak, 1998). This is especially proven if the function characteristics vary throughout the feature space, which is present in almost all natural systems that are subject of modelling. In this work we investigate the possibility to construct simple local models (linear at this stage) that will be used for prediction of the chaotic dynamics of the system expressed trough the time-series of observables. The embedding theorem, or method of delays (Takens, 1981) will be used to reconstruct the phase space of the underlying non-linear dynamics of the system based on monitored data - observables. The theorem states that the use of a single measured variable x(t) and its time delays provides N-dimensional space that can approximate the full multivariate state space for the observed system. The time-series is first embedded in a state space using delay coordinates as: x( t ) = [x (t ), x ( t − τ),..., x ( t − ( N − 1)τ)]
(5)
where x(t) is the complete state vector, x(t) is a value of the time-series at time t, τ is a suitable (optimal) time delay and N is the embedding dimension (degree of freedom). The embedding theorem guaranties that the full knowledge of the behaviour of the dynamic system is contained in the time series of any measured variable and that an approximation for the full multivariate phase space can be constructed from a single time series. Several methods for estimating time delay τ and embedding dimension N exist (Tsonis, 1992), which can be summarised as follows: §
Analytical methods for time delay estimation:
8
§
§
- auto-correlation and power spectrum functions; - average mutual information (AMI) function; - degree of separation function; - Lyapunov exponents; Analytical methods for embedded dimension estimation: - false nearest neighbours; - bad prediction method; - fractal and correlation dimensions; Empirical methods (for estimating both the time delay and dimensions): - neural networks; - genetic algorithms
Having the state space reconstructed, one can build the prediction model in a form of multidimensional maps (discrete case is considered): x( t + T) = f T (x( t ) )
(6)
where the vector x(t) is the current state of the system and x(t+T) is the state of the system after a time interval T and fT is a mapping function. The problem is than to find a good expression (local models) for the vector function fT. Usually this is a linear lest-squares problem, which can be solved efficiently using standard linear algebra techniques. A generalised scheme for constructing and testing the local models adopted in this work is presented in Figure 4. Time series data
Training data Testing data Embedding Evaluate prediction Vector quantization (K-NN, SOFM)
prediction horizon Build local data sets
Predict next value
Calculate local models based on local data sets Local predictors
Figure 4. Scheme for constructing and testing local state space models The input data (vectors in Rn) is divided into training and testing set. Based on the training set, the embedded data space is quantized, using k-d tree technique (Bentley, 1975), SOFM or some of other vector quantization algorithm. Local data sets are then constructed for each of the state vectors: the local data set for a state vector is formed of those data vectors to which it is closest (e.g. based on Euclidean distance). If the local data set of a state vector is considered too small for building the local models, it can be augmented from the data sets of similar, closely lying vectors. Finally, local data models (linear at this stage) are
9
constructed based on the local data sets which are then used to predict the dynamics of the system (move the system from state x(t) into state x(t+T)). The performance of the model can be evaluated against the testing set.
4. Applications: results and discussion The described data mining algorithms were use to carry out two case studies: (i) classification and (ii) regression, using hydro-meteorological data sets from Hoek van Holland station in the Netherlands. In the classification problem the main goal is to discover and predict particular classes of surge events for decision-making purposes. In addition, improving the accuracy and reliability of the surge water levels prediction within the time horizon of 3 to 6 hours is of outmost importance for navigational purposes. The data sets comprise of measured water levels, wind speed, wind direction and air-pressure for the period between 1990 - 1996 with the sampling time of 10 min. In order to remove the influence of the relative motion of the earth, moon and sun, astronomical tidal oscillations were subtracted from the measured water levels. The residual water level time-series in this text are referred as a surge. The additional assumption is that the data is relatively 'clean' and validated. For the classification experiment, Bayesian classifier implementing unsupervised learning was used. In order to remove the high frequency fluctuations of the surge, wind speed and direction, which are not essential while dealing with classification task, the hourly data were generated by taking average of the 6 measurements with the time interval of 10 min. This resulted in 45984 cases for the training data set (1990-1995) and 8784 cases for the validation set (1996) in 4 dimensional feature space. Several runs were carried out using different probabilistic models. The best result were achieved using log-normal probabilistic model which resulted in 10 distinguishing classes of surge events. Statistical heuristic measures were used to access the quality and the strength of the classes found, namely: (i) the approximate geometric mean probability for instances belonging to each class, computed from the class parameters and statistics. This approximates the contribution made, by any one instance "belonging" to the class, to the log probability of the data set versus the classification (considered as one big class). It thus provides a heuristic measure of how strongly each class predicts "its" instances; (ii) the class divergence, or cross entropy versus the single class classification, is a measure of how strongly the class probability distribution function differs from that of the dataset as a whole; (iii) normalised attribute influence values summed over all classes, which gives a rough heuristic measure of relative influence of each attribute in differentiating the classes from the overall data set. Results from Bayesian classification analysis are summarised in Table 1 and Table 2. Table 1. Surge event classes found from the Bayesian classification analysis Class No. 0 1 2 3 4 5 6 7 8 9
Relative class strength 1.00e+00 8.77e-01 5.08e-01 2.63e-01 5.19e-01 3.04e-01 1.68e-01 1.42e-01 5.24e-02 1.65e-02
Log of class strength -3.91e+01 -3.92e+01 -3.98e+01 -4.04e+01 -3.98e+01 -4.03e+01 -4.09e+01 -4.11e+01 -4.21e+01 -4.32e+01
Class cross entropy 1.87 1.58 1.72 2.32 2.46 1.70 1.77 2.69 2.57 5.46
Class weight 7571 7067 5403 4895 4617 4408 3721 3609 2481 2212
Normalised class weight 0.165 0.154 0.117 0.106 0.100 0.096 0.081 0.078 0.054 0.048
10
Table 2. Normalised attribute influence values summed over all classes Attribute (feature) Surge water level Wind EW component Wind NS component Air pressure
influence value 1.000 0.659 0.625 0.404
The analysis of the surge event classes showed that all classes (except class 9) have relatively same strength and class divergence. The comparison of the deviations of statistical parameters for the attributes calculated for each class against the classical supervised Kmeans classification (DM-DNZ, 1999) have confirmed the superiority of the Bayesian classification for this particular data set. Furthermore, the results presented in Table 2, mined by the algorithm, have realistic physical interpretation based on cross-correlation statistical analysis done in our previous study (DM-DNZ, 1999). The discovered surge event classes were then used to train and infer the decision tree induction algorithm C4.5 using the same training data set. The output of the C4.5 algorithm as a classifier in a form of decision trees was used to predict the classes of unseen test set (8784 cases for 1996). Results from training and validation of the decision tree classifier are presented in Table 3 and Table 4. Table 3. Result from the training of the C4.5 decision tree classifier - absolute error = 1.5 % class 0 class 1 class 2 class 3 class 4 class 5 class 6 class 7 class 8 class 9 predicted / original 7945 22 17 0 17 16 35 7 0 0 class 0 45 7606 31 32 5 21 16 0 7 0 class 1 35 35 5337 0 15 13 0 12 8 0 class 2 7 39 4899 0 13 15 0 0 17 class 3 29 11 5 0 4393 0 3 16 0 0 class 4 19 22 9 13 0 4242 1 1 30 0 class 5 36 21 0 10 8 3 3401 0 0 2 class 6 21 0 5 0 42 1 3 3182 2 0 class 7 0 10 17 15 0 31 0 1 2155 1 class 8 1 2 0 23 0 3 19 0 0 1908 class 9
Table 3. Result from the validation of the classifier - absolute error = 4.4 % class 0 class 1 class 2 class 3 class 4 class 5 class 6 class 7 class 8 class 0 predicted / original 2444 18 27 0 24 13 36 13 0 0 class 0 16 1183 13 10 0 12 14 0 0 0 class 1 16 15 793 0 15 3 0 5 9 0 class 2 3 12 0 299 0 1 10 0 0 1 class 3 10 4 4 0 675 0 0 19 0 0 class 4 10 12 4 3 0 667 2 3 5 0 class 5 14 11 0 12 1 2 820 0 0 8 class 6 15 0 4 0 23 6 0 1116 1 0 class 7 0 1 8 1 0 15 0 2 184 0 class 8 0 0 0 3 0 2 9 0 1 102 class 9
The evaluation of the training and testing data sets, with misclassification errors of 1.5 % and 4.4 %, showed very good performance of this induction data mining algorithm for building accurate classifier of the surge events. In principle, this predictive data mining classification technique can be reliably used in the engineering practice to predict the classes of surge events for decision-making purposes once when meaningful classes are found. 11
For the regression experiment, surge time series (10min data observations for the hydrological year 1994/95) were used to reconstruct the state space of the system, based on methodology described in section 3.3. The shape of the atrractor of the system projected in 2D is presented in Figure 5.
Figure 5. Attractor of the state space of the system The estimation of the time delay and embedding dimension was done using the invariant characteristics and techniques based on the chaotic dynamics (Tsonis, 1992). The optimal time delay for the reconstructed state space was determined using the average mutial information function (AMI), presented in Figure 6. The dime delay found is 90 minutes or 1,5 hours. The embedding dimension, estimated using the false nearest neighbours technique, was found to be 4 (see Figure 7), which provides the evidence that there is low dimensional system that characterises the complex natural system. The presence of chaotic dynamic behaviour of the system was proven by computing the global and local Lyapunov exponents, which give an indication of the evolution of phase space of the system as a function of time. Positive Lyapunov exponents suggested presence of chaos. The largest Lyapunov exponent is estimated to be 0.25, which gives indication that reliable prediction can be made for maximum 3 hours ahead.
Figure 6. AMI function for the surge time series
12
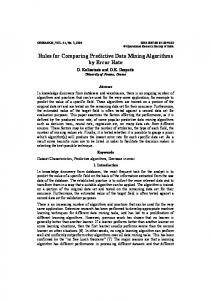
Figure 7. False nearest neighbours for the surge time series. Shows sharp drop close to zero at D=4 Several local data models were built in order to predict the surge water level for different time horizons. The predicted surge water level for 20 minutes in advance using local linear models is presented in Figure 8. The Root Mean Squared Error (RMSE) for the testing set (2000 samples from 50 001 to 52 000) with the prediction time horizon of 20 minutes is estimated to be 2.3 cm.
Figure 8. Local linear models for surge time-series prediction
Embedding dimension = 4, Time delay τ=9 time steps. Prediction=2 time steps (20 minutes). RMSE=2.3 cm
13
Further tests were done for different prediction horizons and different local models. The predicted surge water level for 1 and 2 hours in advance using local linear models are presented in Figure 9 and Figure 10 respectively. The computed errors (Mean Squared ErrorMSE, Root Mean Squared Error – RMSE and Mean Absolute Error- MAE) are presented in the Table 4. Table 4. Result from the local linear model prediction of the surge water level Error MSE RMSE MAE
Horizon 2 Horizon 6 Horizon 9 (20 min) (1 hour) (1.5 hours) 5.187 13.061 22.562 2.277 3.614 4.75 1.707 2.656 3.437
Horizon12 (2 hours) 30.045 5.481 4.005
Horizon15 Horizon18 (2.5 hours) (3 hours) 35.141 37.411 5.928 6.116 4.32 4.451
The testing set (2000 samples in total) was chosen to contain two types of dynamic behaviour of the system. First part is characterised by small amplitude and variance of the surge (cases 50000-51400), second part is characterised by large variations both in variance and the surge amplitude (values between –47 cm and 79 cm). Such a selection of the testing set was done in order to test the predicting capabilities of the trained local linear models for contrasting dynamic states of the system. Results from the prediction of the surge water level using time horizon between 20 min and 1 hour (short prediction) show that local linear modelling of the phase-space state of the system give very encouraging results (expressed in RMSE between 2.23 – 3.6 cm). Extension of the prediction horizon to 2 hours has showed that there is still enough local predictive information embedded into the attractor of the system (which resulted in a RMSE around 5.5 cm).
Figure 9. Local linear models for surge time-series prediction Embedded dimension = 4, Time delay τ=9 time steps. Prediction=6 time steps (1 hour). RMSE=3.6 cm
14
Figure 10. Local linear models for surge time-series prediction Embedded dimension = 4, Time delay τ=9 time steps. Prediction=12 time steps (2 hours). RMSE=5.5 cm The predictive performances of the local linear models for 1 hour ahead were further compared with two other data-driven modelling techniques: Artificial Neural Network (ANN) and Support Vector Machines (Vapnik, 1998; Dibike et al., 2000), using the same data set. The results are summarised in Table 5. Table 5. Result from the 1 hour ahead prediction of the surge water level using local linear models, ANN and SVM Local linear models
RMS error
3.61
ANN
6.53
ANOVA kernel 12.90
Support Vector Machines full polynomial radial basis kernel function 13.79 12.89
The results showed that for short-term prediction of the surge water level (1-2 hours), local linear models have outperformed ANNs and SVMs. ANNs perform well for longer prediction horizon (>12 hours) because of their generalisation capabilities. SMVs have shown excellent training performances, but still poor prediction capabilities in regression problems. Finally, prediction of the surge water level using the maximum prediction horizon of 3 hours, as identified using the invariant characteristics, has shown that the local linear models are able to correctly predict the amplitudes of the surge, in “stormy” situations (RMSE is estimated to be 6.1 cm) as well. However, a phase error can be seen. The reason for the presence of this kind of error might be from a systematic nature due to the subtraction of the astronomical tide from the measured water levels as well as from the low-frequency periodic components present in the time series govern by the global oceanographic system. Identification, decomposition and removal of these components can be done using transformation from “amplitude-time” domain into the “frequency-time” domain using techniques such as wavelet analysis. Furthermore, building non-linear local models (such as polynomials and radial-basis functions) of the phase-space of the system may also further improve the predictive capabilities. Our research using the above-mentioned techniques is continuing along these lines.
15
5. Conclusions In this work we discussed and demonstrated some of the predictive data mining techniques focusing on two types of engineering problem solving: classification and regression. Unsupervised Bayesion classification is a useful approach when dealing with large amount of data and when classes have to be discovered. Its simple nature and the probability theory background makes this approach powerful data mining tool, especially when combined with the domain knowledge. Machine learning decision tree induction technique C4.5 has shown its ability of building accurate classifiers with strong predictive capabilities for the future surge class events. Finally, we demonstrated that local linear modelling of the state space of the studied complex nonlinear dynamic system could accurately predict the surge water level within its prediction time horizon.
6. References Abbot, M.B. (1996). The sociotechnical dimension of hydroinformatics. Proceedings of the second International Conference on Hydroinformatics. Zurich, Switzerland. Abbott, M. B., & Jonoski, A. (1998), Promoting collaborative decision-making through electronic networking, in Babovic, V. and Larsen, L.C, editors Hydroinformatics 98, Balkema, Rotterdam. Adriaans P. and D. Zantinge (1996). Data Mining. Syllogic. Berger, J.O. (1999). Bayesian Analysis: A look at Today and Thoughts of Tomorrow. Prepared to JASA 2000 workshop, Duke University, USA. Berson, A. and S.J. Smith (1998). Data Warehousing, Data Mining, & OLAP. McGraw-Hill Series on Data Warehousing and Data Management. Bentley, J. L. (1975). Multidimensional Binary Search Trees Used for Associative Searching. Communications of ACM 18, 9. Dibike, Y.B., S. Velickov and Solomatine D.P.(2000). Support Vector Machines: Review and Applications in Civil Engineering. 2nd Workshop on Application of AI in Civil Engineering. Cottbus, Germany. DM-DNZ (1999). Investigation of the Applicability of Data Mining Techniques: Hoek van Holland Case Study. IHE internal report, Delft, The Netherlands. Everitt, B. S. and Hand, D. J. (1981). Finite Mixture Distributions. London: Chapman and Hall. Fayyad, U., Piatetsky-Saphiro, G.; Smyth, P. (1996), From Data Mining to Knowledge Discovery: An Overview, in: Fayyad, U. et. al. (eds. 1996). Frizke, B. (1995). A growing neural gas network learns topologies. Advances in Neural Information Processing Systems 7. MIT Press, Cambridge MA. Froyland, J. (1992). Introduction to Chaos and Coherence. The Institute of Physics London, IOP Publishing Ltd. Kapitaniak, T. (1998). Chaos for Engineers: Theory, Applications and Control. SpringerVerlag.
16
Kohonen T. (1995). Self-Organizing Maps. Springer-Verlag. Price, R.K. (1997). Hydroinformatics, society and market. Internal publication. Delft: IHE. Quinlan, J. R. (1986). Induction of decision trees. Machine Learning No.1. pp.81-106. Quinlan, J. R. (1992). C4.5: program for machine learning. Morgan Kaufmann. Singer, A., C., G. W. Wornell and Oppenheim, A. V. (1992). A Nonlinear Signal Modelling Paradigm. In Proc. of ICASSP. Stutz, J. and Cheeseman, P. (1994). AutoClass - a Bayesian Approach to Classification. In Maximum Entroopy and Bayesian Methods, Cambridge 1994, eds. J. Skilling and S. Sibisi. Dodrecht, The Netherlands: Kluwer Academic Publisher. Takens, F. (1981). Detecting strange attractors in turbulence. in Dynamic Systems and Turbulence, eds. D rand and L. S. Young, Lecture Notes in Mathematics. Springer-Verlag. Tsonis, A., A. (1992). Chaos: From Theory to Applications .Plenium Press, New York Vapnik, V., Statistical Learning Theory, Willey, New York, 1998. Yan, H., D. P. Solomatine, S. Velickov and Abbott M. B.(1999). Distributed Environmental Impact Assesment using Internet. Journal of Hydroinformatics, Vol.1, Issue 1. July 1999, pp. 59-70.
17