Engineering, University of Saskatchewan, Saskatoon, SK, Canada S7N 5A9. 2. Department of Geography & Environmental Studies, Carleton University, Ottawa, ...
RISK-BASED ASSESSMENT OF THE SUSTAINABILITY OF THE RECLAMATION STRATEGY – Second Progress Report
By Amin Elshorbagy1 Sean Carey2 1
Centre for Advanced Numerical Simulation (CANSIM), Department of Civil & Geological Engineering, University of Saskatchewan, Saskatoon, SK, Canada S7N 5A9 2
Department of Geography & Environmental Studies, Carleton University, Ottawa, ON, Canada K1S 5B6
CANSIM SERIES REPORT NO. CAN-08-02
Centre for Advanced Numerical Simulation (CANSIM) Department of Civil & Geological Engineering, University of Saskatchewan, Saskatoon, SK, CANADA December, 2008
TABLE OF CONTENTS
SUMMARY ………………………………………………………………………………….iv 1. INTRODUCTION …………………………………………………………………………1 2. THE RESEARCH FRAMEWORK……………………………………………….…...…2 3. TASKS OF YEAR 2 (2008) …………………………………………………………….…2 4. METHODOLOGY ………………………………………………………………………...3 4.1 Hydrometeorological studies …………………………………………………….….3 4.2 Hydrological modeling ………………………………………………………………4 5. RESULTS AND PROGRESS ………………………………………………………...…..5 5.1 Hydrometeorological studies ….………………………………………………….....5 5.2 Hydrological modeling ………..……………………………………………….…….8 5.2.1 The reclaimed SWSS site ………………………………………..……………..8 5.2.2 The natural OJP site ………/……………………………………..…………….9 5.3 Long term performance of the sites ….……………………………………………12 6. WORK TO BE COMPLETED IN YEAR 3 (2008) …………………………..………..14 7. THE RESEARCH TEAM ……………………………………………………………….14 REFERENCES …………………………………………………………………………...…14
ii
LIST OF FIGURES AND TABLES
Figure 1. Composite photographs of meteorological towers and sites ……………………..…4 Figure 2. Total change in seasonal evapotranspiration due to changes in available energy, vapour pressure deficit, surface conductance and error …………………………….................6 Figure 3. Half-hour evaporation for the JPF, SBH and NRS watershed on June 1, 2008..........7 Figure 4. The relation between bulk surface resistance and the ratio of latent heat to equilibrium latent heat ………………………………………………………………………...8 Figure 5. Simulated and observed moisture in the SWSS watershed; (a) Till layer calibration (2006); (b) Tailings sand layer calibration (2006); (c) Till layer validation (2005); (d) Tailings sand layer validation (2005)………………………………………………………………….10 Figure 6. Observed and predicted evapotranspiration (mm) in the natural SWSS site …………………………………………...……………………………………………………11 Figure 7. Simulated and observed moisture in the OJP watershed for validation year 2001 (a) Layer (a) Layer No. 1 (450 mm); (b) Layer No. 2 (600 mm).………………………………. 11 Figure 8. Observed and predicted evapotranspiration (mm) in the natural OJP site ………...12 Figure 9. Frequency curve of maximum moisture deficit of SWSS and OJP sites ………....13 Figure 10. Frequency curve of actual evapotranspiration in both sites.……...…………….....13
Table 1. Growing season evapotranspiration (in mm) for the research watersheds……..……6
iii
SUMMARY This is the second progress report on the project entitled “Risk-based assessment of the sustainability of the reclamation strategy”. The project is progressing well to date with no significant deviations from the proposed timeline. The goal of this project is to assess the sustainability of the oil sands reclamation strategy in light of the uncertainty imposed by climatic variability. To attain this goal, the specific objectives of this project are: (i) to calibrate and modify the SDW model to simulate the hydrological processes; especially daily soil moisture and actual evapotranspiration (ET), on various reclaimed sites that represent different development stage; (ii) to calibrate and modify the SDW model to simulate the hydrological processes on various natural sites from the boreal forest that represent different species of vegetation; (iii) to simulate the hydrological processes in the various reclaimed and natural sites over a long period of time (50 -60 years); (iv) to quantify the long term hydrologic performance of the various sites using the probabilistic approach; and (v) to assess the performance of the reclaimed sites using the natural sites as a reference for the comparison. The tasks of the first two years (2007 and 2008) of the project have been completed. Hydrometeorological studies on the reclaimed SBH, the reclaimed jack pine forest (RJF), the reclaimed South West Sand Storage (SWSS), and the newly reclaimed Suncor (NRS) sites have been conducted. For 2008, the surface energy balance, evapotranspiration and preliminary water balance are completed for SBH, RJF and NRS sites. Based upon a decision made during a presentation to CEMA in July 2008, the program was modified slightly to enhance the long-term nature of the flux measurements and the sites will remain in their present location in 2009. The site-specific SDW model has been transferred into a more generic (GSDW) model. This model is an upgrade/generalization of the existing site-specific SDW model. The GSDW model has been used to simulate the reclaimed South West Sand Storage (SWSS) and the natural Old Jack Pine (OJP) sites. Both sites have been simulated and the simulation results are provided in this report. A historical meteorological record of 50 years has been used with the GSDW model to produce daily soil moisture content and evapotranspiration values over 50 yeas. Subsequently, frequency curves of both soil moisture storage and annual evapotranspiration have been constructed for both sites. Even though the analysis and the results provide a solid basis for comparing natural and reclaimed sites, it is recommended, at this stage, to take the numbers with caution until the GSDW model and analyses of all sites are completed.
iv
1. INTRODUCTION The oil sands mining industry in Canada has made a commitment to restore mining areas to an equivalent capability to that which existed prior to mining. One of the central requirements in the design of reclamation soil covers in order to meet this goal is that the soil cover has a sufficient Available Water Holding Capacity (AWHC) to allow for evapotranspiration (ET) requirements over the summer moisture deficit typical in the region. In situations where evapotranspiration demands exceed the AWHC, vegetation is susceptible to increased stress and mortality, elevating the risk of ecosystem failure. Currently, various soil cover alternatives are subject to classification and evaluation based on the Land Capability Classification System (LCCS) for Forest Ecosystems in the Oils Sands (Leskiw, 2004). The LCCS uses AWHC to identify the soil moisture regime of the soil cover required for the development of various target ecosystems. Recently, work has been initiated to present an alternative probabilistic approach for the assessment of the hydrologic performance and design of these reclamation soil covers. A previously developed site specific water balance model (the SDW model by Elshorbagy et al., 2005; 2007) for monitored prototype reclamation covers (the SB30 cover) has been used along with the historical meteorological record to estimate the maximum soil moisture deficit that various soil covers are able to sustain over the growing season. Frequency curves of the maximum annual moisture deficit are used to assess the probability that the cover is not capable of providing a particular threshold of moisture demand (Elshorbagy and Barbour, 2007). To establish the maximum annual moisture deficit for different ecosites, the factors affecting the timing and magnitude of water balance components, particularly evapotranspiration, must be determined. This hydrological information can then be used to calibrate and test the SDW model, which upon validation is driven by long-term climate data to generate the frequency curves for assessing the probability of cover failure. However, the likelihood of cover failure will vary based upon cover design, vegetation species and age. Therefore, it is necessary to examine different covers at discrete stages of development. It is also important to assess the hydrologic performance of the reclaimed covers in comparison with natural sites for a complete assessment of restoration strategies. The goal of this project is to assess the sustainability of the oil sands reclamation strategy in light of the uncertainty imposed by the climatic variability. To attain this goal, the specific objectives of this project can be stated as follows: (i) to calibrate the SDW model to simulate the hydrological processes; especially daily soil moisture and actual evapotranspiration, on various reclaimed sites that represent different development stage; (ii) to calibrate the SDW model to simulate the hydrological processes; especially daily soil moisture and actual evapotranspiration, on various natural sites from the boreal forest that represent different species of vegetation; (iii) to simulate the hydrological processes in the various reclaimed and natural sites over a long period of time (50 -60 years); (iv) to quantify the long term hydrologic performance of the various sites using the probabilistic approach; and (v) to assess the performance of the reclaimed sites using the natural sites as a reference for the comparison.
1
2. THE RESEARCH FRAMEWORK This research study involves both field and modeling components that will occur simultaneously. Reclamation and natural sites were identified for the study based on their contrasting ecohydrology and risk of failure. Hydrometeorological studies and data collection are planned to be conducted on the following reclamation sites: (i) the flat top of the South Bison Hill (SBH), which is capped with a 20 cm of peat-mineral mix over 80 cm of glacial till over shale; (ii) the South West Sand Storage (SWSS), which consists of mine tailings sand overlain with 40-80 cm of mixture of peat and secondary mineral soil; (iii) newly reclaimed Suncor (NRS) site that has a 12:1 slope of 20 cm of peat over sand; (iv) and the 15-year old jack pine forest (RJF) (Mildred Lake North Side), which is 50 cm of peat over tailing sand. At all sites, eddy covariance (EC) will be or has been used to directly measure exchanges of energy, water, heat, and CO 2 between the surface and the atmosphere. Concomitant measurements of air and ground temperature, solar and terrestrial radiation, wind, precipitation, humidity, and soil moisture will be used to complete water balances for a minimum of two years per site. The Waste Area 1A Suncor site of 14 year-old spruce forest and the Syncrude LFH over sand were removed from the study in favour of long-term monitoring of the other sites as decided on 8 July 2008 when preliminary results were presented to CEMA. Three natural forested sites from the Boreal Atmosphere Exchange Study (BOREAS) (Sellers et al., 1995) and the Boreal Ecosystem Research and Monitoring Sites (BERMS) program (http://berms.ccrp.ed.gc.ca; McCaughey et al., 2000) will be used to study the hydrologic performance of the natural sites for comparison purposes with reclaimed sites. The natural sites are (i) old jack pine (OJP) site, located approximately 100 km NE of Prince Albert, Saskatchewan; (ii) old black spruce (OBS) site, located in a muskeg forest near White Swan Lake, Saskatchewan; and (iii) old aspen (OA) site, located near the south end of Prince Albert National Park, Saskatchewan. Initially, five natural sites were proposed for this study, but later it was restricted to only three sites due to data limitations. The SDW model will be modified and recalibrated to simulate the hydrological processes in the five reclaimed as well as the three natural sites. The end goal of this step is to develop a generic model, rather than the existing site specific model, that can simulate the hydrological processes in any of the existing or hypothetical sites. Upon validation, the SDW model will be used to simulate the hydrological processes in the eight sites over an extended time period (e.g., 60 years) using the available historical records of meteorological data as model inputs. The long-term simulations will be used to produce frequency curves representing the annual evapotranspiration and the annual maximum soil moisture deficit values. The resulting frequency curves will be used to quantify the hydrological performance of the various sites in probabilistic forms.
3. TASKS OF YEAR 2 (2008) The following tasks were completed within year 2 (2008): 3.1 Hydrometeorological study on the reclaimed SBH site, which will be the sixth year (DY6) of data collection on this site; 3.2 Hydrometeorological study on the newly reclaimed Suncor (NRS) site, which will be the second year (DY2) of data collection on this site; 2
3.3 Hydrometeorological study on the reclaimed 15-year old jack pine forest (RJF), which will be the first year (DY2) of data collection on this site; 3.4 Adaptation of the SDW model to become generic (GSDW) and suitable for various reclaimed and natural sites in the area; 3.5 Calibration and Application of the GSDW model on the SWSS site as well as the long term simulation; and 3.6 Calibration and Application of the GSDW model on the OJP site as well as the long term simulation. The major emphasis of the modeling work of this year has been placed on converting the sitespecific SDW model to become more generic (GSDW model) to facilitate future simulations. Furthermore, the GSDW model has been applied to both the reclaimed SWSS and the natural OJP sites.
4. METHODOLOGY 4.1 Hydrometeorological studies In 2008, the NRS and RJF were continued for a second year along with the 6th year of operation of SBH. Two years of data have previously been collected for SWSS. As decided in consultation with CEMA, towers will remain on SBH, NRS and RJF for the 2009 growing season due to the value of long-term measurements. At each site, an eddy covariance system is placed above the canopy or surface to measure fluxes of sensible heat, evapotranspiration and CO 2 . Supplemental measurements of solar radiation, net radiation, air temperature, relative humidity, wind speed, soil heat flux, soil temperature, soil moisture and soil suction at various depths are recorded every half hour. Sites run from early May through mid October to characterize the complete growing season. Biometric parameters such as leaf area index, above ground biomass, stand density and composition, and species diversity is recorded at each site along with weekly photographic records from fixed locations. This information provides the required variables and parameters for the SDW model, and provides detailed information on the ecohydrology of the study sites and its controlling factors. By having at least two years of data from each site, it is anticipated that the natural variability in ecohydrology will be captured for the site at that stage of development. The methods used here are the same as those used at the natural BERMS and BOREAS sites, allowing direct inter-comparison.
3
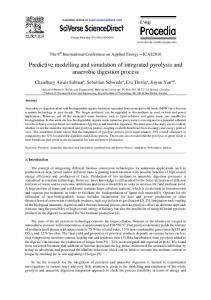
NRS
RJF
SWSS
SBH
Figure 1: Composite photographs of meteorological towers and sites. 4.2 Hydrological modeling The site-specific SDW model has been transferred into a more generic (GSDW) model. This model is an upgrade/generalization of the existing site-specific SDW model, which was developed by Elshorbagy et al. (2005; 2007). The main drawback of the previous SDW model version was that it did not account for a canopy interception module. Moreover, the SDW model has no flexibility in choosing the number of soil layers (three layers only), layer thickness, soil layer stratification, and topographic inclination. The developed model is entitled “generic” in the sense that it is aimed to be implemented on a wide spectrum of watersheds, soil cover alternatives, and topographic conditions in semi-arid regions, in a userfriendly environment, for the purpose of assessing the performance of reconstructed watersheds. The GSDW model provides the user with the flexibility to use either of two approaches to account for canopy interception based on the available data, in addition to a third selection, where the canopy interception is not incorporated due to the lack of information regarding the canopy coverage, or the absence of canopy in the case of newly reconstructed watersheds. The reconstructed watersheds study area is located in north of Fort McMurray (57039’N and 111013’W), northern Alberta, Canada. The mean annual air temperature is 0.7° C (1971-2000 Environment Canada normal), and the mean total annual precipitation is 455.5 mm. Details of the reclamation watersheds have been reported previously.
4
The natural sites for comparison are located NE of Prince Albert, Saskatchewan (53.91634° N, 104.69203° W; Elev. 579.27 m) (BOREAS coordinates). The mean annual air temperature is 0.4° C (1971-2000 Waskesiu normals), whereas, the mean total annual precipitation is 467.2 mm (1971-2000 Waskesiu normals).Previously, the Old Aspen site (OA) was simulated. The site is dominated by mature jack pine (Pinus banksiana Lamb) of height from 12 to 15 m, established in 1914. The understory consists of sparse green alder (Alnus crispa), and a predominantly lichen (Cladina spp.) ground cover. The canopy leaf area index is 1.7 m2 m-2. The soil below is a well drained sandy soil. It was divided into two layers of 0.45 and 0.6 m to minimize the effect of uncertainty associated with depth averaging of the soil moisture content. The frequency of soil moisture sensors are measured every six hours. Frequency of meteorological sensors are sampled every 5 sec, and outputs are every 30 min, year round.
5. RESULTS AND PROGRESS 5.1 Hydrometeorological studies For 2008, the surface energy balance, evapotranspiration and the water balance were measured for SBH, RJF and NRS sites, and analysis is ongoing. Historical analysis for SWSS (2005-2006) and SBH (2003-2007) has been completed and a manuscript describing the energy and water balance for SBH for the first three years (2003-2005) has been published in academic journal Hydrological Processes (Carey, 2008). Paul Moore (MSc student) has completed an MSc on the 2007 and 2008 growing season of RJF and a publication will be submitted in early 2009. Results presented here as a brief example of the data collected show a long-term comparison of ET from the research sites along with a select comparative day in 2008. In addition, a comparison of RJF with other natural stands from the BOREAS/BERMS experiments is demonstrated. It is important to note that this is only a brief overview of some of the experimental data generated in the measurement program. The long-term growing season ET values for the study site are presented in Table 1. As seen for SBH, there is considerable inter-annual variability due to differences in air temperature, humidity, available energy, vegetation and surface properties. For simple comparative purposes, Figure 2 contrasts the 2003 and 2005 ET SBH data with the 2004 data through a partial derivative analysis (see Carey (2008) for details) and establishes the controlling factors on inter-annual variability. 2004 was a dry year with limited summer rainfall and less ET than 2003 and 2005. However, the cause the different ET rates among the years change, which is highlighted by the terms on the x-axis of Figure 2. In 2003, ET was greater than 2004 largely because of atmospheric factors (a slight increase in radiation and a much dryer atmosphere that enhanced evaporative demand). In contrast, ET rates were greater in 2005 largely due to ability of the wet surface to evaporate water as atmospheric drivers (more radiation yet wetter air) largely offset each other. In summary, each year has its own unique water balance driven by both changing atmospheric and surface conditions. As part of this project, a similar analysis will be completed for all study years to establish the controlling factors that drive inter annual variability in ET.
5
Table 1. Growing season evapotranspiration (in mm) for the research watersheds. Year
SBH
SWSS
NRS
RJF
2003
246
2004
224
2005
283
316
2006
222
308
2007
271
209
255
2008
In progress
In Progress
In Progress
Figure 2. Total change in seasonal evapotranspiration due to changes in available energy, vapour pressure deficit, surface conductance and error. See Carey (2008) for details on the methodology. The difference in the surface energy water balance among the sites for a given year can be large, despite the fact that all sites exist within the same regional climate. For example, in 2007, ET was greatest from SBH, followed by RJF and lastly NRS. Part of this pattern can be explained by vegetation and the thickness of the soil layers. Figure 3 shows comparative ET rates for SBH, NRS and RJF on June 1, 2008. While the absolute magnitude of ET may not appear to be markedly different, there are distinct patterns that through the course of the season have important implications for the growing season water balance. The RJF site is the most mature of the reclaimed sites. ET is at a maximum in the morning and declines in the 6
afternoon, despite this being the period of maximum atmospheric demand. This offset is typical of boreal forest species as a method of reducing water loss during periods of maximum heating through the closure of stomatal openings. In contrast, SBH and NRS, which are dominated by shrub, grass and invasive species (such as sweet clover) have limited stomatal control mechanisms and more closely follow the pattern of atmospheric demand. In addition, despite having significantly greater radiation receipt at its surface (due to its southerly exposure), NRS has lower ET than SBH. The precise controls on water balance components are ongoing.
Figure 3. Half-hour evaporation for the JPF, SBH and NRS watershed on June 1, 2008. An important part of the research program is to compare results from the experimental watersheds to those in the undisturbed boreal ecosystem. Figure 4 shows a diagnostic relation between bulk surface resistance (the aggregated stomatal and surface resistance to the driving atmospheric evaporative forces) and the ration of latent heat to equilibrium latent heat (an indicator of how close evaporation is to its potential). When surface resistance is low under wet conditions, evaporation occurs at a rate equal or greater than equilibrium, yet as stomata close and the surface dries, actual evaporation declines in relation to its equilibrium value. RJP92 is the RJF described here, and the other sites are natural ones from the BOREAS/ BERMS program (see legend for site details). The RJF forest appears to have a similar evaporative behavior to the older reclaimed natural sites, which is a promising indicator considering the soils are quite different than those in a natural environment. At the present time, for the RJF (our oldest reclaimed research watershed studied in this program), it does not appear to have any unique characteristics from reclaimed and older jack pine forests at natural sites.
7
Figure 4. The relation between bulk surface resistance and the ratio of latent heat to equilibrium latent heat. RJP92 is the RJF research watershed, OJP is an old jack pine site (approx. 70 years old), HJP75 and HJP94 are re-grown jack pine stands that were harvested in 1975 and 1994, respectively. OJP, HJP75 and HJP 94 are BOREAS/BERMS research sites.
5.2 Hydrological modeling The simulation and the hydrological performance of both the reclaimed SWSS and the natural boreal OJP sites are provided below. 5.2.1 The reclaimed SWSS site The GSDW model was calibrated and validated to simulate the various hydrological processes in the reclaimed SWSS site using data from years 2005 and 2006. The observed and predicted soil moisture contents in the 45 cm thick upper till/secondary cover material and the 100 cm thick lower tailings sands layer of the validation year 2005 are shown in Figure 5. It is important to notice that the observed values outside the growing season is not reliable during the soil is frozen. Therefore, the model is assessed based on the predicted values within the growing season. Also there is a weaker match between the observed and the predicted soil moisture in the tailing sand layer. This weaker match could be attributed to the nature of the model to be a lumped model that produces depth-averaged soil moisture content. On top of this the spatial variability of the in-situ soil moisture measurements adds to the uncertainty of measuring soil moisture in the tailing sand layer. The good match between the upper till layer 8
as well as the predicted actual evapotranspiration (Figure 6), it can be concluded that the GSDW model performance is quite good. The cumulative observed seasonal actual evapotranspiration using the eddy covariance technique (EC) was 319 mm, whereas the predicted value (predicted AET was 312 mm. The predicted AET includes transpiration from vegetation (predicted AET net ), which was around 303 mm and evaporation of the intercepted water which was 9 mm. 5.2.2 The natural OJP site The GSDW model was calibrated and validated to simulate the various hydrological processes in the natural old jack pine (OJP) site using a data from years 2001 and 2002. The observed and predicted soil moisture contents in the 45 cm thick upper sandy soil cover and the 60 cm thick lower sandy soil layer of the validation year 2001 are shown in Figure 7. It is important to notice that the observed values outside the growing season is not reliable during the soil is frozen. The model is assessed based on the predicted values within the growing season. In general, the GSDW model shows a better match between the observed and the predicted soil moisture in the OJP site compared to the SWSS site. This weaker match in the SWSS site compared to the OJP site could be endorsed to the fact the OJP canopy is well established. Figure 8 shows a good match between the predicted actual evapotranspiration and observed evapotranspiration. The cumulative observed seasonal actual evapotranspiration using the eddy covariance technique (EC) was 282 mm, whereas the predicted value (predicted AET was 274 mm. The predicted AET includes transpiration from vegetation (predicted AET net ), which was around 252 mm and evaporation of the intercepted water which was 30 mm.
9
60 50
(a)
120
40
100
30
80
Simulated
60
20
Observed
40
10
20 0
0 24
48
72
96
0 12
4 14
8 16
2 19
6 21
0 24
4 26
8 28
2 31
6 33
0 36
250
60
Soil Moisture (mm)
(b)
50
200
40 150 30 100 20 50
10
0
Soil Moisture (mm)
0
200 180 160 140 120 100 80 60 40 20 0 0
0 24
48
72
96
0 12
4 14
8 16
2 19
6 21
0 24
4 26
8 28
2 31
6 33
0 36
60
(c)
50 40 30 20 10 0
24
48
72
96
0 12
4 14
8 16
2 19
6 21
0 24
4 26
8 28
2 31
6 33
0 36
Soil Moisture (mm)
300 250
60 50
(d)
200
40
150
30
100
20
50
10
0 0
Precipitation (mm)
0
Precipitation (mm)
140
Precipitation (mm)
Soil Moisture (mm)
160
Precipitation (mm)
180
0 24
48
72
96
0 12
4 14
8 16
2 19
6 21
0 24
4 26
8 28
2 31
6 33
0 36
Time (days)
Fig. 5 Simulated and observed moisture in the SWSS watershed; (a) Till layer calibration (2006); (b) Tailings sand layer calibration (2006); (c) Till layer validation (2005); (d) Tailings sand layer validation (2005).
10
400 350 Evapotranspiration (mm)
Predicted AETnet Predicted AET
300
PET
250
Observed AET
200 150 100 50 0 1
27
53
79 105 131 157 183 209 235 261 287 313 339 365 Time (days)
Fig.6 Observed and predicted evapotranspiration (mm) in the natural SWSS site. 100 precepitation
Soil Moisture (mm)
60
Simulated Observed
50
90 80 70 60
40
50 30
40
20
30 20
10
Precipitation (mm)
70
10
0
0 1
25
49
73
97
1 12
5 14
9 16
3 19
7 21
1 24
5 26
9 28
3 31
7 33
1 36
25
49
73
97
1 12
5 14
9 16
3 19
7 21
1 24
5 26
9 28
3 31
7 33
1 36
80
Soil Moisture (mm)
70 60 50 40 30 20 10 0 1
Fig. 7 Simulated and observed moisture in the OJP watershed for validation year 2001 (a) Layer (a) Layer No. 1 (450 mm); (b) Layer No. 2 (600 mm).
11
700
Evapotranspiration (mm)
600
Predicted AETnet Predicted AET
500
PET Observed AET
400 300 200 100 0 1
27
53
79 105 131 157 183 209 235 261 287 313 339 365 Time (days)
Fig. 8 Observed and predicted evapotranspiration (mm) in the natural OJP site.
5.3 The long-term performance of the sites A methodology for assessing the hydrological performance of the reconstructed covers was adopted by Elshorbagy and Barbour (2007) to assess the risk of failure of proposed reclaimed sites under various climatic scenarios. Elshorbagy and Barbour (2007) used a system dynamics watershed model (SDW), along with the available historical 50 years meteorological records to estimate the maximum soil moisture deficit that the soil cover can sustain during the growing season. Frequency curves for maximum annual moisture deficit are used to assess the probability of each cover to provide the desired threshold of moisture demand. The same procedure was implemented in this study. Frequency curves of AET and moisture deficit (Dm) were constructed for both the SWSS and the natural OJP sites (Figures 9 and 10). Figure 9 shows that the OJP natural site has higher ability of storing and releasing water for vegetation. On average (50% probability), the SWSS site stores around 61 mm of water during the rainy days and release them during the drier days. The previous value goes up in the OJP site to 72 mm of water at the same probability threshold. Similarly, SWSS allows for 278 mm of annual evapotranspiration, whereas, OJP may provide as 316 mm of annual evapotranspiration at 50 % probability based on the current vegetation maturity. The OJP site shows a greater flexibility for providing more evapotranspiration if needed. It is expected that that the dynamics of moisture movement and evapotranspiration will continue to develop.
12
0.8 Old JacK Pine SWSS 0.6
0.4
0.2
0 0
25
50
75
100
125
150
175
200
225
250
Maximum soil Moisture Deficit (mm)
Figure 9. Frequency curve of maximum moisture deficit of SWSS and OJP sites. 1
Non-exceedance probability
Non-exceedance probability
1
0.8
0.6 OJP SWSS
0.4
0.2
0 150 175 200 225 250 275 300 325 350 375 400 425 450 475 500 Evapotranspiration (mm)
Figure 10. Frequency curve of actual evapotranspiration in both sites. 13
6. WORK TO BE COMPLETED IN YEAR 3 (2009) The following tasks are planned to be completed within year 2 (2008): 6.1 Hydrometeorological study on the reclaimed SBH site, which will be the seventh year (DY6) of data collection on this site; 6.2 Hydrometeorological study on the newly reclaimed Suncor (NRS) site, which will be the third year (DY3) of data collection on this site; 6.3 Hydrometeorological study on the reclaimed 15-year old jack pine forest (RJF), which will be the third year (DY3) of data collection on this site; 6.4 Calibration and application of the GSDW model for the reclaimed NRS, RJF, and the LFH sites; 6.5 Calibration of the GSDW model for the OBS natural site; and 6.6 Conduct the probabilistic and risk analysis for the reclaimed NRS, RJF, and LFH, and the natural OBS sites.
7. THE RESEARCH TEAM The following personnel have been involved in this study: University of Saskatchewan: • Amin Elshorbagy (Principal investigator); • Ibrahim El-Baroudy (Research Engineer); part-time involvement in some of the GSDW preparation and documentation, and directing the graduate students; • Lakshmi Bachu (M.Sc. student completed in June 2008); was working full-time on adapting the SDW model to the SBH site and the OA natural site, and also conducting some of the probabilistic analysis; and • Nader Keshta (Ph.D. student); working full-time on developing a generic form of the SDW (GSDW) model, which is, and will be, used for modeling the remaining reclaimed and natural sites. Carleton University: • Sean Carey (Co-investigator); • Michael Treberg (Research Technician); part-time involvement in instrumentation design, tower set up, data QA/QC. • Paul Moore (M.Sc. student); working full time on the micrometeorology of the RJF site. • Sean Goodbrand (M.Sc student); working full time on the micrometeorology of the NRS site.
REFERENCES Carey, S.K. 2008. Growing Season Energy and Water Exchange from an Oil sands Overburden Reclamation Soil Cover, Fort McMurray, Alberta, Canada. Hydrological Processes, 22, 2847-2857. Dingman, S.L., 2002. “Physical hydrology/ second edition.” Prentice Hall, Upper Saddle River, New Jersey. 14
Elshorbagy, A., Jutla, A. and Kells, J. 2007. Simulation of the Hydrological Processes on Reconstructed Watersheds Using System Dynamics. Hydrological Sciences Journal, 52(3): 538-562. Elshorbagy, A. and Barbour S. L. 2007. A Probabilistic Approach for Design and Hydrologic Performance Assessment of Reconstructed Watersheds. Journal of Geotechnical & Geoenvironmental Engineering, ASCE, 133(9): 1110-1118. Elshorbagy, a., Julta, a., Barbour, L., and Kells, J. 2005. System dynamics approach to assess the sustainability of reclamation of distributed watersheds. Canadian Journal of civil engineering, (32): 144-158. Leskiw, L. A. 2004. Land capability classification for forest ecosystems in the oil sands, Paragon Soil and Environmental Consulting Inc., Alberta, Canada. McCaughey, J.H., Barr, A., Black, T.A., Goodison, B., Hogg, E.H., Stewart, R.B., Amiro, B., Price, D.T., Stolle, N., Chen, J., and Gower, S.T., 2000. The Boreal Ecosystem Research and Monitoring Sites (BERMS) initiative: scientific accomplishments. In The Role of Boreal Forests and Forestry in the Global Carbon Budget. Abstracts. 8-12 May 2000, Edmonton, Alta. Edited by M.J. Apps and J. Marsden. Canadian Forest Service, Northern Forestry Centre, Edmonton, Alta. P. 116. Sellers, P. et al. 1995. The Boreal Ecosystem-Atmosphere Study (BOREAS): an overview and early results from the 1994 field year, Bull. Am. Meteorol. Soc., 76, 1549-77.
15