www.searchmesh.net
Title:
Predictive modelling of intertidal and subtidal seaweeds from rock substrata.
Author(s):
Vona Méléder, Eric De Oliveira, Jacques Populus, Brigitte Guillaumont
Document owner:
Jacques Populus (
[email protected])
Reviewed by: Workgroup: MESH action:
Action 4
Version:
1.1
Date published:
15/01/2007
File name:
WE_Ifremer_predictive_modelling_seaweeds.pdf English
Language: Number of pages: Summary:
The aim of this study is to predict distribution of species and habitat types using ‘marine landscapes’, defined by a combination of environmental parameters. Proposed methodologies are expected to produce rules to understand species distribution according to environmental parameters and hence, predictive maps. Two methodologies are used: the fuzzy logic to predict intertidal seaweeds and multilinear regression to predict subtidal ones.
Reference/citation: Keywords:
Bookmarks: Related information:
Seaweeds, regression.
predictive
model,
fuzzy
logic,
multilinear
Change history Version:
Date:
Change:
1.1
15/01/07
Original submission
4
Predictive modelling of intertidal and subtidal seaweeds from rock substrata
January 2007
5
Introduction Seaweeds are an important component of coastal primary production. For example, kelp beds are among the most productive ranging from 400 to 1900 g C.m-2.y-1 (see ref. in Sivertsen 1997). Seaweeds provide essential habitat and food for hundreds of species of marine invertebrates and fish living in temperate nearshore waters. In terms of biodiversity their ecological importance needs to be assessed, as they are potentially reactive to environmental quality changes. There is also a steady demand for raw material by the seaweed industry. Although they are not priority habitats on the Ospar Convention list, kelp forests and fucoids have been long recognised as key habitats by the Habitat Directive and more recently as potential benthic indicators by the Water Framework Directive. Along with knowledge about the resident biomass, the percentage of cover and the description of dominant species are of interest in understanding the long-term trends of these habitats. It is noteworthy that groups of divers around Brittany have consistently reported an upward trend in the lower limit of the seaweed's extent.
Traditionally, marine ecologists have used the direct sampling method to characterise shallow and intertidal water marine habitats. However, this method is neither time nor cost effective for vast expanses. Remote sensing tools such as aerial photography, airborne and satellite imagery are appropriate for surveying and classifying marine habitats in the tidal zone (Guillaumont et al., 1993 ; Bajjouk et al., 1996 ; Guillaumont et al., 1997 ; Meleder et al., 2003 ; Combe et al., 2005). Acoustic methods are suitable to remotely sample seafloor texture and depth in waters as deep as 200 metres (Brown et al., 2002). Usually some combination of environmental parameters, defining ‘marine landscapes’, is assumed to control the distribution of species and habitat types (Roff & Taylor 2000). Therefore, the key parameters used could be grouped into three themes (Stevens & Connolly 2004), those concerned with, 1/ the nature of the substrate (depth, sediment type, sediment constituents), 2/ the nature of the water body overlying the substrate (temperature, pH, Salinity, turbidity) and 3/ the influence of the local environment (exposure to waves, current velocity, proximity to major river entrances, nutrient inputs). Since the proposed approach by Roff & Taylor in 2000, there are few examples of marine habitat classification in a spatial context based on physical factors (Zacharias et al., 1999 ; Kelly et al., 2001 ; Zacharias & Roff 2001 ; Brinkman et al., 2002 ; Stevens & Connolly 2004 ; Greve & Krause-Jensen 2005 ; De Oliveira et al., 2007). Applied to a marine context, these methodologies are expected to produce rules to understand species distribution according to environmental parameters and hence, predictive maps. Six seaweed belts were targeted in these studies: Fucus spiralis, Ascophyllum nodosum, F. vesiculosus, F. serratus, Laminaria digitata and L. hyperborea. Description of seaweeds and their habitats are found on MarLIN (The Marine Life Information Network for Britain and Ireland) site (http://www.marlin.ac.uk/index.htm).
6
1. Intertidal seaweeds This worked example focuses on fixed seaweed species such as Fucus sp. in the tidal zone of the Ile de Bréhat, located in the Channel Brittany coasts. The driving physical parameters taken into account are the substratum, fixed seaweed needing rocky substratum, and the energy with exposure to air and exposure to waves, because seaweed distribution is conditioned by the ecological properties and preferenda of each species. Higher and lower limits of the dominant seaweed belts, previously dGPS-recorded in the field, are used for building rule-based decisions; then functions are assigned to the membership values. Therefore modelling with fuzzy logic indirectly leads to a membership value of presence for each targeted species.
1.1 Environmental parameters Substratum – In the intertidal domain, direct detection of plant cover is possible thanks to the infrared capability of digital cameras and in particular those onboard remote sensing satellites. For this study, the Vegetation Cover Index (Guillaumont et al. 1993) is used, ranging from 0 to 100 % of vegetation cover.
Flooding frequency – Seaweeds differently suffer from stress when they are out of the water, so flooding frequency is a key parameter to account for their presence. Flooding frequency at a given elevation is driven by the tidal regime. Using a tide model, water levels is translated into annual percentages of immersion. Seaweed distribution with respect to this parameter is then comparable across the different sites regardless of their varying tidal amplitude, all the more so in Brittany where the tidal range varies from approximately 6 to 13 metres. Exposure to waves – While a certain amount of turbulence seems necessary for seaweeds to thrive, a high level of exposure tends to prevent the fixation of juveniles. Different species may accept the same time of exposure but may not stand the same level of exposure, as is the case for Ascophyllum nodosum and Fucus vesiculosus, for instance. In this study, we will focus on exposure to waves using weighted average of significant height, µhs.
1.2. Seaweed in situ sampling data Seaweed belts were surveyed in the field by following their upper/lower limits and measuring their heights with high precision dGPS in RTK mode. Previously established contours of seaweed cover (Callens, 1994) were also considered, in spite of their age and the fact that they only distinguished Ascophyllum nodosum from other fucoids.
7
1.3 Estimation of distribution laws Distribution laws for each species are obtained for the percentage of immersion. Distribution rules for Ascophyllum nodosum and the two other species, Fucus vesiculosus and Fucus serratus, are established for wave exposure, with respect to the significant height in extreme conditions, spring time amplitude and high water level.
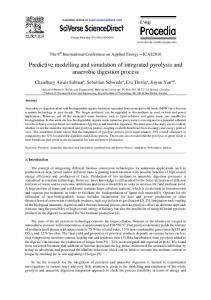
1.4 From species map to holistic map Modelling the presence probability of species is based on the fuzzy logic concept (Zadeh, 1965 ; Zadeh, 1976), derived from the Boolean theory. The first processing step in fuzzy logic is to model each parameter by a membership function which assigns the degree of membership of an identified state. To classify ‘marine landscape’ a segmentation phase allows obtaining a set of homogeneous segments according to the three above-mentioned environmental parameters. Then the distribution laws estimated from field sampling were implemented and a membership value was calculated for each species, for each Callen’s polygon. Finally, predictive maps of membership value per species were combined to obtain a holistic map taking into account the following rules: a) a threshold of degree of presence set to 0.2, from which a species is considered to be significantly present, b) a second threshold set to 0.5 to maintain co-dominance where several species are present according to (co-dominance: this is the maximum discrepancy between the dominant species and any other one). The predictive map of membership value of Ascophyllum nodosum, Fucus vesiculosus and Fucus serratus and the holistic map are shown in respectively Figure 1 and 2.
8
a) Predictive map of membership value of Ascophyllum nodosum.
b) Predictive map of membership value of Fucus vesiculosus.
c) Predictive map of membership value of Fucus serratus.
9
Figure 1 The predictive map of membership value of a) Ascophyllum nodosum, b) Fucus vesiculosus and c) Fucus serratus
Figure 2 Holistic map of seaweed. Fspir: Fucus spiralis; Asco: Ascophyllum nodosum; Fvesi: Fucus vesiculosus; Fserra: Fucus serratus; Lamin: Laminaria digitata. Order is conserved only for the mixed polygon of 2 species.
2. Subtidal seaweeds This worked example focuses on kelp forests of northern and southern Brittany coasts. Physical parameters taken into account are (1) the rocky substratum as intertidal fixed seaweeds, (2) the nature of the water body immerging kelps forests throughout the temperature and the turbidity, and (3) the energy with currents velocity. The probability of presence of kelp forests are calculated from acoustic detection (single-beam) of seaweeds using multi-linear regression, crossing turbidity, temperature and energy.
2.1 Environmental parameters Substratum – Digital map “G” (seabed nature) from the French Hydrologic and Oceanographic Marine Service (SHOM) with a resolution of 1/50 000.
Bathymetry – Raster from the Channel French coast to the Gironde estuary, with a resolution of 150 m.
10
Turbidity – This variable is expressed via the Kpar coefficient (extinction cœfficient of photosynthetical active radiations). This coefficient is calculated from SeaWiFS radiance (Gohin et al. 2005) with a resolution of 1100 m. 52 images are available, which are weekly mean from 1998 to 2004.
Temperature – Are expressed by the Sea Surface Temperature (SST) from AVHRR radiance. As Kpar, images are weekly mean throughout the last 20 years with a resolution of 1100 m.
Tidal currents – Currents maximum velocity (Vmax) at a resolution of 300 m are used in this study, resulting from MARS 3D hydrodynamic model for a mean spring tide simulation.
2.2 Seaweed in situ sampling data and estimation of distribution laws Presence of kelp forests are detected using acoustic technique (single-beam sounder SIMRAD EK60) in 6 sites from the north to the south of Brittany coasts. Probability of presence are calculated for depth classes from 5 to 25 m. These distribution laws along depth are fitted using piecewise regression (3 segments) to estimate two breakpoints namely Z1, corresponding to the beginning of the decrease in probability laws and Z2, corresponding to the kelp forests disappearance and also the slope between these breakpoints (slope2).
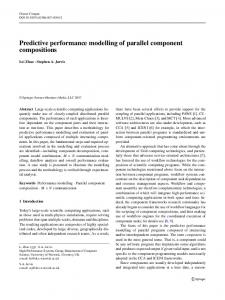
2.3 Map of kelp forest presence probability Z1, Z2 and slope2 are predicted using multi-linear regressions crossing turbidity (Kpar), temperature (SST) and energy (Vmax). Probabilities of presence are calculated using Z2 and slope2 for bathymetry ranging from Z1 to Z2. Using ModelBuilder of ArcView, multi-linear regression are applied using this model : Z1 = a * Kpar + b * SST + c * Vmax + d Z2 = a’ * Kpar + b’ * SST + c’ * Vmax + d’ slope2 = a’’ * Kpar + b’’ * SST + c’’ * Vmax + d’’ Predict % = slope2 * (z – Z2)
for Z1 > z > Z2
11
Resulting probabilities of kelp forest presence vary between 99.74 and 0.02 % along depth from Z1 to Z2 (Figure 3). Both depths reach their maximum when the water body is not too turbid and also not too cold and the energy is high (maximum values are –18 and –23 m respectively for Z1 and Z2). Conversely, these depths reach a minimum when water is too turbid and too cold, and energy is low (lowest values are –8 and –14 m respectively for Z1 and Z2).
Figure 3 Map of predicted probabilities of kelp forest presence from Z1 to Z2 on the Brittany coasts. Enclosed map shows a zoom with isobaths ranging from 0 to –60m.
12
References Bajjouk, T., B. Guillaumont & J. Populus (1996). Application of airborne imaging spectrometry system data to intertidal seaweed classification and mapping. Hydrobiologia. 327: 463-471. Brinkman, A. G., N. Dankers & M. van Stralen (2002). An analysis of mussel bed habitats in the Dutch Wadden Sea. Helgoland Marine Research. 56(1): 59-75. Brown, C. J., K. M. Cooper, W. J. Meadows, D. S. Limpenny & H. L. Rees (2002). Smallscale mapping of sea-bed assemblages in the eastern English Channel using sidescan sonar and remote sampling techniques. Estuarine Coastal and Shelf Science. 54(2): 263278. Callens, L. (1994). Mise au point d'une procédure de cartographie des stocks annuellement exploitables en fucales. Thèse de Doctorat. Rennes, Ecole Nationale d'Agronomie de Rennes. Combe, J. P., P. Launeau, V. Carrere, D. Despan, V. Meleder, L. Barille & C. Sotin (2005). Mapping microphytobenthos biomass by non-linear inversion of visible-infrared hyperspectral images. Remote Sensing of Environment. 98(4): 371-387. De Oliveira, E., J. Populus & B. Guillaumont (2007). Predictive modelling of coastal habitats using remote sensing data and fuzzy logic. EARSeL eProceedings. (sous presse). Gohin, F., S. Loyer, M. Lunven, C. Labry, J. M. Froidefond, D. Delmas, M. Huret & A. Herbland (2005). Satellite-derived parameters for biological modelling in coastal waters: Illustration over the eastern continental shelf of the Bay of Biscay. Remote Sensing of Environment. 95(1): 29-46. Greve, T. M. & D. Krause-Jensen (2005). Predictive modelling of eelgrass (Zostera marina) depth limits. Marine Biology. 146(5): 849-858. Guillaumont, B., T. Bajjouk & P. Talec (1997). Seaweed and remote sensing: a critical review of sensors and data processing. Progress in Phycological Research. F. E. Round & D. J. Chapman, Biopress. 12: 213-282. Guillaumont, B., L. Callens & P. Dion (1993). Spatial-Distribution and Quantification of Fucus Species and Ascophyllum-Nodosum Beds in Intertidal Zones Using Spot Imagery. Hydrobiologia. 261: 297-305. Kelly, N. M., M. Fonseca & P. Whitfield (2001). Predictive mapping for management and conservation of seagrass beds in North Carolina. Aquatic Conservation-Marine and Freshwater Ecosystems. 11(6): 437-451. Meleder, V., P. Launeau, L. Barille & Y. Rince (2003). Microphytobenthos assemblage mapping by spatial visible-infrared remote sensing in a shellfish ecosystem. Comptes Rendus Biologies. 326(4): 377-389. Roff, J. C. & M. E. Taylor (2000). National frameworks for marine conservation - A hierarchical geophysical approach. Aquatic Conservation-Marine and Freshwater Ecosystems. 10(3): 209-223. Sivertsen, K. (1997). Geographic and environmental factors affecting the distribution of kelp beds and barren grounds and changes in biota associated with kelp reduction at sites along the Norwegian coast. Canadian Journal of Fisheries and Aquatic Sciences. 54(12): 2872-2887. Stevens, T. & R. M. Connolly (2004). Testing the utility of abiotic surrogates for marine habitat mapping at scales relevant to management. Biological Conservation. 119(3): 351362. Zacharias, M. A., M. C. Morris & D. E. Howes (1999). Large scale characterization of intertidal communities using a predictive model. Journal of Experimental Marine Biology and Ecology. 239(2): 223-242.
13
Zacharias, M. A. & J. C. Roff (2001). Explanations of patterns of intertidal diversity at regional scales. Journal of Biogeography. 28(4): 471-483. Zadeh, L. (1965). Fuzzy sets. Information Control. 8: 338-353. Zadeh, L. (1976). A fuzzy-algorithmic approach to the definition of complex or imprecise concepts. International Journal of Man-Machine Studies. 8: 249-291.
14