Therapeutic Monitoring
Predictive Performance of a Vancomycin–Aminoglycoside Population Model Paul M Beringer, Annie Wong-Beringer, and Jay P Rho
OBJECTIVE: To evaluate the Wragge–Cooper method of predicting vancomycin serum concentrations utilizing knowledge of aminoglycoside pharmacokinetic parameters in general medicine and intensive care unit populations, and to develop a revised model if necessary. DESIGN: This study consists of two phases evaluating 50 adults receiving concurrent vancomycin and aminoglycoside therapy. Patients were identified by a retrospective review of medical records. Bayesian analysis of measured serum aminoglycoside and vancomycin concentrations was performed to determine the individualized pharmacokinetic parameters. Phase I of the study tested the predictive performance of a published model incorporating aminoglycoside elimination (Wragge–Cooper) in 25 patients (group 1), and a revised model was developed. Phase II determined the predictive performance of the revised model (revised) and its performance relative to the Wragge–Cooper model and a traditional model incorporating estimated creatinine clearance (traditional) in an additional 25 patients (group 2). SETTING: Two tertiary care university teaching hospitals. MAIN OUTCOME MEASURES: The predictive performance of the models was determined by comparing predicted with measured vancomycin serum concentrations. Bias and precision were evaluated by calculating the mean prediction error (ME) and mean absolute error (MAE), respectively. Linear regression was performed to determine relationships between parameters. RESULTS: The Wragge–Cooper model consistently underpredicts vancomycin serum concentrations in general medicine and intensive care unit populations (ME = –5.18, MAE = 6.63). Relative predictive performance analysis indicates no significant difference in
Paul M Beringer PharmD BCPS, Assistant Professor of Clinical Pharmacy, Department of Clinical Pharmacy, School of Pharmacy, University of Southern California, Los Angeles, CA Annie Wong-Beringer PharmD, Associate Professor of Pharmacy Practice, College of Pharmacy, Western University of Health Sciences, Pomona, CA Jay P Rho PharmD BCPS FASHP, Associate Professor of Clinical Pharmacy, Department of Clinical Pharmacy, School of Pharmacy, University of Southern California Reprints: Paul M Beringer PharmD BCPS, Department of Clinical Pharmacy, School of Pharmacy, University of Southern California, 1985 Zonal Ave., Los Angeles, CA 90033, FAX 213/342-8638
176
■
The Annals of Pharmacotherapy
■
bias or precision between the traditional and Wragge–Cooper models (∆ME 1.17, ∆MAE –0.80). Regression analysis of individualized aminoglycoside and vancomycin elimination derived from patients in group 1 reveals the following relationship: vancomycin k10 (1/h) = 0.081 + 1.037ke,amg, r = 0.73. The revised model is significantly less biased and more precise compared with the traditional model (∆ME –4.48; ∆MAE 1.22), and is significantly less biased (∆ME 4.29) but no more precise than the Wragge–Cooper model (∆MAE –0.58), using patients from group 2. CONCLUSIONS: The revised model is an accurate method of predicting vancomycin serum concentrations in both general medicine and intensive care unit populations. Use of this model enables individualization of vancomycin dosage in patients receiving concurrent aminoglycoside therapy and minimizes vancomycin serum concentration monitoring. KEY WORDS: vancomycin, concentrations, aminoglycosides. Ann Pharmacother 1998;32:176-81.
SERUM VANCOMYCIN CONCENTRATION MONITORING has been used as a means of reducing the risk for development of nephrotoxicity and ototoxicity. These toxicities were first described shortly after the drug was introduced in the late 1950s. Evaluations,1-3 however, indicate that the risk is minimal, presumably due to purification of the commercial preparation. Thus, the traditional practice of adjusting doses on the basis of measured serum concentrations has been questioned.4-7 Vancomycin and aminoglycosides are frequently prescribed for the treatment of serious bacterial infections. Since both agents are cleared from the body primarily by glomerular filtration, a number of nomograms have been developed based on estimation of the patient’s creatinine clearance (Clcr) to guide the clinician to an appropriate dosage regimen. In clinical practice, it is relatively common for patients to receive vancomycin and an aminoglycoside either concurrently or separately during their treat-
1998 February, Volume 32
Downloaded from aop.sagepub.com by guest on October 11, 2013
ment course. It has been suggested that if a good correlation between the pharmacokinetic parameters of the two drugs exists, the parameters of one could be used to predict those of the other.8 This method would enable determination of the optimal dosage without the need to obtain serum concentrations for both drugs. Wragge and Cooper8 performed a retrospective analysis of 47 patients receiving the aminoglycoside/vancomycin combination and found that the correlation between the elimination rate constants (ke) of the aminoglycoside and vancomycin was superior to the correlation between the ke of vancomycin and Clcr in all patients studied. The predictive performance of their models has not previously been determined. Predictive performance analysis is used to determine the accuracy and precision of a model. Relative predictive performance is used to compare the accuracy and precision of two or more models. The objectives of this study are to determine the predictive performance and relative performance of the Wragge–Cooper models in predicting vancomycin serum concentrations, and to further evaluate the relationship between aminoglycoside and vancomycin pharmacokinetic parameters, as well as to develop a revised model if necessary.
DATA ANALYSIS
For each patient group, predicted vancomycin serum concentrations were determined by using the following relationships: Wragge–Cooper General medicine: ke,van (1/h) = 0.0129 + 0.3629ke,amg Vd (L) = 0.8 L/kg Intensive care unit: ke,van (1/h) = 0.0133 + 0.4280ke,amg Vd (L) = 0.8 L/kg Traditional k10 (1/h) = 0.002 + 0.005Clcr k12 (1/h) = 2.149 k21 (1/h) = 0.874 V1 (L) = 0.145 Revised k10 (1/h) = 0.081 + 1.037ke,amg k12 (1/h) = 2.364 k21 (1/h) = 0.793 V1 (L) = 0.173 where ke,van and k10 are estimates of vancomycin elimination, ke,amg is the fitted aminoglycoside elimination rate constant, k12 and k21 are the intercompartmental rate constants, Vd (1-compartment volume of distribution) and V1 (volume of compartment 1 in a 2-compartment model) are estimates of vancomycin volume of distribution, and Clcr is the predicted creatinine clearance in mL/min/1.73 m2.
Methods This study was conducted at two university teaching hospitals: University of Southern California University Hospital and University of California, Los Angeles, Medical Center. The predictability of the general medicine and intensive care unit models described by Wragge–Cooper was tested in 50 consecutive adults who received vancomycin and an aminoglycoside concurrently or separately within a 6-week period during their hospital stay. To be included in the data analysis, patients had to have at minimum a measured peak and trough serum concentrations for both drugs. Patients with end-stage renal disease or unstable renal function between measurement of vancomycin and aminoglycoside concentrations were excluded from the analysis. Unstable renal function was defined as a change in serum creatinine concentration of greater than 0.5 mg/dL in patients with serum creatinine concentrations less than 2 mg/dL or 20% if the patient’s serum creatinine concentration was 2 mg/dL or greater.9 Dialysis dependence was the criterion for end-stage renal disease.
VANCOMYCIN AND AMINOGLYCOSIDE CONCENTRATIONS
Peak vancomycin concentrations were obtained within 1–2 hours after a 1-hour infusion and trough concentrations were obtained within 1 hour of the next scheduled administration time. Blood samples for determination of peak aminoglycoside concentrations were obtained within 30 minutes after a 30-minute infusion and trough concentrations were obtained within 30 minutes of the next scheduled administration time. The exact administration and sampling times were determined from the nursing medication administration record and the laboratory data sheets. Serum samples were analyzed for vancomycin and aminoglycoside concentrations by using fluorescence polarization immunoassay technique (TDx, Abbott Laboratories, Chicago, IL) at one institution and enzyme immunoassay (ACA, Dupont, Wilmington, DE) at the other. The accuracy and precision of the two methods were similar. PHARMACOKINETIC ANALYSIS
PHASE I
The study was conducted in two phases. In phase I, serum concentrations of vancomycin and aminoglycoside were collected over a 12month period from 25 patients (group 1) receiving the two drugs during their hospital stay. The performance of the Wragge–Cooper models was evaluated by comparing the predicted with measured vancomycin serum concentrations. In addition, the performance of the Wragge–Cooper models relative to a traditional population approach using Clcr (traditional) was evaluated. PHASE II
Based on performance of the Wragge–Cooper models in phase I of the study, a revised model (revised) was subsequently developed by using linear regression analysis of the Bayesian fitted vancomycin and aminoglycoside parameters. The predictability of the revised model was validated with data obtained from an additional 25 patients (group 2) in phase II of the study. The predictive performance of the Wragge–Cooper, traditional, and revised models was assessed individually by comparing the predicted and measured serum vancomycin concentrations. Performance of the revised model relative to the Wragge–Cooper and traditional models was also evaluated.
Bayesian analysis of measured vancomycin and aminoglycoside serum concentrations (MB; USC*PACK PC Collection, University of Southern California) was performed to determine the individualized pharmacokinetic parameters. This program, which has been described previously, uses the entire dosing, serum concentration, and estimated Clcr histories.10,11 A two-compartment model10 was used for analysis of vancomycin concentrations and a one-compartment model for analysis of aminoglycoside concentrations.11 Three different population models were used when fitting the aminoglycoside concentrations for critically ill patients (Vc [volume of central compartment] 0.368, kslope [renal elimination constant] 0.003, kinter [nonrenal elimination constant] 0.007), general medicine (Vc 0.25, kslope 0.003, kinter 0.007), and young otherwise healthy patients (Vc 0.22, kslope 0.006, kinter 0.01) due to wide variance in the Vd observed between these populations. Clcr was estimated on the basis of the patient’s height, weight, and creatinine concentration in serum.12 STATISTICAL ANALYSIS
The relationship between vancomycin and aminoglycoside parameters was determined by simple linear regression. Prediction error analysis was performed by using the methods described by Sheiner and Beal.13 Bias and precision were evaluated by determination of the mean prediction er-
The Annals of Pharmacotherapy
■
1998 February, Volume 32
■
177
ror (ME) and mean absolute error (MAE), respectively. A positive value for the ME indicates that the predictive model overpredicts the actual vancomycin clearance, and a negative value indicates underprediction. The prediction method with the ME closest to 0 is the least biased. The smaller the MAE, the greater the precision of the prediction method. Relative performance was assessed by the differences in values for ME and MAE and their 95% CIs. If the 95% CIs for the relative performance criteria did not include zero, the predictions were considered to be different with statistical significance. In addition, the mean predicted and measured vancomycin concentrations with each method were compared by using a paired t-test. A p value less than 0.05 was considered statistically significant.
Results PHASE I
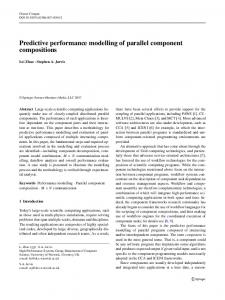
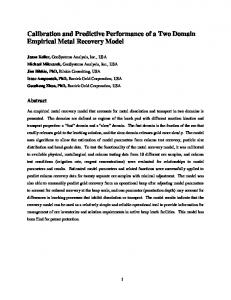
Patient demographics and Clcr for group 1 are summarized in Table 1. The Wragge–Cooper method consistently underpredicted vancomycin serum concentrations in our patients (Figure 1). Evaluation of the relative performance (Table 2) revealed no difference in bias or precision (Figure 2) when comparing the Wragge–Cooper with the traditional model. As indicated in Table 3, the vancomycin concentrations predicted by both the Wragge–Cooper and traditional models are significantly different from the measured values. Considering the consistent underprediction of the Wragge–Cooper models, linear regression analysis was performed to reevaluate the relationship between vancomycin and aminoglycoside pharmacokinetic parameters in group 1. A significant correlation was observed between vancomycin elimination and aminoglycoside elimination (Figure 3). A poor correlation was observed between the Vd of the two drugs (r = 0.49).
Table 2. Relative Predictive Performance of Traditional, Wragge–Cooper, and Revised Models ∆MEa
∆MAEb
Group 1 W-C vs. traditional 95% CI
1.17 (–0.48 to 2.82)
–0.80 (–2.10 to 0.50)
Group 2 Revised vs. traditional 95% CI Revised vs. W-C 95% CI
4.48c (3.46 to 5.50) 4.29c (3.60 to 4.98)
–1.22c (–2.31 to 0.13) –0.58 (–1.51 to 0.35)
POPULATION
MAE = mean absolute error; ME = mean prediction error; W-C = Wragge– Cooper model. a Change in mean prediction error (mg/L). bChange in mean absolute error (mg/L). c Significant difference in predictive performance (95% CI excludes 0).
Figure 1. Mean prediction error (ME) of serum vancomycin concentrations. Trad #1 = traditional model in group 1, W-C #1 = Wragge–Cooper model in group 1, Trad #2 = traditional model in group 2, W-C #2 = Wragge–Cooper model in group 2, and Revised = revised model in group 2.
PHASE II
Patient demographics and Clcr for group 2 are summarized in Table 1. As shown in Figure 1, the Wragge–Cooper model again consistently underpredicted the measured vancomycin concentrations in the second group of patients. Relative performance analysis demonstrated that the revised model provides significantly less bias, and shows a
Table 1. Patient Demographics and Creatinine Clearance PARAMETER
Number of patients Age (y)a Gendera Height (cm)a Weight (kg)a Clcr (mL/min/1.73 m2)a ICU CF SCI Other
GROUP 1
GROUP 2
25 51 ± 18 12 F, 13 M 169.7 ± 11.2 72 ± 17 91.1 ± 33.5 13 0 1 11
25 54 ± 16 13 F, 12 M 170.4 ± 11.4 74 ± 28 95.6 ± 33.8 12 2 1 10
CF = cystic fibrosis; Clcr = creatinine clearance; ICU = intensive care unit; SCI = spinal cord injury. a Mean ± SD.
178
■
The Annals of Pharmacotherapy
■
Figure 2. Mean absolute error (MAE) of serum vancomycin concentrations. Trad #1 = traditional model in group 1, W-C #1 = Wragge–Cooper model in group 1, Trad #2 = traditional model in group 2, W-C #2 = Wragge–Cooper model in group 2, and Revised = revised model in group 2.
1998 February, Volume 32
Research Reports
scription of predictive performance. In our patient population the Wragge–Cooper models VANCOMYCIN CONCENTRATIONS did not provide an accurate and precise predicPOPULATION WRAGGE–COOPER TRADITIONAL REVISED MEASURED tion of vancomycin concentrations. This may Group 1 13.31 ± 7.52b 14.48 ± 11.12b 18.49 ± 10.84 be explained in part by differences in patient Group 2 11.33 ± 7.7b 11.14 ± 9.95b 15.62 ± 10.41 16.41 ± 9.38 populations. Whether this difference reflects a a Mean ± SD (mg/L). higher acuity of illness in our patients remains bSignificantly different (p < 0.05) from measured concentration. speculative. In addition, a small number of patients with cystic fibrosis (n = 2) and spinal cord injuries (n = 2) were included in our study; both of these groups are known to have trend toward improved precision compared with the altered pharmacokinetics. Varying definitions of stable reWragge–Cooper and traditional models, respectively. Prenal function may also have contributed to the difference in dicted vancomycin concentrations using both the Wragge– performance of the two models; the definition of stable reCooper and traditional models were significantly different nal function used in the Wragge–Cooper study is more refrom the measured concentrations, whereas no difference strictive than that utilized in this study. Due to the small was noted with the revised model (Table 3). Regression sample size, no specific trends in the predictive perforanalysis of the fitted vancomycin and aminoglycoside mance were noted when subgroup analysis was performed elimination in all 50 patients revealed a slightly modified by institution and by patient type (general medicine vs. inrelationship: k10 (1/h) = 0.100 + 1.103ke,amg compared with tensive care unit). the model derived from the first 25 patients: relationship In comparing the Wragge–Cooper and revised models, k10 (1/h) = 0.081 + 1.037ke,amg. This slight change suggests varying methods used in performing the pharmacokinetic a stable relationship exists between vancomycin and analysis may have resulted in the different models develaminoglycoside elimination. oped. In the Wragge–Cooper study8 a one-compartment log–linear model was used to determine aminoglycoside and vancomycin pharmacokinetic parameters. In contrast, Discussion we used a two-compartment Bayesian model for analysis of Traditional methods of determining the optimal dose of vancomycin concentrations and a one-compartment Bayesvancomycin incorporate Clcr as an indicator of vancomyian model for aminoglycoside concentrations. Bayesian cin elimination. Wragge and Cooper8 developed a model analysis has been demonstrated to be the most accurate and incorporating individualized aminoglycoside ke to predict precise method for adaptive control of serum concentravancomycin ke using linear regression techniques. Linear tions, particularly with sparse sampling.10,11,14,15 regression, however, does not assess the proximity of preThe clinical value of monitoring serum vancomycin dictions to true values and, therefore, provides a poor deconcentrations has received much attention in the literature.4-7 Cantú et al.5 suggest that since definitive evidence supporting a causal relationship between serum concentrations and efficacy or toxicity is lacking, vancomycin dosages should be determined on the basis of available nomograms. The study by Wragge and Cooper8 demonstrated that the relationship between aminoglycoside elimination and vancomycin elimination was stronger than that of estimated Clcr and vancomycin elimination. This finding is further supported by our study. The following illustrates clinical application of the revised model. Measurement of aminoglycoside serum concentrations is required. Bayesian analysis of the measured aminoglycoside concentrations enables determination of the ke,amg, which can be used in the revised model to estimate the patient’s vancomycin k10. Determination of the appropriate vancomycin dosage can then be determined by using the population estimates of the remaining parameters (V1, k12, k21) and the derived elimination rate constant (k10). In USC*PACK this is accomplished by entering the new population parameters (the revised model derived from phase I). The ke,amg is then used as the descriptor in place of Clcr when planning the initial vancomycin regimen. Utilizing data from a typical patient (52-y-old man, 170 cm, 73 kg, intensive care patient, estimated Clcr 93 Figure 3. Relationship between Bayesian fitted vancomycin and aminoglycoside mL/min/1.73 m2, ke,amg 0.277) the vancomycin dosage regielimination (r = correlation coefficient). k10 = estimated vancomycin elimination; ke men necessary to achieve estimated steady-state peak and = aminoglycoside elimination. Table 3. Predicted and Measured Vancomycin Concentrations a
The Annals of Pharmacotherapy
■
1998 February, Volume 32
■
179
trough concentrations of approximately 30 and 10 mg/L with the Wragge–Cooper, traditional, and revised models are: 1000 mg every 8 hours, 500 mg every 6 hours, and 500 mg every 8 hours, respectively. Significant differences in both the total daily dose and the recommended interval to achieve the desired concentrations are readily apparent. The limitations of our study include the following: Data were collected retrospectively; therefore, the accuracy of the medication administration and serum sampling times could not be controlled. In addition, the revised model was developed and validated over a relatively limited range of renal function. Thus, further evaluation is needed in patients with severe renal impairment. Despite these limitations, the revised model has demonstrated to be the least biased method of predicting vancomycin concentrations in patients receiving concurrent aminoglycoside therapy. Also unclear is the application of this model in patients who are receiving extended-interval (e.g., once daily) dosing of aminoglycosides, where a single aminoglycoside concentration may be all that is available. Prospective studies evaluating the performance of the revised model in predicting serum concentrations would definitively demonstrate the value of this prediction method.
Summary The results of this study suggest that our revised model incorporating aminoglycoside elimination provides a more accurate prediction of vancomycin concentrations in patients in general medicine and intensive care units than do the Wragge–Cooper and traditional models. Application of our model can minimize serum vancomycin concentration monitoring in patients receiving concurrent aminoglycoside therapy.
References 1. Farber BF, Moellering RC. Retrospective study of the toxicity of preparations of vancomycin from 1974 to 1981. Antimicrob Agents Chemother 1983;23:138-41. 2. Sorrell T, Collignon PJ. A prospective study of adverse reactions associated with vancomycin therapy. J Antimicrob Chemother 1985;16:235-41. 3. Rybak MJ, Albrecht LM, Boike SC, Chandrasekar PH. Nephrotoxicity of vancomycin, alone and with an aminoglycoside. J Antimicrob Chemother 1990;25:679-87. 4. Freeman CD, Quintiliani R, Nightingale CH. Vancomycin therapeutic drug monitoring: is it necessary? Ann Pharmacother 1993;27:594-8. 5. Cantú TG, Yamanaka-Yuen NA, Leitman PS. Serum vancomycin concentrations: reappraisal of their clinical value. Clin Infect Dis 1994;18: 533-43. 6. Moellering RC Jr. Monitoring serum vancomycin levels: climbing the mountain because it is there (editorial)? Clin Infect Dis 1994;18:544-6. 7. Ackerman BH. Clinical value of monitoring serum vancomycin concentrations (letter). Clin Infect Dis 1994;19:1180-1. 8. Wragge TM, Cooper BE. Correlation of aminoglycoside and vancomycin pharmacokinetic parameters. Ann Pharmacother 1993;27:1346-8. 9. Leonard AE, Boro MS. Vancomycin pharmacokinetics in middle-aged and elderly men. Am J Hosp Pharm 1994;51:798-800. 10. Hurst AK, Yoshinaga MA, Mitani GH, Foo KA, Jelliffe RW, Harrison EC. Application of a Bayesian method to monitor and adjust vancomycin dosage regimens. Antimicrob Agents Chemother 1990;34:116571. 11. Jelliffe RW, Iglesias T, Hurst AK, Foo KA, Rodriguez J. Individualizing gentamicin dosage regimens. A comparative review of selected models, data fitting methods and monitoring strategies. Clin Pharmacokinet 1991;21:461-78.
180
■
The Annals of Pharmacotherapy
■
12. Jelliffe RW, Jelliffe SM. A computer program for estimation of creatinine clearance from unstable serum creatinine levels, age, sex and weight. Math Biosci 1972;14:17-24. 13. Sheiner LB, Beal SL. Some suggestions for measuring predictive performance. J Pharmacokinet Biopharm 1981;9:503-12. 14. Pryka RD, Rodvold KA, Garrison M, Rotschafer JC. Individualizing vancomycin dosage regimens: one- versus two-compartment Bayesian models. Ther Drug Monit 1989;11:450-4. 15. Rodvold KA, Pryka RD, Garrison M, Rotschafer JC. Evaluation of a two-compartment Bayesian forecasting program for predicting vancomycin concentrations. Ther Drug Monit 1989;11:269-75.
EXTRACTO OBJETIVO:
Evaluar el modelo Wragge–Cooper de predecir concentraciones séricas de vancomicina utilizando lo parámetros farmacocinéticos de aminoglucósidos determinados en pacientes internados en las salas de cuidado intensivos y medicina general. De acuerdo al resultado de las predicciones, se desarrollará un modelo revisado de ser necesario. DISEÑO: Este estudio consiste de dos fases, evaluando un 50 adultos recibiendo terapia concurrente de vancomicina y aminoglucósido. Los pacientes fueron identificados por una revisión retrospectiva de los expedientes médicos. Se hizo un análisis Bayesiano de las concentraciones séricas de vancomicina y aminoglucósido para determinar los parámetros farmacocinéticos individuales. La fase I del estudios era para examinar la ejecución predictiva del modelo publicado incorporando la eliminación del aminoglicósido (Wragge–Cooper) en 25 pacientes (grupo 1), y se desarrolló un modelo revisado, da fase II consistía en examinar la ejecución predictiva del modelo revisado y su ejecución comparada al modelo Wragge–Cooper y al modelo tradicional incorporando la depuración de creatinina estimada en 25 pacientes adicionales (grupo 2). ESCENARIO: Dos hospitales universitarios de cuidado terciario. MEDICIÓN DE RESULTADOS: La ejecución predictiva de los modelos fue determinada por la comparación entre los valores predecidos y los medidos de las concentraciones séricas de vancomicina. El sesgo y la precisión fueron evaluados a base del cálculo del error medio predecido (EM) y el error absoluto medio (EAM), respectivamente. Se hizo una regresión lineal para determinar la relación entre ambos parámetros. RESULTADOS: El modelo Wragge–Cooper consistentemente sub-predice las concentraciones séricas de vancomicina en las poblaciones estudiadas (EM = –5.18; EAM = 6.63). Un análisis de ejecución predictiva relativa indica que no existe diferencia significativa en sesgo o precisión entre el modelo tradicional y el de Wragge–Cooper (∆ EM1.17; ∆EAM –0.80). El analisis de regresión de las depuraciones de creatinina individualizadas de vancomicina y aminoglucósidos derivado de los pacientes del grupo 1, revela la siguiente relación: vancomicina K10 (1/h) = 0.081 + 1.037 (Kelamg), r = 0.73. El modelo revisado es significativamente menos sesgado y más preciso al compararse con el modelo tradicional (∆EM –4.48; ∆EAM 1.22) y es significativamente menos sesgado (∆EM 4.29) aunque no más preciso que el modelo Wragge–Cooper (∆EAM –0.58), al examinar los resultados en los pacientes del grupo 2. CONCLUSIONES: El modelo revisado es un método certero de predecir las concentraciones séricas de vancomicina tanto en pacientes de cuidado intensivo así como los de medicina general. El uso de este modelo permite la individualización de la dosis de vancomicina en pacientes recibiendo terapia concurrente con aminoglucósido y disminuye la necesidad del seguimiento de las concentraciones séricas de vancomicina. JORGE MIRANDA-MASSARI RÉSUMÉ OBJECTIF: Évaluer la méthode de Wragge–Cooper, une méthode permettant de prédire les concentrations sériques de vancomycine à partir des paramètres pharmacocinétiques des aminosides chez des patients de soins généraux et de soins intensifs. Réviser ce modèle, si nécessaire.
1998 February, Volume 32
Research Reports DEVIS EXPÉRIMENTAL:
Cette étude comportait deux phases et a évalué 50 malades adultes recevant un traitement concomitant de vancomycine et d’un aminoside. Une revue rétrospective des dossiers médicaux a permis d’identifier les sujets. Une analyse Bayésienne des concentrations sériques mesurées de vancomycine et d’aminosides a été effectuée afin de déterminer les paramètres pharmacocinétiques individualisés. La phase I de l’étude a évalué la performance prédictive du modèle de Wragge–Cooper chez 25 patients. Un modèle révisé a été développé au cours de cette phase. La phase II a évalué la performance prédictive du modèle révisé ainsi que sa performance comparativement au modèle de Wragge–Cooper et à un modèle traditionnel tenant compte de la clairance estimée à la créatinine chez 25 autres patients. LIEU DE L’ÉTUDE: Deux centres hospitaliers universitaires de soins tertiaires. MESURES DE L’EFFET: La performance prédictive des différents modèles a été déterminée en comparant les concentrations sériques prédites et mesurées de vancomycine. Les biais et la précision ont été évalués en calculant respectivement l’erreur moyenne de prédiction (EM) et l’erreur absolue moyenne (EAM). Une régression linéaire a été effectuée afin de déterminer les relations existant entre ces paramètres. RÉSULTATS: Le modèle de Wragge–Cooper sous-estime de façon constante les concentrations sériques de vancomycine des patients de
soins généraux et de soins intensifs (EM = –5.18; EAM = 6.63). L’analyse de performance prédictive n’indique aucune différence significative en ce qui concerne les biais ou la précision entre les modèles traditionnel et de Wragge–Cooper (∆EM 1.17; ∆EAM –0.80). L’analyse de régression des clairances individualisées d’aminoside et de vancomycine obtenue des patients du groupe 1 révèle la relation suivante: K10 vancomycine (1/h) = 0.081 + 1.037 (Kélaminoside), r = 0.73. Le modèle révisé est significativement moins biaisé et plus précis que le modèle traditionnel (∆EM –4.48; ∆EAM 1.22), et significativement moins biaisé (∆EM 4.29) mais pas plus précis que le modèle de Wragge–Cooper (∆EAM –0.58) en utilisant les données obtenues des patients de la groupe 2. CONCLUSIONS: Le modèle révisé constitue une méthode précise permettant de prédire les concentrations sériques de vancomycine chez des patients de soins généraux et de soins intensifs. L’utilisation de ce modèle permet l’individualisation des doses de vancomycine chez les patients recevant un traitement concomitant d’aminoside et réduit le monitorage des concentrations sériques de vancomycine. ALAIN MARCOTTE
YOUR PROFESSIONAL LIBRARY DESERVES THE BEST Quick access to important reference material is only one reason your library should contain The Annals of Pharmacotherapy Vol. 30 1996
this valuable resource.
of nnals The A otherapy c a m Phar ol. 31 V 1997
Solve the problem of missing issues and torn-out pages with a bound volume of The Annals. These attractive hardcover editions include a complete annual index. And, if you are a subscriber, save 50% off the regular price and pay just $30.00. Subscribers, librarians, and department heads should act now as the supply is limited.
1997 BOUND VOLUMES — THE ANNALS OF PHARMACOTHERAPY Price Each:
$60.00* $75.00 (outside USA)
The Annals Label No.
*Deduct $30.00 if you are a subscriber. Just print your label identification number on the order form. Total Enclosed
$
Please charge my:
Quantity
❏ VISA
❏ MasterCard
Name Address City State/Country
Acct. No. Cardholder’s Name
Phone
Exp. Date
FAX
Zip
Signature
9802
Harvey Whitney Books Company PO Box 42696 • Cincinnati, Ohio • 45242 USA • Tel. 513/793-3555 FAX 513/793-3600 • E-mail
[email protected]
The Annals of Pharmacotherapy
■
1998 February, Volume 32
■
181