Predictive Simulation of Structural Sensing Matthieu Gresil1, Victor Giurgiutiu2 and Yanfeng Shen3. LAMSS, University of South Carolina, Columbia, SC, 29208, USA
This paper discusses the development of a methodology for multi-scale multi-domain predictive simulation of structural sensing. Tools are provided to extend the modeling capacities and improve quality and reliability of 1-D and 2-D guided wave propagation models using commercially available finite element method (FEM) packages. Predictive simulation of ultrasonic nondestructive evaluation (NDE) and structural health monitoring (SHM) in realistic structures is challenging. Analytical methods that can perform efficient modeling of wave propagation are limited to simple geometries. Realistic structures with complicated geometries are usually modeled with the FEM. However, the accuracy of the FEM models needs to be carefully assessed before they can be used to simulate the minute changes induced by structural damage. The modeling of the interaction between piezoelectric wafer active sensor (PWAS) and structural waves is addressed. Two main issues are discussed: (a) modeling of pitch-catch ultrasonic waves betwwen a PWAS transmitter and a PWAS receiver by comparison exact Lamb wave solutions, various FEM results, and experimental results; (b) nonlinear FEM models for localized structural sensing. The paper ends with summary and conclusions followed by recommendations for further work.
Nomenclature Sij
= mechanical strain tensor
Tkl Dj
= mechanical field tensor = electrical displacement tensor
E sijkl
= mechanical compliance under constant mechanical stress
= dielectric permittivity under constant mechanical stress
T jk
d jkl
= piezoelectric constant
Ve t
= time-domain excitation tension
Ve
= frequency-domain excitation tension
G( x, ) Vr ( x, t )
= frequency-domain structural transfer function at the x location = time-domain receiver tension at the x location
a 0
= = = =
x x, t
in-plane strain at the plate surface half lenght of the piezoelectric wafer active sensor (PWAS) shear stress between the PWAS and the structure Lame’s constant
1
Research Associate, Department of Mechanical Engineering University of South Carolina, 300 Main St. Columbia, SC 29208 USA. Tel: 803-777-0619 Fax: 803-777-0106;
[email protected]. 2 Professor, Department of Mechanical Engineering University of South Carolina, 300 Main St. Columbia, SC 29208 USA. Tel: 803-777-8018 Fax: 803-777-0106;
[email protected]. 3 Ph.D. student, Department of Mechanical Engineering University of South Carolina, 300 Main St. Columbia, SC 29208 USA. Tel: 803-777-8018 Fax: 803-777-0106;
[email protected]. American Institute of Aeronautics and Astronautics
S
= frequency dependent wave number of the symmetric Lamb wave mode
= frequency dependent wave number of the antisymmetric Lamb wave mode
A
PWAS
fc DI A fc
= = = = = = = = = =
A 2 fc
= spectral amplitude at the second harmonic
S ( ) A( ) N
L
r
complex transduction coefficient that converts applied strain into PWAS voltage modal function for the symmetric Lamb mode modal function for the antisymmetric Lamb mode mesh density wavelength size of the finite element damage severity center frequency damage index spectral amplitude at the central frequency
I. Introduction
S
Structural health monitoring (SHM) is an emerging technology with multiple applications in the evaluation of critical structures. Numerous approaches have been utilized in recent years to perform SHM [references]. One of the promising active SHM methods utilizes arrays of piezoelectric wafer active sensors (PWAS) bonded to a structure in order to achieve damage detection [references].The objective of this paper is to present the framework for the development of a methodology for multi-scale multi-domain predictive simulation of structural sensing. Such methodology would be able to predict the signal response of structural sensors as a function of the structural state and/or the presence of structural flaws or damage, in linear and nonlinear regimes. The modeling is multi-scale because it has to incorporate (a) the macro-scale structural features; (b) the micro-scale flaw/damage; (c) the mezo-scale interfaces between structural parts and between sensor and structure. The modeling is multi-domain because the analysis is integrated over several physical domains, i.e., (a) aerospace structural mechanics; (b) electromechanical transduction in the sensors; (c) guided waves ultrasonics; etc. (Figure 1). The modeling will incorporate nonlinear aspects. Electric/electronics analysis Transmitter electronics and power amplifier
Electric/electronics analysis
PWAS A: transmitter (Wave exciter) V1
PWAS B: receiver (Wave detector)
Guided Waves
Receiver electronics and data processing
V2
Damaged region: nonlinearities, bolts, cracks/disbonds, etc.
STRUCTURAL-ULTRASONIC ANALYSIS
Figure 1 Conceptual schematic of a multi-scale multi-domain study: structural-ultrasonics and electric/electronics parts of the analysis are indicated. Our approach would be to combine them all into an integrated multi-scale multi-domain analysis. The present paper presents and discusses the challenges and opportunities related to the use of PWAS transducers in generating and sensing ultrasonic guided waves in structure and how they can be used to detect damage. The paper starts with a review of the general principles of PWAS-based SHM. It discusses the analytical and finite element method modeling of pitch-catch ultrasonic waves betwwen a PWAS transmitter and a PWAS receiver. Then, it provides the multi-physics finite element method (MP-FEM) ultrasonics waves generated by the transmitter PWAS interact with the “breathing crack”, acquire nonlinear features, and are picked up by receiver PWAS. American Institute of Aeronautics and Astronautics
This work is currently under way and the paper to be presented at the conference will include the most up to date information available at that time. Summary, conclusions, and outlook for future work will be included at the end of the paper.
II. PWAS Principles PWAS are the enabling technology for active SHM systems. PWAS couples the electrical and mechanical effects (mechanical strain, Sij , mechanical stress, Tkl , electrical field, Ek , and electrical displacement D j ) trough the tensorial piezoelectric constitutive equations E Sij sijkl Tkl d kij Ek
(1)
D j d jkl Tkl Tjk Ek E Where, sijkl is the mechanical compliance of the material measured at zero electric field
E 0 , Tjk
is the
dielectric permittivity measured at zero mechanical stress (T 0) , and d jkl represents the piezoelectric coupling effect. PWAS utilize the d31 coupling between in-plane strains, S1 , S 2 , and transverse electric field, E3 . Just like conventional ultrasonic transducers, PWAS utilize the piezoelectric effect to generate and receive ultrasonic waves. However, PWAS are different from conventional ultrasonic transducers in several aspects: PWAS are firmly coupled with the structure through an adhesive bonding, whereas conventional ultrasonic transducers are weakly coupled through gel, water, or air. PWAS are nonresonant devices that can be tuned selectively into several guided wave modes, whereas conventional ultrasonic transducers are resonant narrow-band devices. PWAS are inexpensive and can be deployed in large quantities on the structure, whereas conventional ultrasonic transducers are expensive and used one at a time. PWAS transducers can be serve several purposes [1]: (a) high-bandwidth strain sensors; (b) high-bandwidth wave exciters and receivers; (c) resonators; (d) embedded modal sensors with the electromechanical impedance spectroscopy method. By applications types, PWAS transducers can be used for (i) active sensing of far field damage using pulse-echo, pitch-catch, and phased-array methods, (ii) active sensing of near field damage using high frequency EMIS and thickness gage mode, and (iii) passive sensing of damage-generating events through detection of low-velocity impacts and acoustic emission at the tip of advancing cracks.
III. Modeling of Pitch-Catch Ultrasonic waves Figure 1 shows a pitch cach configuration in which ultrasonic Lamb waves are sent by a transmitter PWAS (TPWAS) and captured by a receiver PWAS (R-PWAS), both of length l 2a . Such a pitch-catch process has been simulated analytically, modeled with the finite elment method (FEM), and measurend experimentally. A. Analytical modeling The analytical modeling of the pitch-catch process between two PWAS transducers separated by a distance was carried out in frequency domain in four steps: Fourier transform the time-domain excitation signal Ve t taken into the frequency domain spectrum,
Ve ;
Calculate the frequency-domain structural transfer function at the receiver location, G( x, ) Multiply the structural transfer function by frequency-domain excitation signal to obtain the frequency domain signal at the receiver, i.e., Vr x, G x, Ve ;
Perform inverse Fourier transform to obtain the time-domain receiver signal, Vr ( x, t ) IFFT{Vr ( x, )} IFFT{G( x, ) Ve ()} . In this paper, the main interest is in symmetric fundamental mode (S0) and anti-symmetric fundamental mode (A0). For Lamb waves with only two modes (A0 and S0) excited, the structure transfer function G is given by Eq. (99) of ref.[1], page 327, which gives the in-plane strain at the plate surface as American Institute of Aeronautics and Astronautics
x x, t i
N S S i S x t N A A i A x t a 0 S (sin A a) ' A e (sin a) ' S e A S D D S A
(2)
where is the frequency dependent wave number of each Lamb wave mode and the superscripts S and A refer to symmetric and antisymmetric Lamb wave modes. The notations of ref.[1], page 321-329 are adopted. If only the two fundamental modes, S0 and A0, are present, then G can be written as G x, S ei x A ei S
S PWAS sin S a
N S S DS' S
A
x
(3)
A PWAS sin A a
,
N A A DA' A
(4)
where PWAS is the complex transduction coefficient that converts applied strain into PWAS voltage. The modal participation functions S ( ) and A( ) determine the amplitude of the S0 and A0 wave modes excited into the structure. The terms sin( S a) and sin( A a) control the tuning between the PWAS transducer and the Lamb waves. Hence, the signal at the receiver PWAS is Vr x, S Ve ( )ei x A Ve ( )ei S
A
x
(5)
B. Experimenta Set-up The test specimen were constructed to develop and calibrate the damage-detection methodology using a simple geometry specimens, and also to validate the analytical, the FEM and the hybrid global-local results. Thin aluminum plate specimens were constructed from 3.2-mm-thick 2024-alloy stock in the form of a square plate. The specimens were instrumented with arrays of 7-mm square and 7-mm circular PWAS (Figure 2). The sensor locations are given in Table 1.
Figure 2: Arrangement of the PWAS bonded on the 3.2-mm aluminum plate. American Institute of Aeronautics and Astronautics
Table 1: Location of PWAS transducers on the square plate speciemen. 1 2 3 4 5 6 7 8 9 10 Sensor# 31 31 31 31 51 51 51 51 71 71 x (mm) 31 51 71 91 91 71 51 31 31 51 y (mm) X X X X Square X X X X X X Circular
11 71 71 X
12 71 91 X
13 91 91 X
14 91 71 X
15 91 51
16 91 31
X
X
An HP33120A arbitrary signal generator was used to generate a 150-kHz windowed harmonic-burst excitation to active sensors with a 10-Hz repetition rate. Under harmonic burst excitation, the active sensor generates a package of elastic waves that spread out into the entire plate according to a circular wave front pattern. A Tektronix TDS210 four-channel digital oscilloscope, synchronized with the signal generator, was used to collect the response signals from the active sensors as shown in Figure 3.
Plate
Function generator
Oscilloscope (TDS210)
Figure 3: Picture of the pitch-catch experiments set-up. The results for the rectangular plate were remarkably clear and easy to interpret. No reflections wave packet effects occurred in the rectangular plate because the edges were far away from the source. C. FEM model The effectiveness of conventional finite element modeling of elastic waves propagating in structural components has been shown in the past. The case of Lamb waves in free plates is a classic example [2, 3]. The package used in the present study, ABAQUS/Explicit, uses an explicit integration based on a central difference method [4]. In preliminary studies [5-7], we investigated how the group velocities of the S0 and A0 waves vary with mesh density (nodes per wavelength) N L , where is the wavelength and L is the size of the element. For a1-D wave propagation problem, we choosed a mesh size of 0.1 mm corresponding to N 76 , which mitigated a reasonable accuracy with an acceptable computation time. However this mesh size is not applicable for 2-D wave propagation problem cause of considerable long time of calculation. In our 2-D case, we choosed a mesh size of 0.5 mm which give an acceptable computation time. In non-destructive evaluation (NDE), a common understanding is that the ultrasonic scanning technique can usually detect damage. Furthermore the fundamental anti-symmetrical mode (A0) is preferable and more sensitive to damage because its wavelength is shorter than that of the S0 mode at the same frequency. However, the A0 mode exhibits more dispersion at low frequencies. The FEM simulation of the A0 mode requires fine spatial discretization with substantial computational cost for the sake of the short wavelength. In contrast, the mode shapes of the S0 mode are simpler and the stresses are almost uniform throughout the thickness of the plate at low values to the frequency and plate thickness product. For these reason, the two modes S0 and A0 were selected in this study to compare with the analytical and the experimental results. American Institute of Aeronautics and Astronautics
We used the ABAQUS/explicit solver because it gives a better trade-off between accuracy and computation time. The piezoelectric element C3D8E doesn’t exist in ABAQUS/explicit; hence we applied 12 and 8 selfequilibrating forces as shown in Figure 4a and Figure 4b to simulate the wave excitation for the square and round PWAS respectively. The plate was discretized with C3D8R brick elements of size 0.5mm. A 3-count smoothed tone burst with a central frequency of 150 kHz was used to modulate the excitation.
(a)
(b)
Figure 4: Self equilibrating force excitation; (a) for the square PWAS; (b) for a round PWAS. D. Results and Discussion The analytical, finite element, and experimental results for a 3.2-mm thick aluminum plate with 200-mm PWAS distance for a frequency of 150 kHz are shown in Figure 5a. S0 and A0 mode wave packages could be observed. The wave speed of S0 mode is higher than the A0 mode, so the S0 wave packet is picked up earlier than the A0 wave packet. Furthermore, a perfect matching on the magnitude is observed between the FEM and the experimental results for the S0 and also the A0 mode. However, as observed on the Figure 5, a magnitude difference and a time shift are observed on the first wave packet (S0 mode) between the analytical and the other results. In addition, a very slight time shift is observed at the end of the A0 packet between the three different results. It may be due to the approximation of the excitation in the analytical and the FEM model compared with the real case in the experimental results. Giurgiutiu and Bottai-Santoni [8] developed a shear lag solution for the stress/strain transfer between a structurally attached PWAS and the support structure. This generic solution takes into account the exact thickness distribution of displacements and stresses corresponding to the Lamb wave modes existing at particular frequencythickness values. They showed that the shear stress distribution varies with PWAS length and thickness of the bond layer. 1 0.8
EXP P1P2 FEM square Analytical
1 0.8 0.6
Normalized magnitude
Normalized magnitude
0.6 0.4 0.2 0 -0.2 -0.4 -0.6 -0.8
EXP P1P2 FEM square Analytical
0.4 0.2 0 -0.2 -0.4 -0.6 -0.8
-1
-1
4
5
6
7
Time (s)
8
9
10
4
5
-5
x 10
6
7
Time (s)
8
9
10 -5
x 10
(a) (b) Figure 5: Comparison of the signal receive after a travel of 200 mm between the analytical, the FEM and the experimental results for the path P1 to P2. (a) analytical model without the shear lag effect; (b) analytical model take into account the shear lag effect. The analytical model using the shear lag effect is compared with the finite element and the experimental results for a 3.2-mm thick aluminum plate with 200-mm PWAS distance for a frequency of 150 kHz (Figure 5b). When the size PWAS decrease to 4-mm a perfect matching on the magnitude of the S0 packet is observed between the American Institute of Aeronautics and Astronautics
analytical and the other results. Another interesting thing observed that the analytical model is developed with the 1D wave propagation and match perfectly with the 3-D FEM model and also with the experimental results. After the validation of the analytical and the FEM model for the square transmitter PWAS, we proposed to compared the FEM and the experimental results using the round transmitter PWAS. This type of excitation cannot take into account in the 1D analytical model. Figure 7 shows the signal of the FEM and the experimental results with the round transmitter PWAS. A perfect matching on the magnitude is observed between the FEM and the experimental results for the A0 mode packet. However, a slight difference is observed on the magnitude for the S0 mode and s slight time shift on the A0 mode.
Figure 6: Comparison between the FEM and the experimental results with the round transmitter PWAS. For future work, we have to understand why we observed a difference between the square and the round transmitter PWAS in the FEM model which is not observed on our experimental results. E. FEM damage detection A series of FEM model are performed to detect corrosion in 3.2-mm thick aluminum plate. The corrosion damage detection will compare with our preliminary experimental work [9]. Metal structures exhibit a wide range of corrosions types including uniform, pitting, galvanic, crevice, concentration cell, and graphite corrosion [10].When the guiding structure has changes due to corrosion in the geometry, materials properties, supports, or attachments, the guided waves that propagate through will be modified accordingly. Hence, loss of material due to corrosion presents geometrical changes which will cause the guided waves scattering and can be used for inspection of corrosion. The first step in using Lamb waves to detect the hole or corrosion damage is the selection of an appropriate Lamb wave mode which is sensitive to thickness variation damage. The theoretical dispersion curves in Error! Reference source not found. indicate that the velocity of A0 Lamb wave mode varies rapidly with frequency due to its highly dispersive nature which is related with the product frequency-thickness. Hence, changes in the plate thickness between the transmitter and the receiver will affect the propagating speed A0 mode. However, the S0 mode is almost non dispersive in this frequency range, and hence to be unmodified by thickness loss. In this study, we simulated uniform corrosion on an aluminum plate. The depth was increased gradually in order to simulate corrosion progression. This thickness loss produced a change produced a change in the waveguide impedance and thus caused (i) scattering and reflection and (ii) modification of the wave speed of the Lamb waves crossing the corrosion area. In practice, corrosion defects are geometrically complex and require multiple parameters to describe them and their scattering behaviors. We used simplified shapes for propagating Lamb wave paths to reduce number of parameter in order to better understand the changes causes by material loss. In the mode, simulated corrosion was made on 3.2-mm thick. The location of the corrosion was halfway between the two PWAS transducers. The distance between the R-PWAS and the T-PWAS is 260 mm. A 50 x 38 mm2 area is used to simulate the corrosion. This simulation set-up is in agreement with our previous experimental set-up in order to compare this FEM simulation with our previous experimental study [9]. American Institute of Aeronautics and Astronautics
Lamb wave group velocity of Aluminum-2024-T3
6000
5000
anti-symmetric symmetric
S0
cg (m/s)
4000
3000
A0 2000
A1 1000
S1 0 0
200
400
600
800
1000
f(kHz) Figure 7: Dispersion curves for 3.2 mm-thick aluminum plate.
In order to have a system able to evaluate in real time, in situ, the health of the structure in an automatic way, it is necessary to define a damage index (DI). In this paper, we choose the DI based on the root mean square deviation (RMSD). The RMSD-DI is a scalar quantity that results from a statistical comparison between the signal in the present state and the signal in the reference state (baseline). Such a scalar reveals the difference between pristine data and measurement caused by the presence of damage and provides an overall change of the structure between sensors. This feature would be ideal for hole or corrosion detection since it carries information of both the amplitude and the phase changes from the growth of the corrosion. The RMSD DI is defined as the relative ratio of the difference between each measurement and baseline signals as follows: N 1
s j s j RMSD DI=
j 0
i
2
0
N
s02 j
(6)
j 0
Where si is the ith measurement and s0 the baseline signal, and N the data length. The curves obtained from the RMSD DI are given in Figure 5. First, the A0 mode for both experimental and simulate is more sensitive that the S0 mode. Second, The DI curves changes from 0 to 2.5, indicating significant corrosion development occurring along the wave propagation path. However, the change of DI with corrosion development is not monotonic. The DI curve increases first for the corrosion depth from 0 to 1.2 mm for the simulation results, and from 0 to 0.94 mm for the experimental results. Then the RMS DI decrease. The reason for this phenomenon is that the RMSD DI shows the changes of both amplitude and phase while is it more sensitive to magnitude changes. From these simulations it is found that, with 99% of confidence, the minimum detectable corrosion depth’s size is 0.1 mm., and from our previous experimental results [17], the minimum detectable corrosion depth’s size is 0.38 mm. Nevertheless, in our experimental results, 0.38 mm was the first measurement after the pristine case.
American Institute of Aeronautics and Astronautics
Figure 8. Comparison of the damage index based on the RMSD between our preliminary experimental results [9].
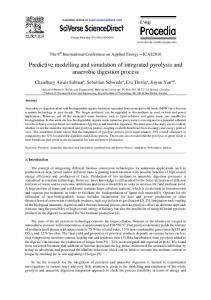
IV. Nonlinear ultrasonics multi-physics finite element method model Structural health monitoring during the early stage of material degradation is important for detecting micro cracks that are precursors to structural damage. Conventional linear elastic ultrasonic techniques are sensitive to gross defects but less sensitive to micro cracks. The nonlinear ultrasonic technique, which uses distinctive higher harmonics and sub harmonics features, proves itself a promising approach to detect micro cracks and other incipient damage [11-13]. Experimental studies of nonlinear Lamb waves have been carried out recently, demonstrating the capability of nonlinear Lamb wave to detect structural defects [14, 15]. Generation of higher harmonics Lamb waves have been investigated theoretically [16], and existence of anti-symmetric or symmetric Lamb waves at nonlinear higher harmonics has been discussed via modal analysis approach and the method of perturbation. However, these theoretical studies considered only the simple case where nonlinearity is present over the whole domain of the material; other causes for nonlinear behavior, such as localized material degradation or micro cracks, have not been investigated theoretically due to the mathematical complexity. In preliminary work [17], we studied the breathing crack nonlinearity using the multi-physics finite element method (MP-FEM). A breathing crack will introduce nonlinearity into the structure by varying structural stiffness between opening and closing. Piezoelectric wafer active sensors (PWAS) are used to construct pitch-catch pairs [1]; we are modeled with coupled field elements. An “element birth and death” approach was used to model the closing and opening of the crack. The crack presence and severity is indicated by the distinctive nonlinear higher harmonics. A. MP-FEM model for nonlinear ultrasonics propagation In our model Figure 9, four 7mm 7mm 0.2mm piezoelectric wafer active sensors (PWAS) are considered bonded on a 2-mm thick aluminum plate. One PWAS works as a transmitter and sends tone burst excitation signal into the structure; the other three PWAS transducers function as receivers and detect the wave signal arriving in sequence at the three locations. The plate is long enough to ensure the received signals are not influenced by boundary reflections. The distances between the transmitter PWAS and the receiver PWAS transducers are shown in Figure 9. The crack is located at 200 mm from the transmitter, such that the S0 and A0 wave packets have already separated when Lamb wave arrives at the crack location; hence the S0 and A0 wave packets interact with the breathing crack individually, which allows us to see how the crack influences differently the S0 and A0 waves. A 2D transient finite element model is built under the plane strain assumption to simulate a pitch-catch SHM process interrogating a cracked plate. The PWAS transducers are modeled with coupled field elements (PLANE13) which couple the electrical and mechanical variables. We have explored the use of multi-physics finite element method (MP-FEM) to model the generation of elastic waves from an applied electric field applied to a surfacemounted PWAS transmitter (T-PWAS) and the reception of the elastic wave as electric signal recorded at a PWAS receiver (R-PWAS). The plate is modeled with four nodes structure element PLANE182 with “element birth and death” capability. A 100-volts 5-counts Hanning-window modulated tone burst signal centered at 100 kHz is applied on the top electrode of the transmitter PWAS. The plate is under free boundary condition. The Lamb wave sent out by transmitter PWAS will propagate along the plate, interact with the breathing crack, pick up nonlinear features, and be detected by the receiver PWAS. American Institute of Aeronautics and Astronautics
Coupled field element Transmitter PWAS
Receiver PWAS transducerrs
T
R1
Mesh size: 0.5 mm
R2
R3
2-mm thick aluminum plate
Mesh size: 0.25 mm
Crack zone
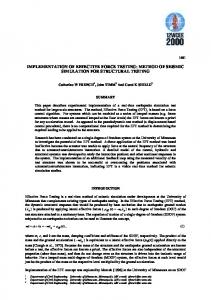
Figure 9: MP-FEM model for nonlinear ultrasonics propagation. The severity of damage is represented by the number of elements selected to be deactivated and reactivated. We define the damage severity as the index where r=a/h ( a and h are the crack size and plate thickness respectively). An index of r 0.0 corresponds to pristine condition, where there is no crack in the plate. In our simulation, we used 20 elements across the thickness at the crack zone. Different damage severities r =0.6, 0.5, 0.4, 0.3, 0.2, 0.1 and 0.0 were generated by selecting 12, 10, 8, 6, 4, 2 and 0 elements. B. Results and discussion The superposed time domain simulation signal for PWAS receiver R3 are shown in Figure 10. It can be observed from Figure 10, that compared with pristine condition, the cracked plate signal has a slight amplitude drop and phase shift in both S0 and A0 packets. Another difference is that a new wave packet appears due to the breathing crack. This new packet is a special feature introduced by the breathing crack. This new packet may be introduced by mode conversion at the breathing crack: when the crack opens, no matter if by the S0 and A0 packet, the effect of tension force at the cracked location could be decomposed into stretching and bending w.r.t the neutral axis, which will generate correspondingly S0 and A0 components. When the crack closes, since the crack surfaces may have relative velocity, collision between the crack surfaces will happen. The effect of this collision could also be decomposed into two parts: compression and bending, which will generate respectively S0 and A0 components. The nonlinear effect will also introduce higher harmonics components in both S0 and A0; since both modes are dispersive, the new packet feature indicated in Figure 10 could also come from the high frequency components which “escaped” and separated from the S0 and A0 packets. Thus, it could be deduced that the new packet feature comes from the breathing crack, and contains both S0 and A0 waves. Fourier transforms of S0, A0 and the new wave packets are carried out, and plotted in Figure 11.
Time domain simulation signal of PWAS receiver R3 Amplitude (mV)
5
Boundary reflection
A0
r = 0.0 r = 0.6
S0
0
New packet! -5
0
50
100
150
200
250
300
350
Time (microsecond) Figure 10: Superposed time domain simulation signals at PWAS receiver R3 for pristine (r=0) and cracked (r=0.6) cases.
American Institute of Aeronautics and Astronautics
Fourier transform of S0 0
10
102
Fourier transform of A0
99.5
Pristine r = 0.6
10
208 392
498.5
Magnitude
Magnitude
304 -2
10
Pristine r = 0.6
0
-4
195.8 Peak missing
-2
10
-4
10
10
-6
10
(a)
0
200
400
600
800
1000
(b)
0
200
Frequency (kHz) Fourier transform of new packet 10
496 402.5
-2
S0 100
-4
50
10
(d) 200
400
S0 A0
A0
Amplitude
Magnitude
-3
0
1000
150
10
(c)
800
Tuning curve for S0 and A0
Pristine r = 0.6
294.5
10
600
200
98 201
-1
400
Frequency (kHz)
600
800
1000
0
Rejecting point
0
200
400
600
800
1000
Frequency (kHz) Frequency (kHz) Figure 11. Fourier Transform of S0, A0 and the new component: (a) S0; (b) A0; (c) new packet; (d) tuning curves for A0 and S0.
For all the wave packets, the pristine signal does not shown any higher frequency components whereas the signal from cracked plate shows distinctive nonlinear higher harmonics. Figure 11a shows distinctive nonlinear higher harmonics in the S0 wave packet. Since the excitation frequency is centered at fc 100 kHz, the 102 kHz peak corresponds to the excitation frequency f c , and the 208 kHz, 304 kHz, 392 kHz and 498.5 kHz correspond to 2fc ,3f c , 4f c respectively. For the A0 wave packet (Figure 11b), the first peak corresponds to the excitation frequency f c , and the second harmonic 2f c could be clearly observed at 195.8 kHz, but the third harmonic 3f c is somehow missing. This phenomenon is due to the tuning effect of PWAS [18]. The tuning curve shown in Figure 11d indicates that at around 300 kHz, which is where the third harmonic should appear, the A0 mode reaches its rejection point; In other words, for the given PWAS and plate structure, this frequency could not be detected due to the rejection effect at the receiver PWAS. However, the second nonlinear higher harmonic is clearly detected. Analysis of the observed “new packet” (Figure 11c) also reveals the nonlinear higher harmonics pattern. The peaks correspond to excitation frequency f c , nonlinear higher harmonics 2fc ,3f c , 4f c and 5f c . In this new packet, the feature of nonlinear higher harmonics seems to be more obvious than in the S0 and A0 packets. And the amplitudes of the higher harmonics are closer to that of the excitation. To further identify the damage severity, the simulation results from r = 0.6, 0.5, 0.4, 0.3, 0.2, 0.1 and 0.0 are compared. The amplitude ratio of second harmonic to excitation frequency is adopted to show the degree of nonlinear effect, which may serve as a damage index indicating damage severity, i.e. American Institute of Aeronautics and Astronautics
DI
A(2f c ) A(f c )
(7)
Where A(f c ) and A(2f c ) denote the spectral amplitude at the excitation frequency and at the second harmonic in the frequency domain. The variation of DI with crack damage intensity is shown for S0 and A0 packets in Figure 12a and for the new packet in Figure 12b. It can be observed in Figure 12 that the amplitude ratio DI is relatively small for both S0 and A0 packets, but it is quite big for the new wave packet even at small values of r . The DI for S0 and A0 has a monotonically increasing relationship with the crack damage intensity. So the ratio DI from the new packet could serve as an early indicator for the presence of a breathing crack, and the ratio DI for the S0 and A0 packets can serve as an indicator of damage severity. It should be noted that the damage index only depends on the ratio of frequency spectral amplitude; it does not require any baseline data. So this DI based on nonlinear guided wave is a baseline free indicator for damage presence and severity.
Amplitude ratio--S0 and A0
Amplitude ratio--new packet 1
0.1
0.8
Amp(2f)/Amp(f)
0.08
Amp(2f)/Amp(f)
New packet
S0 A0
0.06 0.04 0.02
(a)
0
0.6
0.4 0.2
(b) 0
0.1
0.2
0.3
0.4
0.5
0.6
Crack damage intensity--r
0
0
0.1
0.2
0.3
0.4
0.5
0.6
Crack damage intensity--r
Figure 12. Damage severity index.
V. Conclusion This paper has presented an investigation in the predictive modling of the piezoelectric wafer active sensors (PWAS) and high frequency structural waves and vibration. Two main issues were discussed: (a) modeling of pitchcatch ultrasonic waves between a PWAS transmitter and a PWAS receiver by comparison exact Lamb wave solutions, finite element method (FEM) results and experimental results; (b) nonlinear multi-physics finite element method (MP-FEM) for breathing crack detection. It was found that both analytical and FEM predictions of guided wave propagation agreed well with the experimental results. The corrosion detection method used in these simulation was the pitch-catch method. It was found that, with 99% of confidence, the minimum detectable depth of corrosion size was.0.1mm. Moreover, the A0 mode was much more effective in detecting corrosion damage than the S0 mode. In this paper, predictive simulation of nonlinear Lamb wave interaction with a crack is carried out using finite element method (FEM). The breathing crack is modeled via the “element birth and death” technique, which is found to behave well with respect to opening and closing under tension and compression. The result shows the “element birth and death” method is capable of simulating a breathing crack. Besides and packets, a new packet is observed in the time domain signal due to the presence of the breathing crack. The nonlinear phenomenon of higher harmonics can be noticed in the frequency spectrum all the wave packets. This distinctive feature allows us to tell the presence of cracks initiated in structure components. Different cases with various damage severities are investigated and compared. A baseline free damage index is proposed based on higher harmonics amplitude. This damage index is found to increase monotonically with damage for the S0 and A0 wave packets. However, for the new wave packet, this damage index is very sensitive to low damage values, but does not increase thereafter. Using this damage index, we find that the new packet is more sensitive to the presence of the crack, while S0 and A0 packets can provide monitoring information on the severity of damage growth. American Institute of Aeronautics and Astronautics
However, the results presented here are just preliminary. Future work should attempt to combine the efficiency of analytical methods with the detailing capability of the FEM approach such as to develop a hybrid global local method for modeling realistic structures with sufficient computational efficiency as to permit paprameter studies. In this way, we will be able to advance from an empirical approach into an analytical rational development of structural health monitoring systems and maintenance strategies. For the future work on the nonlinear study should include theoretical models to simulate nonlinear wave propagation in 3D plate structures. Different causes of nonlinearity should also be investigated like nonlinear material properties, PWAS nonlinearity, bolted lap-joints, etc. Experimental work should be carried out to verify these theoretical predictions and apply the nonlinear behavior to structural health monitoring and non-destructive evaluation.
Acknowledgment Support of the Air Force Office of Scientific Research grant #FA9550-11-1-0133, Dr. David Stargel, Program Manager is thankfully acknowledged.
References [1] [2] [3] [4] [5] [6]
[7] [8] [9]
[10] [11]
[12]
[13] [14] [15] [16] [17] [18]
Giurgiutiu, V, Structural Health Monitoring With Piezoelectric Wafer Active Sensor: Elsevier Academic Press, 2008. Alleyne, D N; Cawley, P (1990) "A 2-dimensional Fourier transform method for the quantitative measurement of Lamb modes", IEEE Ultrasonics Symposium, 1143-1146, 1990 Moser, F; Jacobs, L J; Qu, J (1999) "Modeling elastic wave propagation in waveguides with the finite element method", NDT & E International, 32(4), 225-234, 1999 ABAQUS, "Analysis User's Manual," 6-9.2 ed, 2008. Gresil, M; Shen, Y; Giurgiutiu, V,(2011) "Predictive modeling of ultrasonics SHM with PWAS transducers," presented at the 8th International Workshop on Structural Health Monitoring, Stanford, CA, USA, 2011. Gresil, M; Shen, Y; Giurgiutiu, V (2011) "Benchmark problems for predictive FEM simulation of 1-D and 2D guided wave for structural health monitoring with piezoelectric wafer active sensors," Review of progress in Quantitative Non-destructive Evaluation, Burlington, USA, 2011. Gresil, M; Yu, L; Giurgiutiu, V (2011) "Fatigue crack detection in thick steel structures with piezoelectric wafer active sensors", Proc. of SPIE Vol, 7983, 79832Y-1, 2011 Giurgiutiu, V; Bottai-Santoni, G (2009) "An extension of the shear lag solution for structurally attached ultrasonic active sensors", AIAA Journal, 47(8), 1980-1983, 2009 Yu, L; Giurgiutiu, V; Wang, J; Shin, Y-J (2012) "Corrosion detection with piezoelectric wafer active sensors using pitch-catch waves and cross-time–frequency analysis", Structural Health Monitoring, 11(1), 83-93, 2012, doi: 10.1177/1475921711406580 Roberge, P, Corrosion inspection and monitoring. New-York: McGraw-Hill John Wiley & Sons, 2007. Jhang, K-Y (2009) "Nonlinear ultrasonic techniques for nondestructive assessment of micro damage in material: A review", International Journal of Precision Engineering and Manufacturing, 10(1), 123-135, 2009 Kruse, W; Zagrai, A N, (2009) "Investigation of linear and nonlinear electromechanical impedance techniques dor detection of fatigue damage in aerospace materials," presented at the 7th International Workshop on Structural Health Monitoring, Stanford, CA, USA, 2009. Laszlo, A; Stanislav, I R (2009) "Parametric Resonance for material characterization", AIP Conference Proceedings, 1096(1), 238-245, 2009 Xiang, Y-X; Deng, M-X (2008) "Cumulative second-harmonic generation of Lamb waves propagating in a two-layered solid plate", Chinese Physics B, 17(11), 4232, 2008 Lee, T H; Choi, I H; K.Y., J (2008) "The nonlinearity of guided wave in an elastic plate", Modern Physics Letter B, 22(11), 1135-1140, 2008 Deng, M (1999) "Cumulative second-harmonic generation of Lamb-mode propagation in a solid plate", Journal of Applied Physics, 85(6), 3051-3058, 1999 Shen, Y; Giurgiutiu, V, "Predictive simulation of nonlinear ultrasonics," presented at the SPIE, San-Diego, 2012. Giurgiutiu., V (2005) "Tuned Lamb wave excitation and detection with piezoelectric wafer active sensors for structural health monitoring", J. Intell. Mater. Syst. Struct., 16, 291-305, 2005 American Institute of Aeronautics and Astronautics